Tag: population

MD counties COVID-19-specific death rate

Since a few weeks, I report the raw number of COVID-19 deaths in Maryland counties. If this gives an idea of the cumulative number of deaths – which is interesting – it doesn’t reflect the fact that some counties have more inhabitants than others. That’s why I plotted below the number of COVID-19 deaths adjusted for the population (i.e. the COVID-19-specific death rate):

(click to see more details)

Today (May 16, 2020), in terms of absolute number of deaths, Montgomery, Prince Georges and Baltimore County are the top 3 counties (this is the same for cases but not in the same order). In terms of confirmed deaths per 100,000 population, the top 3 counties are Kent, Prince Georges and Montgomery.

Rank on May 16, 2020Absolute # of COVID-19 deathsCOVID-19 deaths per 100,000 population
1Montgomery (423)Kent (66.9)
2Prince Georges (399)Prince Georges (43.5)
3Baltimore County (223)Montgomery (40.2)
4Baltimore City (192)Carroll (39.0)
5Anne Arundel (133)Charles (35.8)

Overall in Maryland so far, 1,842 deaths were reported – for a total population of 6,141,808. This gives a COVID-19-specific death rate of 29.9 per 100,000 pop. For comparison, the CDC reported a flu-specific death rate of 2 per 100,000 pop. (for the whole US, 2017) and 863.8 deaths per 100,000 pop. for all-cause deaths.

Source of Maryland County population: projections from the Maryland Department of Planning.
As usual, you’ll find other graphs on my page about COVID-19 in Maryland and the data, code and figures are on Github.

Edited a few minutes after publication to add a paragraph with the comparison with Maryland and flu; adapted the y-axis label following Michael Brown‘s comment on Twitter (thanks!); and specified the flu-specific death rate from CDC following Melissa Schweisguth‘s comment on Twitter (thanks too!).

MD counties COVID-19 cases adjusted for population

Since a few weeks, I report the raw number of COVID-19 cases in Maryland counties. If this gives an idea of the cumulative number of cases – which is interesting – it doesn’t reflect the fact that some counties have more inhabitants than others. That’s why I plotted below the number of COVID-19 cases adjusted for the population:

Evolution of COVID-19 confirmed cases in Maryland counties, adjusted and not adjusted for population, on May 11, 2020
(click to see more details)

Today (May 11, 2020), in terms of absolute number of cases, Prince Georges, Montgomery and Baltimore County are the top 3 counties. In terms of confirmed cases per 100,000 population, the top 3 counties are Prince Georges, Montgomery and Wicomico (due to a recent surge in cases).

Rank on May 11, 2020Absolute # of COVID-19 casesCOVID-19 cases per 100,000 population
1Prince Georges (9,687)Prince Georges (1,057)
2Montgomery (6,909)Montgomery (656)
3Baltimore County (3,948)Wicomico (649)
4Baltimore City (3353)Kent (555)
5Anne Arundel (2492)Baltimore City (544)

This is a lot given that, today, the average for Maryland is 401/100,000 (source: CDC) and the average for the US is 552/100,000 (source: OurWorldInData).

Source of Maryland County population: projections from the Maryland Department of Planning.
As usual, you’ll find other graphs on my page about COVID-19 in Maryland and the data, code and figures are on Github.

Projection of the American ageing population

Yesterday, GOOD issued an infographic of America’s Aging Workforce (reproduced below). One of the key learning I take from it is that many Americans are unprepared for retirement. Indeed, the average American worker has saved $25,000 for retirement but it is estimated she/he will need $350,000 if she/he wishes to retire at 65 (i.e. 14 times more money!).

USA ageing, an infographic by GOOD

I was also wondering: after China and Belgium, how will the population age in the USA?

The US Census Bureau maintains national projections of the population and its latest data is from 2009. Among other things, it takes into account the resident population and demographic components of change (births, deaths, and net international migration). For international migration (in and out of the USA), there are four alternative assumptions (described in the method statement):

  • in the High Net International Migration scenario, they increase the previously projected net international migration by a fixed ratio ;
  • in the Low Net International Migration scenario, they decrease the same previously projected net international migration by the same fixed ratio ;
  • the Constant Net International Migration scenario illustrates the effect a level trend in international migration would have if maintained over the projection period ;
  • finally, in the Zero Net International Migration, the number of immigrants and emigrants is held constant at a value of zero for the entire projection period, thus assuming a closed population and no movement of individuals into or out of the United States.

By proceeding in this way, the overall number of migrants projected to enter or leave the population is (optionally) modified while maintaining the assumptions about the distributions of demographic characteristics.

Now, as expected, the American population is indeed aging. From approximately 12% in 2000 the population above 64 years old will increase to more than 21% in 2050 (in the constant scenario, see below). We also see an acceleration of the increasing number of elderly in the USA between 2010 and 2030. This US estimation is a bit lower than the estimations for China (>23%) and Belgium (>25%).

US Census Bureau estimation of American population aging (2009)

In the graph above, I took the Constant Net International Migration scenario as I consider it as the most conservative. When one plots all the scenarii, we can see the difference is not so big: the US population above 64 years old in 2050 will be between 19% (High scenario) and 23% (Zero scenario) of the total US population (see below).

Influence of the different migration scenarii on US aging population projection (2009)

The main issue remains to maintain older people as much as possible the same levels of health and independence as they enjoyed during their active lives. As highlighted by GOOD, America’s workforce will need to work well past age 65 to save enough money for retirement.

Visualizing how a population grows to 7 billion (NPR)

The NPR has produced a nice visualization / video showing how population grew to 7 billion (original article):

If you want to model the improvement in child survival, you just turn the birth tap off (or nearly). Then, with wealth, prevention, healthcare and better food, the population will also grow older (death tap also turned off or nearly) and during a certain time, lots of adults will be economically active (i.e. they will work and consume). This is a demographic dividend. But it comes with a risk: at the next stage, there might be a disproportionately high number of people compared to / depending on a small number of active adults (the next generation). In addition, if you fill it up slowly but you also empty it slowly, the container risk to be full soon, it all depends on the various rates …

Note that this representation is also very effective to understand the basics of compartmental models in epidemiology 🙂

How to feed 7 billion people?

The world reached a population of 7 billion people at the end of October 2011. United Nations symbolically chose Danica May Camacho, a girl born in Philippine, to mark this global population milestone. I recently wrote about the world population getting older, about non communicable diseases becoming the most dangerous threat to health (here too) or about World Population Day(11th of July 2011). We are now 7 billion and new projections tells us we will be 9.3 billion in 2050. When I heard all the news around this, I couldn’t help but think about Hans Rosling’s presentation on population growth at TED Cannes, in 2010.

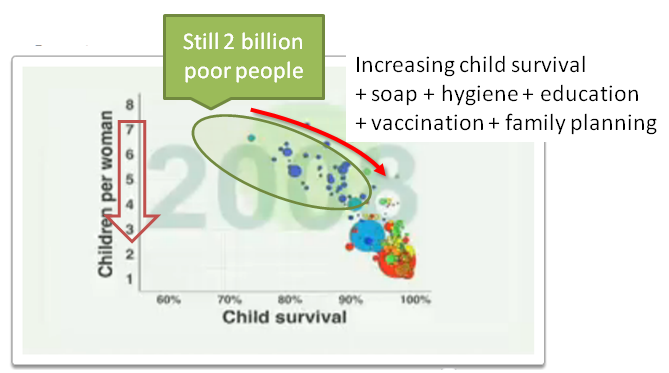
In this presentation, Hand Rosling made a small recap of the situation in 1960, when the world was divided between 1 billion wealthy people and 2 billion poor people. He made this situation more obvious by plotting the number of children per women -vs- the percentage of child survival.

Hans Rosling's population in 1960

Then, if you watch the movie (watch it at the end of this post), you’ll see how the different populations evolved to the situation of 2005 where the differences were still there but less marked than in 1960. And all this was thanks to soap, hygiene, education, vaccination, family planning, …

Hans Rosling's population in 2005

So, one thing is to worry about what would be the world with 7 or 9 billion people. Another thing is to prepare the environment (i.e. both our container – the earth, its ecosystems, its water resources, etc. – and its content – us, other animals and plants, etc.) to cope with such an amount of people. And a third thing is to try to curb that curve and find ways to slow the world population progression.

In the remaining of his talk, Hans Rosling states that one way to curb this population growth is to continue to improve child survival to 90%. This would help reach a sustainable size population of the world. Unfortunately there isn’t any “gold recipe” in order to improve child survival. Two general goals can achieve this (as well as achieve many other things): an improvement in education and a reduction in poverty.

Fertility predictors, from Science magazine

If you improve education (especially of girls/women because they will become/are mothers, they could give their voice in that matter if we give them enough power), you will decrease fertility. The less children you have, the more time you have to take care of each of them, to give them more education, to feed them properly. On the other hand, if you reduce poverty, you also decrease fertility and, at the same time, you have more wealth to take care of your children, to send them to school and to give them proper food. This is not always the case, just generally the case.

Improving child survival will not solve all the issues. An addition of 2 billion people during the next 35 years or so is something big and it will have an impact of every aspect of our lives. But I really like the idea of having a leveraging effect starting from the improvement of child survival.

I let you watch Hans Rosling’s talk, now …

Today is World Population Day

Today, 11th of July 2011, is World Population Day. For that occasion, and as the world population is expected to surpass 7 billion this year, the UNFPA is launching a new campaign: 7 billion people – 7 billion actions.

7 billion actions poster - UNFPA

They highlight 7 key issues to explore:

  1. Poverty and inequality: reducing poverty and inequality also slows population growth.
  2. Women and girls: unleashing the power of women and girls will accelerate progress on all fronts.
  3. Young people: energetic and open to new technologies, history’s largest and most interconnected population of young people is transforming global politics and culture.
  4. Reproductive health and rights: ensuring that every child is wanted and every childbirth safe leads to smaller and stronger families.
  5. Environment: all 7 billion of us, and those who will follow, depend on the health of our planet.
  6. Ageing: lower fertility and longer lives add up to a new challenge worldwide: providing for aging populations.
  7. Urbanization: the next two billion people will live in cities, so we need to plan for them now.

These issues are not new. They are not even original: most bodies or meetings looking at issues for the future have approximately the same issues. But at least it’s another initiative to raise awareness, to think about them. And, most importantly, to act to tackle them.

I don’t think it’s wishful thinking to write that everyone can help. Besides being in the introduction brochure, teaching a child to read, planting a tree, visiting a senior, finding a cure, standing up for others and making someone smile are all simple actions we can do (even if we can’t do all of them, we can do some of them). We can start with our own kids, our own family, our own environment.

What will be your unique story?