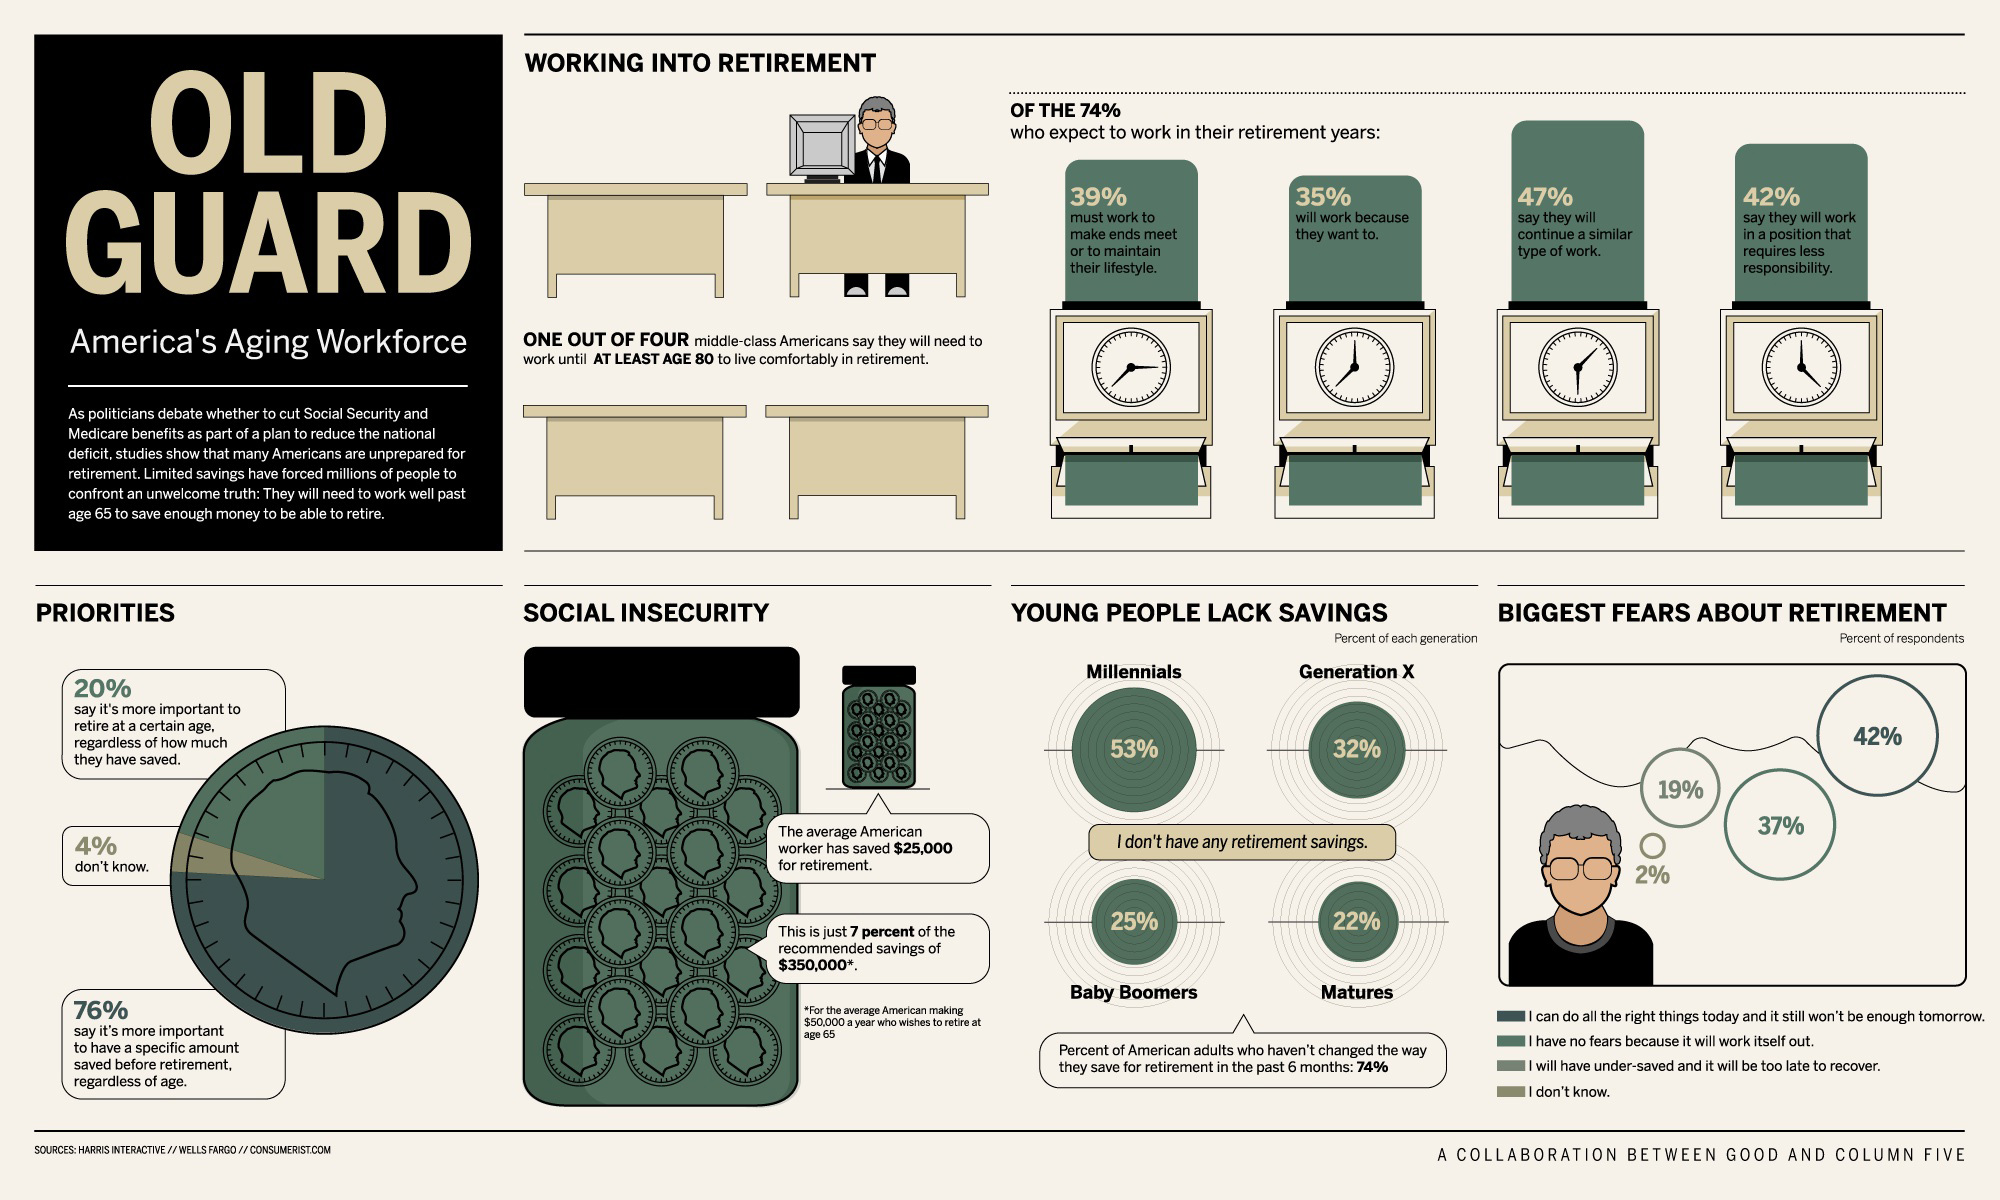
Yesterday, GOOD issued an infographic of America’s Aging Workforce (reproduced below). One of the key learning I take from it is that many Americans are unprepared for retirement. Indeed, the average American worker has saved $25,000 for retirement but it is estimated she/he will need $350,000 if she/he wishes to retire at 65 (i.e. 14 times more money!).
I was also wondering: after China and Belgium, how will the population age in the USA?
The US Census Bureau maintains national projections of the population and its latest data is from 2009. Among other things, it takes into account the resident population and demographic components of change (births, deaths, and net international migration). For international migration (in and out of the USA), there are four alternative assumptions (described in the method statement):
- in the High Net International Migration scenario, they increase the previously projected net international migration by a fixed ratio ;
- in the Low Net International Migration scenario, they decrease the same previously projected net international migration by the same fixed ratio ;
- the Constant Net International Migration scenario illustrates the effect a level trend in international migration would have if maintained over the projection period ;
- finally, in the Zero Net International Migration, the number of immigrants and emigrants is held constant at a value of zero for the entire projection period, thus assuming a closed population and no movement of individuals into or out of the United States.
By proceeding in this way, the overall number of migrants projected to enter or leave the population is (optionally) modified while maintaining the assumptions about the distributions of demographic characteristics.
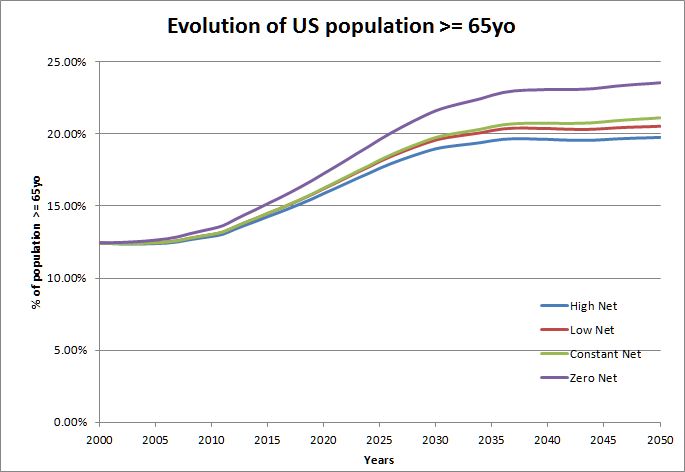
Now, as expected, the American population is indeed aging. From approximately 12% in 2000 the population above 64 years old will increase to more than 21% in 2050 (in the constant scenario, see below). We also see an acceleration of the increasing number of elderly in the USA between 2010 and 2030. This US estimation is a bit lower than the estimations for China (>23%) and Belgium (>25%).

In the graph above, I took the Constant Net International Migration scenario as I consider it as the most conservative. When one plots all the scenarii, we can see the difference is not so big: the US population above 64 years old in 2050 will be between 19% (High scenario) and 23% (Zero scenario) of the total US population (see below).
The main issue remains to maintain older people as much as possible the same levels of health and independence as they enjoyed during their active lives. As highlighted by GOOD, America’s workforce will need to work well past age 65 to save enough money for retirement.