Sometimes, you think that you found something interesting but the Maryland Department of Health is already presenting it on its COVID-19 dashboard 😀
For instance, I calculated the percentage of residents of the different counties ever tested (regardless of the test result). I found out that a third of Maryland counties (8/24) tested at least once more than 25% of their residents. Indeed, as of yesterday (August 10), here are the counties in that category:
County (alphabetical order)
% population ever tested
Baltimore
25.8%
Baltimore City
30.2%
Dorchester
30.4%
Kent
30.6%
Somerset
30.8%
Talbot
28.6%
Washington
27.7%
Wicomico
25%
Maryland counties with more than 25% of their population tested for COVID-19 on August 10, 2020
While we are at it, here are the 5 counties with less than 20% of their population tested (still as of August 10, 2020):
County (alphabetical order)
% of population ever tested
Calvert
14.9%
Cecil
15.3%
Charles
18.6%
Harford
18.1%
Queen Anne’s
19.4%
Maryland counties with less than 20% of their population tested for COVID-19 on August 10, 2020
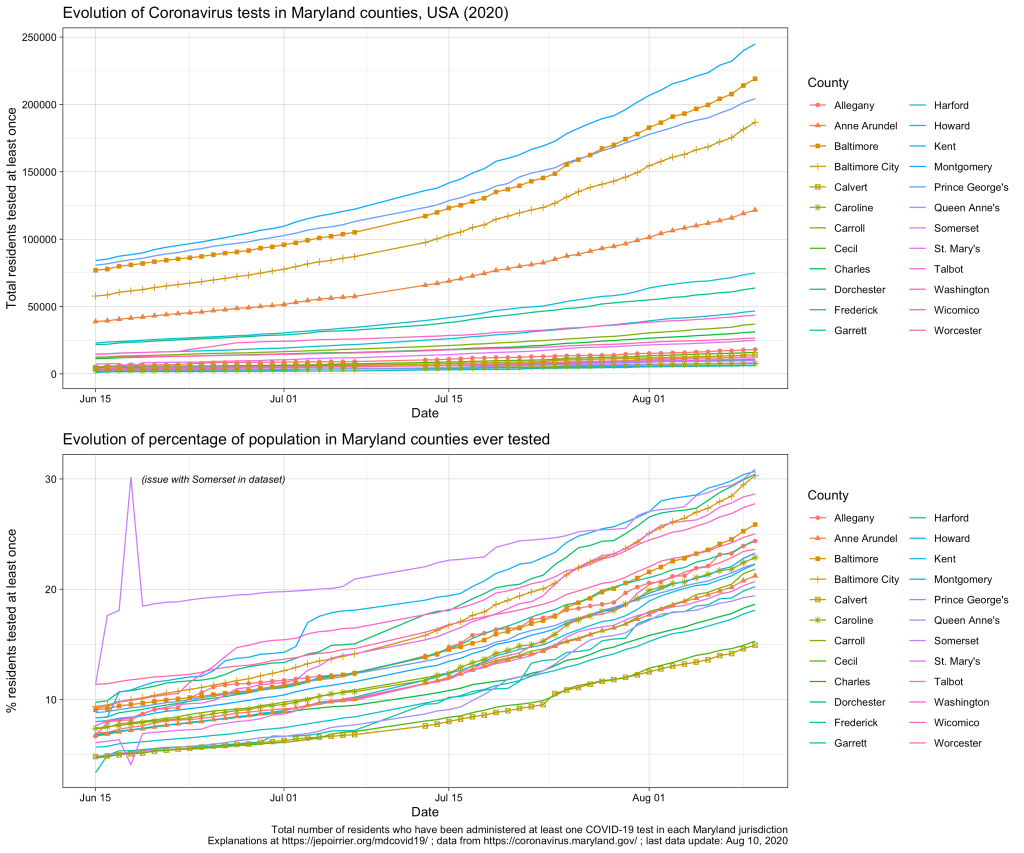
Graphically, we see that all counties are testing more and more, and increasing at approximately the same speed:
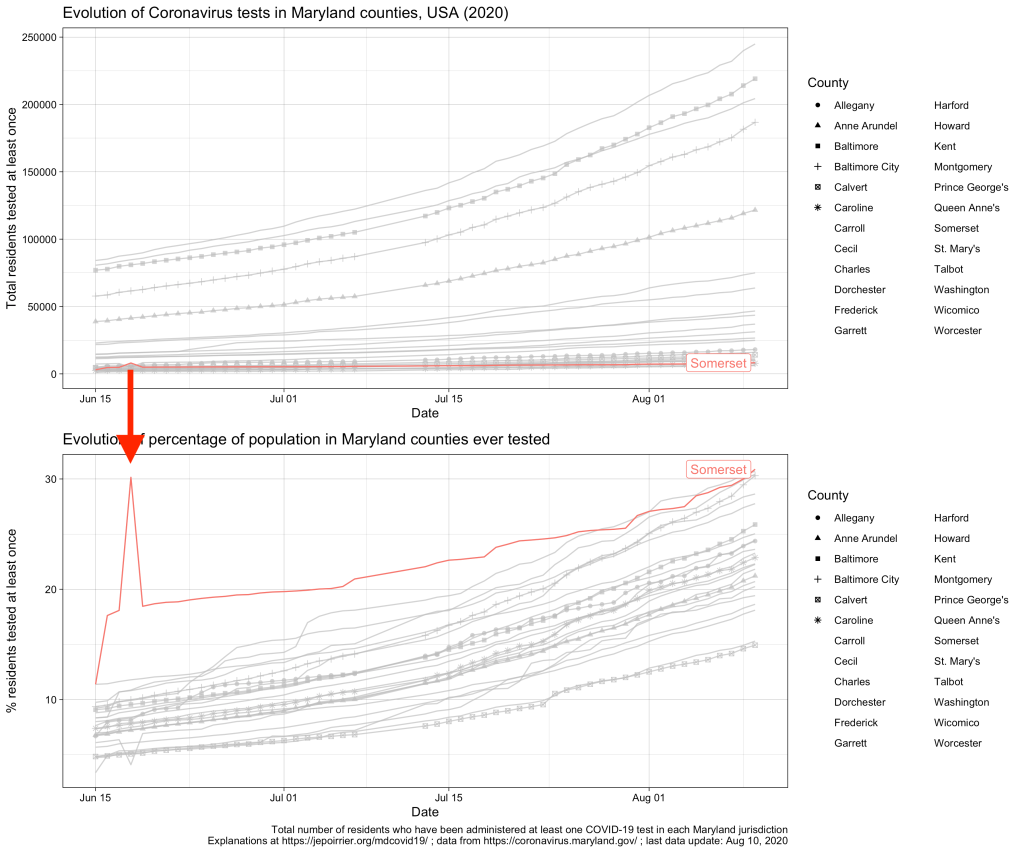
As you can see, there are 2 minor issues with the dataset from the MDH API. First, Somerset reported more than double the normal number of tests on June 18, 2020; it went back to “normal” on the next day (I suspect an encoding error here, see highlight below). Then, there is no data after July 7; data resumes on July 13 (a posteriori, I don’t recall reading any issue about county data collection during that time). None of these prevents looking at the current data.
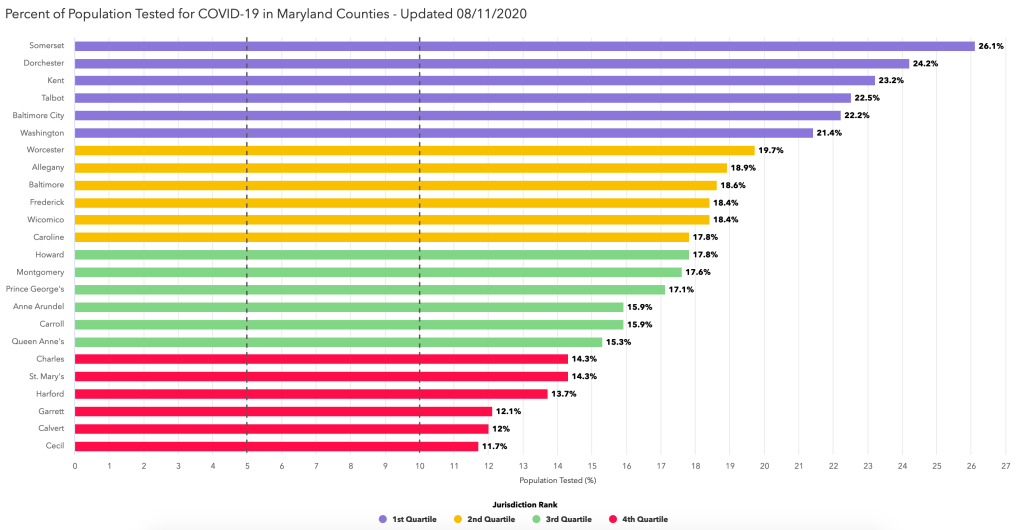
Now, as I mentioned, the official dashboard has already this data, presented by quartile, as a kind of competition between counties 😉 … (the % are slightly different, probably because we are using different sources for the population totals – I’m using the population projections from the Maryland Department of Planning).
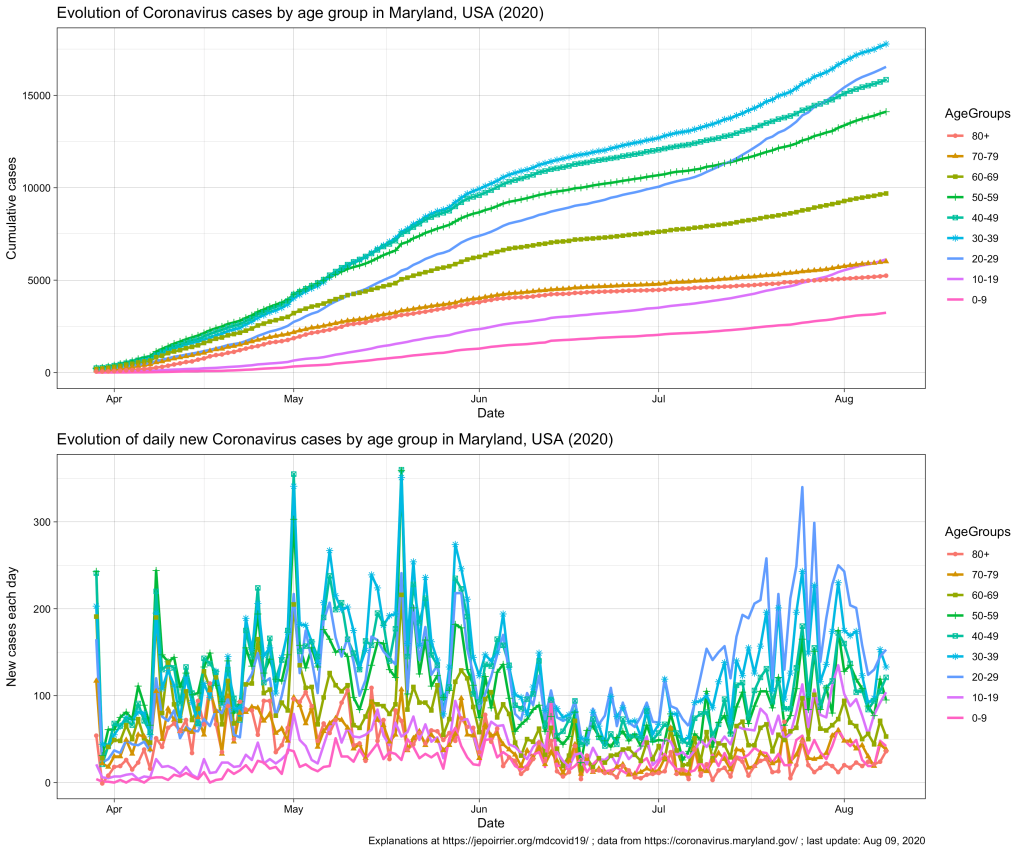
Since mid-July 2020 in Maryland, we understood that the 20-59 yr age group was problematic, especially the 20-29 yr age group that is racing to overtake all age groups in terms of number of COVID-19 cases (relative to their population, see top chart below).
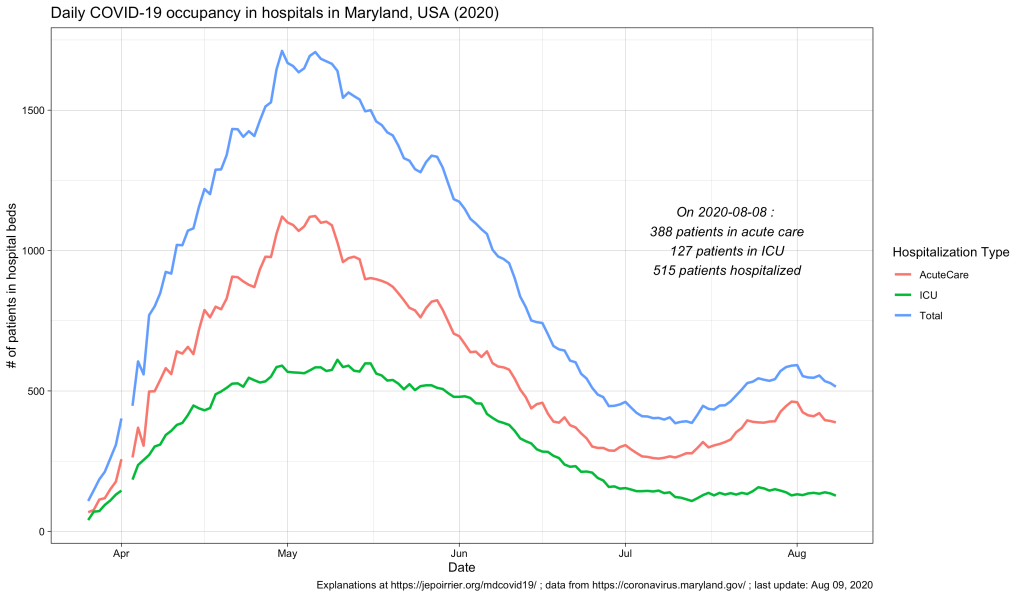
In terms of COVID-19 hospitalizations, we also saw a small rebound (see chart below; it seems that it subsides since beginning of August).
But what we didn’t know (for this small peak as well as since the beginning) was what is the age of these hospitalized populations. Did these hospitalizations impacted more the older adults? The younger ones? Or the children? The Maryland Department of Health COVID-19 dashboard doesn’t report that information (nor in the API).
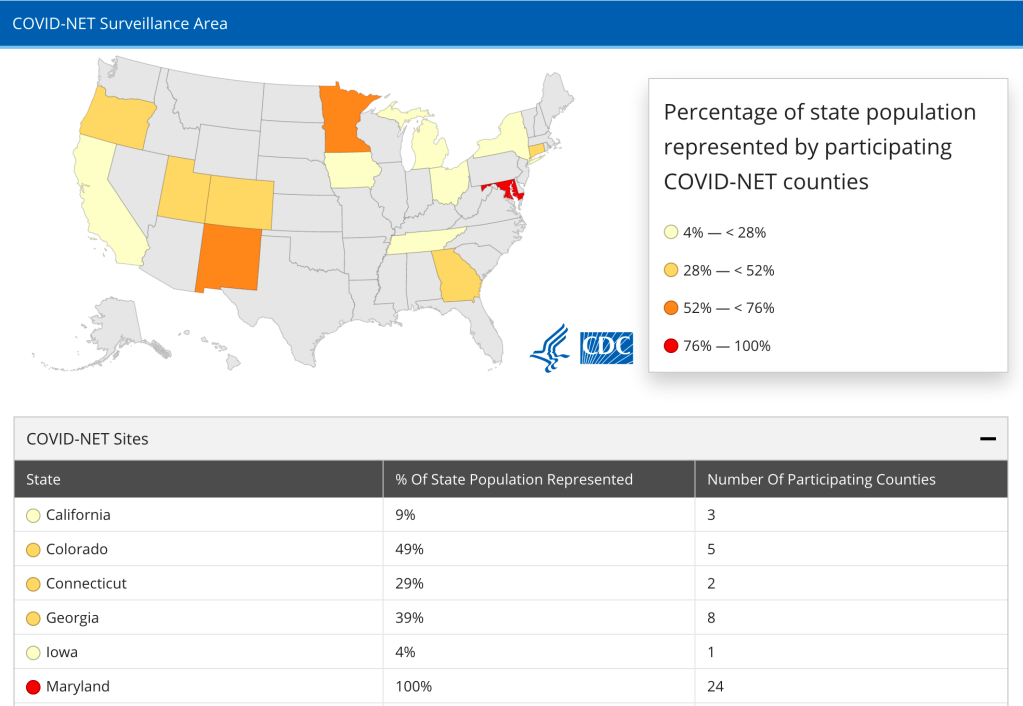
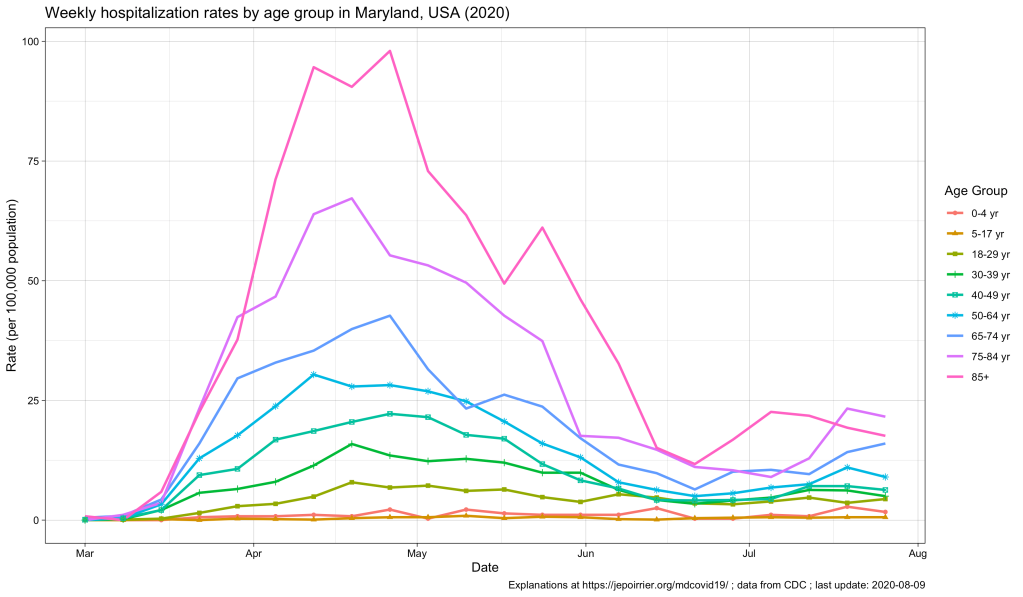
Now, the CDC also has an interactive graph where you can see and filter the data by yourself. Here is the situation up to August 9, 2020, for Maryland:
The peak of April-May is well represented, with the 85+ population reaching a peak at nearly 100 weekly hospitalizations per 100,000 pop. All the other age groups increased during that time, the older the higher (unfortunately).
Now, since July, we see some of these age groups increase again. At the end of July:
Age group
Weekly hospitalization rate
65-74 yr
16.0
75-84 yr
21.6
85+ yr
17.6
Weekly hospitalization rates for the week of July 27, 2020 in Maryland, MD, USA
This, in my opinion, reinforce the view that, cases might be increasing in the younger population (also thanks to testing being more available) and children and young adults might be less impacted when infected. But the older population is the first impacted by any increase in cases. It was true in April-May. It is again the case with this small peak. If we should take preventative measures to contain COVID-19, it is for us – but especially for the older population, our parents.
We moved our family from the US (Maryland, just in case you didn’t know yet) to Belgium – no big deal. During the COVID-19 pandemic, in July-August 2020 – now we’re talking …
I wrote this post to document our journey. We were (and still are) extremely privileged to have been able to do this, in the conditions we did it. The journey is not over. I’ll update and continue to document it until we fall back into something more “normal” … [long post]
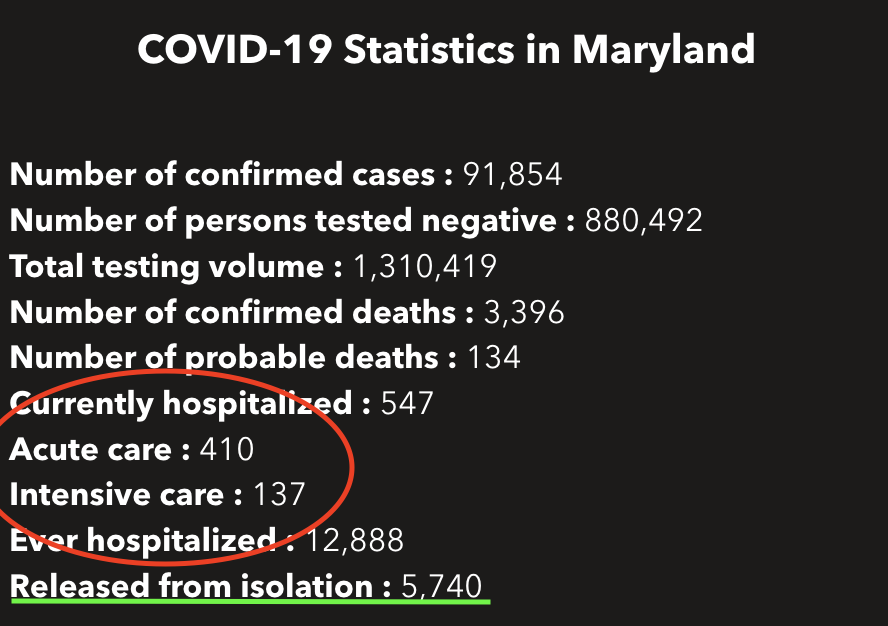
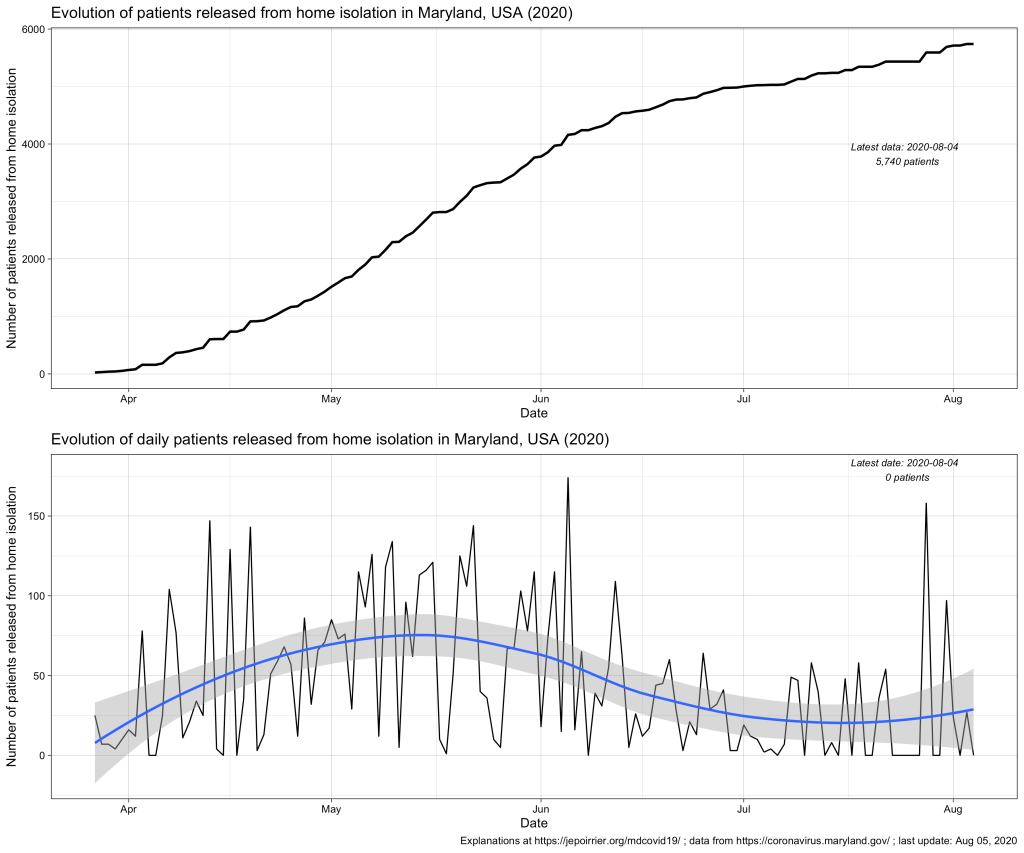
Total Number Released from Isolation data layer is a collection of the statewide cumulative total of individuals who tested positive for COVID-19 that have been reported each day by each local health department via the ESSENCE system as having been released from home isolation. As “recovery” can mean different things as people experience COVID-19 disease to varying degrees of severity, MDH reports on individuals released from isolation. “Released from isolation” refers to those who have met criteria and are well enough to be released from home isolation. Some of these individuals may have been hospitalized at some point.
Definition of “release from isolation” according to the MDH API (emphasis is mine)
Therefore, mentioning the number of patients released from (home) isolation just below the current number of patients in hospital (as it is currently the case on the MDH dashboard) is a bit misleading: this metric is related to home isolation, which is very different than isolation in hospital.
According to the MDH FAQ on isolation and quarantine, there is no mandate to isolate newly diagnosed positive COVID-19 cases. These cases should follow their healthcare provider’s guidance. In the same document, it also appears that there is no mandate to be notified of the end of isolation. There is a guidance with 3 conditions from the CDC (≥ 10 days since first symptoms, ≥ 24 hours without fever and all COVID-19 symptoms are better – note they don’t need to disappear). These are exactly the conditions written in the CDC Guidance on Discontinuing Home Isolation for Persons with COVID-19 (consulted on August 5, 2020). So I don’t know exactly how this “released from isolation” data is collected.
To add to the confusion, the API page indicates that the data is provided by Maryland’s ESSENCE (Electronic Surveillance System for the Early Notification of Community-based Epidemics). But this system takes most if its data from Maryland acute care hospitals. So would that mean that hospitals direct the end of home isolation and report these numbers? It could be patients released from hospital and asked to isolate at home: so far, there were a total of 12,888 hospitalizations due to COVID-19 in Maryland. It would mean less than half of these patients would have been asked to continue to isolate at home after their hospital release (up to August 4, 2020, the data says that a total of 5,740 COVID-19 cases were released from home isolation). This is 1/20th of the total of positive cases so far (91,854) so I’m not sure we can link these two metrics.
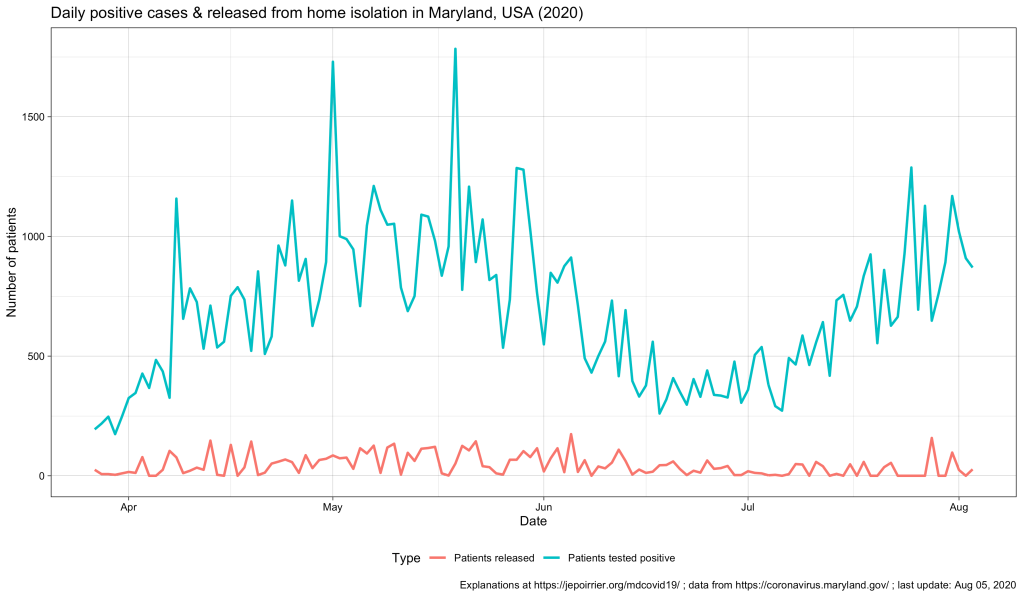
On a daily basis, the second chart (above) shows a kind of cycle with a peak around mid-May – early-June and a trend that increases again end of July. This blue, smoothed curve really looks like the curve of positive cases so I plotted them both below (cases in blue, releases in red). We can see the 2 peaks for both curves but we can’t really distinguish any relay in patients released (red), compared to the positive cases (blue) (this would have made sense since releases follow reporting of cases, by definition – a confounding factor may be the delay in case reporting that may blur the time difference). But the graph also shows us the difference in magnitude between the number of cases (high) and, indirectly, the number of people that were in isolation at home (then released – low).
So I still don’t really know what to think of this metric. If you have any idea, please tell me! Thanks!
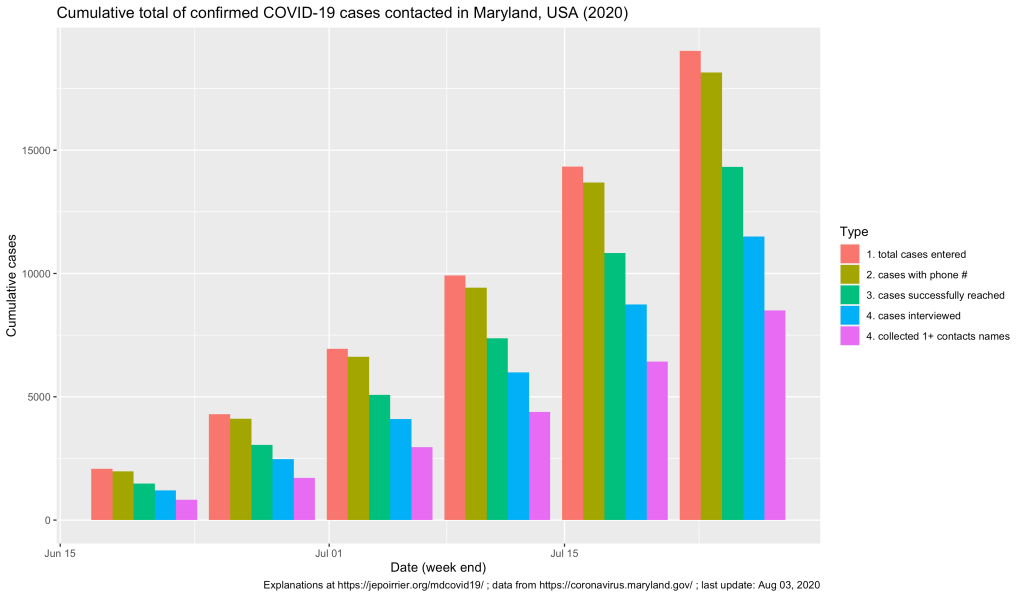
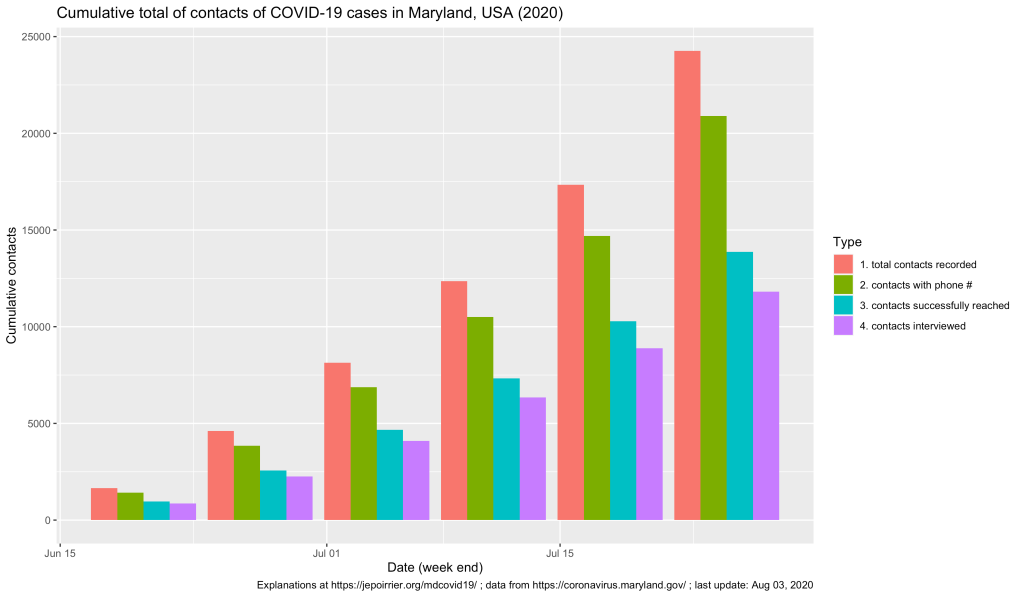
I may have missed when the data was first released but I discovered the Maryland Department of Health (MDH) is publishing some data about COVID-19 contact tracing (in Maryland). This data is not on the main COVID-19 dashboard but on the contact tracing page (and in the datasets that can be downloaded). Here is a first insight of what happened so far …
Note: if you just look for where to get tested in Maryland, the official information is here.
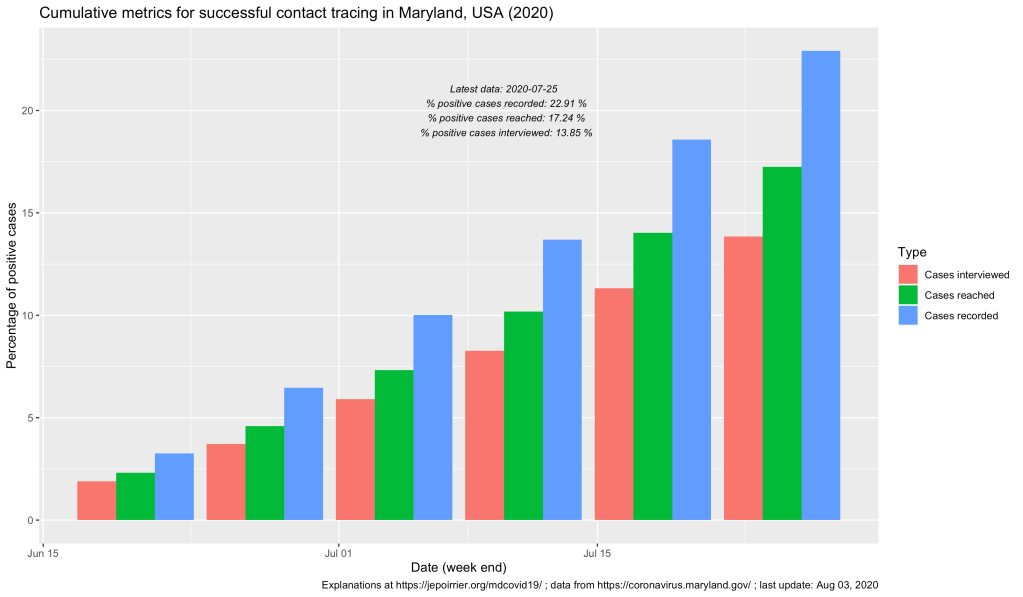
On the graph above, one can see that, up to the week ending on July 25, a bit more than 19,000 COVID-19 cases were recorded in covidLINK, Maryland’s contact tracing initiative. However, only a bit more than 18,000 of these cases had a phone number registered and only 11,504 were successfully interviewed (this take into account people who refused to be interviewed, who cannot be accessed, etc.). If the number of cases registered and the ultimate number of cases interviewed keep increasing (something good), one should remember that, on July 25, Maryland counted 83,054 positive cases (reported in ESSENCE). This leads us to only 22% of all positive cases were reported in covidLINK (blue bars below) and only 13% of all positive cases were interviewed (pink bars below). These trends increased (good) but if only 1/7th of all cases are interviewed, that’s not a lot and we are missing a lot of potential transmissions.
The MDH also report some information on contacts from these cases. One can see below that more and more contacts are … contacted (!) and their interviews are also increasing. At the end of the week (ending on) July 25, 24,260 contacts were registered by all cases and 11,816 of these contacts were interviewed. If cases who are also contacts are not counted in the two datasets, it’s so far a total of more than 23,000 cases and contacts who were interviewed for their symptoms and contacts in relation to COVID-19!
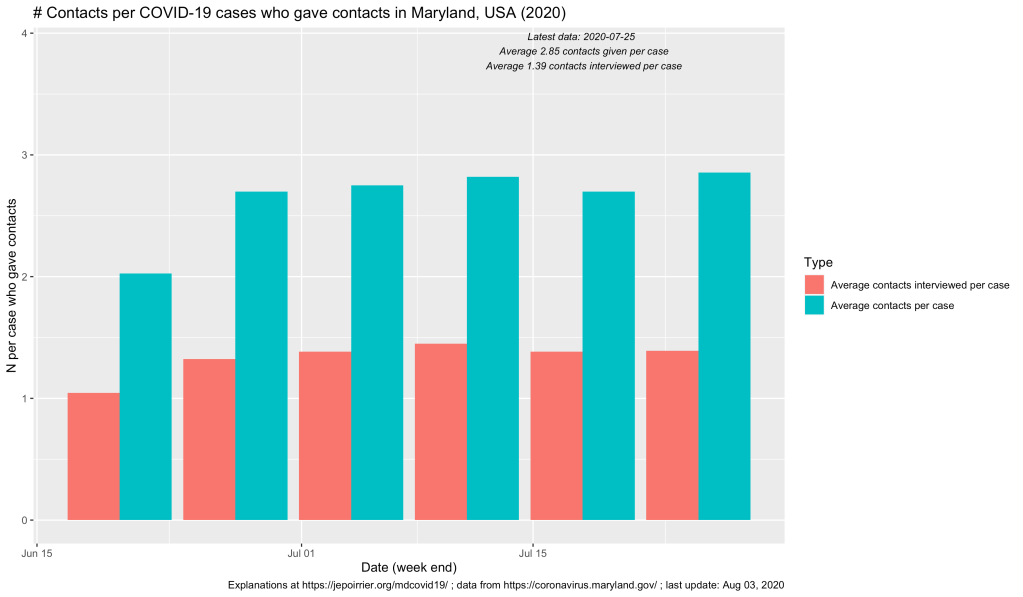
Now, we reach an average of 2.85 contacts declared by positive case (that’s not a lot! The covidLINK FAQ doesn’t mention how far in the past contact tracers go back, just that they “may ask about your whereabouts for a specific period of time”). And on average, 1.39 contact per case are interviewed …
That’s a already gigantic work that has been done by the 1,350 contact tracers! More resource and more cooperation will increase these metrics (and it’s badly needed!). But that’s already a first look at the necessary contact tracing operation in Maryland.