The Adafruit PyPortal is a great device, with a few bells an whistles already integrated in order to start small electronic projects (but expensive, ok ;-)). As usual, Adafruit wrote a nice introductory guide. But some parts are outdated. Therefore, here are a few steps to get you started with CircuitPython on a PyPortal in 2021 …
Continue reading “Start with a PyPortal in 2021”Category: Open Source
Digitize you charts with Engauge Digitizer
A few words of appreciation for an open source software that can help you a lot in your work, Engauge Digitizer (ED) from Mark Mitchell. ED is a simple, straightforward curve digitizer: it takes images with graphs like the one below and transform them (with a little help) in data you can use later on.

Continue reading “Digitize you charts with Engauge Digitizer”
Fedora 23 on a Dell XPS13 (part 1)
Taking advantage of a trip to Canada and a very favourable CAN$:€ exchange rate, I bought a Dell XPS13 (9350 or “late 2015”), following excellent reviews from around the web. Dell sold a ‘developer edition‘ of this laptop (shipping with Ubuntu Linux) but unfortunately it was out of stock on Dell US and I couldn’t find the item on the Dell Canada website. So I bought the Windows version with a touchscreen (it was Black Friday :-)).
 Here is how to install Fedora 23 on it (and probably most other Linux distribution) … I will focus on three aspects (in brief: everything works out of the box, except the wireless card that needed some additional action):
- How to boot and install Fedora Workstation
- What works and what doesn’t work out of the box
- Some things to do after installation (additional software)
Import PDFs and related metadata in Zotero
I discover new things everyday …
I wrote earlier that I really liked Zotero, a reference management software. However, there is one thing that was missing, imho: the capability to import PDFs (individually or in bulk) and correctly fill in the various fields of the reference.
But in fact, this already exists in Zotero! Just drag a PDF in the middle section (the reference list) then right-click on it and choose “Retrieve Metadata from PDF” (*). Retrieval of the title, the authors, the journal, etc. everything goes very fast and they are stored as a normal reference, now on the right.

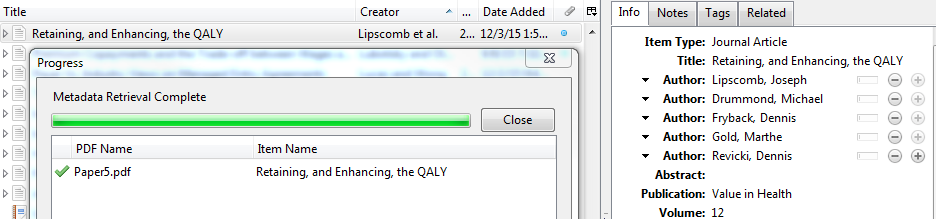
Now, it works for most papers I tested yesterday and today. Most major editors are supported (it seems Zotero doesn’t actually extract metadata from the PDF but finds these metadata by comparing the PDF content with Google Scholar). As hinted in the Zotero support page for this function, please re-check the imported reference in case something went wrong (I imported something like 20 references since yesterday with this function and I didn’t spot any error for the moment).
Bulk import and metadata retrieval works too: just import several PDFs at the same time and, while all of them are selected in Zotero, right-click on them and choose “Retrieve Metadata for PDF”.
As mentioned earlier, “it’s just plain efficiency, without bells and whistles“. It just works 🙂
(*) On MS-Windows, on the first use, you might see a dialog box warning you that you must first install the “PDF tools”.

If you see it, just choose the “Open preferences” button and follow the very intuitive procedure. The installation takes 30 seconds maximum, download included.
Happy to use Zotero since a few weeks
 For my work I need to reference a lot of statements, mainly with papers and books in the biological / medical literature. Usually “professionals” use two proprietary software, Reference Manager or EndNote (both owned by Thomson Reuters). But there are a few very interesting free alternatives (see this comparison of reference management software).
I switched from Mendeley to Zotero a few weeks ago and I’m very happy. Here is why … Continue reading “Happy to use Zotero since a few weeks”
How to write data from R to Excel (even if you don’t have Excel)
Following my previous posts on how to read/write Excel files from Matlab here is the way I use to read/write Excel files from R. Again it seems the Apache POI java library made developers’life easy. I use here the simple-yet-powerful xlsx package (documentation here in PDF; project website).
Here you don’t need to install any additional files, installing the xlsx package from R does all the dirty work that for you. Then, reading an Excel file is very easy:
libary(xlsx)
inData <- read.xlsx2("input.xls", sheetName="Contactmatrix", header=FALSE)
I usually use read.xlsx2 instead of read.xlsx. It is said to be faster with large matrices and I had the opportunity to experience it – so I stick with this. You can read xls, xlsx and xlsm files without issue (well, with the simple formatting I usually use).
Writing to an Excel file is also very easy:
write.xlsx2(outData, "output.xls", sheetName="Random2", col.names=FALSE, row.names=FALSE)
Easy, isn’t it?
Map of GAVI eligible countries in R
I was trying to reproduce the map of the GAVI Alliance eligible countries (btw I was surprised India is eligible – but that’s the beauty of relying on numbers only and not assumptions) in R. This is the original map (there are 57 countries eligible):

I started to use the R package rworldmap because it seemed the most appropriate for this task. Everything went fine. Most of the time was spent converting the list of countries from plain English to plain “ISO3” code as required (ISO3 is in fact ISO 3166-1 alpha-3). I took my source from Wikipedia.
Well, that was until joinCountryData2Map gave me this reply:
54 codes from your data successfully matched countries in the map
3 codes from your data failed to match with a country code in the map
189 codes from the map weren’t represented in your data
I should have better simply read the documentation: there is another small command that needs not to be overlooked, rwmGetISO3. What are the three codes that failed to match?
Although you can compare visually the map produced with the map above, R (and rworldmap) can indirectly give you the culprits:
tC2 = matrix(c("Afghanistan", "Bangladesh", "Benin", "Burkina Faso", "Burundi", "Cambodia", "Cameroon", "Central African Republic", "Chad", "Comoros", "Congo, Dem Republic of", "Côte d'Ivoire", "Djibouti", "Eritrea", "Ethiopia", "Gambia", "Ghana", "Guinea", "Guinea Bissau", "Haiti", "India", "Kenya", "Korea, DPR", "Kyrgyz Republic", "Lao PDR", "Lesotho", "Liberia", "Madagascar", "Malawi", "Mali", "Mauritania", "Mozambique", "Myanmar", "Nepal", "Nicaragua", "Niger", "Nigeria", "Pakistan", "Papua New Guinea", "Rwanda", "São Tomé e Príncipe", "Senegal", "Sierra Leone", "Solomon Islands", "Somalia", "Republic of Sudan", "South Sudan", "Tajikistan", "Tanzania", "Timor Leste", "Togo", "Uganda", "Uzbekistan", "Viet Nam", "Yemen", "Zambia", "Zimbabwe"), nrow=57, ncol=1)
apply(tC2, 1, rwmGetISO3)
In the results, some countries are actually given in a slightly different way by GAVI than in R. For instance “Congo, Dem Republic of” should be changed for rworldmap in “Democratic Republic of the Congo” (ISO3 code: COD). Or “Côte d’Ivoire” should be changed for rworldmap in “Ivory Coast” (ISO3 code: CIV). An interesting resource for country names recognised by rworld map is the UN Countries or areas, codes and abbreviations. Once you correct this, you can have your map of GAVI-eligible countries:

And here is the code:
# Displays map of GAVI countries
library(rworldmap)
theCountries <- c("AFG", "BGD", "BEN", "BFA", "BDI", "KHM", "CMR", "CAF", "TCD", "COM", "COD", "CIV", "DJI", "ERI", "ETH", "GMB", "GHA", "GIN", "GNB", "HTI", "IND", "KEN", "PRK", "KGZ", "LAO", "LSO", "LBR", "MDG", "MWI", "MLI", "MRT", "MOZ", "MMR", "NPL", "NIC", "NER", "NGA", "PAK", "PNG", "RWA", "STP", "SEN", "SLE", "SLB", "SOM", "SDN", "SSD", "TJK", "TZA", "TLS", "TGO", "UGA", "UZB", "VNM", "YEM", "ZMB", "ZWE")
GaviEligibleDF <- data.frame(country = c("AFG", "BGD", "BEN", "BFA", "BDI", "KHM", "CMR", "CAF", "TCD", "COM", "COD", "CIV", "DJI", "ERI", "ETH", "GMB", "GHA", "GIN", "GNB", "HTI", "IND", "KEN", "PRK", "KGZ", "LAO", "LSO", "LBR", "MDG", "MWI", "MLI", "MRT", "MOZ", "MMR", "NPL", "NIC", "NER", "NGA", "PAK", "PNG", "RWA", "STP", "SEN", "SLE", "SLB", "SOM", "SDN", "SSD", "TJK", "TZA", "TLS", "TGO", "UGA", "UZB", "VNM", "YEM", "ZMB", "ZWE"),
GAVIeligible = c(1, 1, 1, 1, 1, 1, 1, 1, 1, 1, 1, 1, 1, 1, 1, 1, 1, 1, 1, 1, 1, 1, 1, 1, 1, 1, 1, 1, 1, 1, 1, 1, 1, 1, 1, 1, 1, 1, 1, 1, 1, 1, 1, 1, 1, 1, 1, 1, 1, 1, 1, 1, 1, 1, 1, 1, 1))
GAVIeligibleMap <- joinCountryData2Map(GaviEligibleDF, joinCode = "ISO3", nameJoinColumn = "country") mapCountryData(GAVIeligibleMap, nameColumnToPlot="GAVIeligible", catMethod = "categorical", missingCountryCol = gray(.8))
Android is catching up iOS
 Well, there is nothing new in this statement. The smartphone OS Android is catching up and even overtaking its rival iOS in many domains:
- more activated products per day and per year in 2011,
- more Samsung Galaxy S3 (running Android) sold in Q3 2012 than iPhone4 and 5S (running iOS),
- more devices worldwide,
- catching up Apple’s market share in tablets,
- …
All this is summarised in an infographics MBA Online designed (the original address is here: http://www.mbaonline.com/android/ – click at your own risk). It is sweet and colorful, with lots of numbers and some references in the end. Unfortunately these references are embedded in the image so you cannot click on them if you ever want to read more info.
Also as I mentioned previously (for an infographics coming from a similar type of website), I didn’t like much the fact it was very, very long (see reduced copy on the right). It makes things easily read while scrolling down. But ymmv I would have like something a bit more different. For instance I would have seen this more as a succession of slides, a-la Pechakucha maybe (except there is a lot of text). But the restrictive license (CC-by-nc-nd) prohibits derivative works.
So I like my Android device. I like when people promote it, are proud that Android is a success and talk about it. And the web is full of these infographics: a similar story about taking over the world, the successive Android versions (again very long), tastes of Android users (versus iOS users’), a broader smartphone comparison (again very long), a Google search for it, … Choose the one you like!
How to write data from Matlab to Excel (especially when you don’t have Excel)
If you are using Matlab on a MS-Windows PC with MS-Excel installed, there is no problem reading and writing data to Excel (in case your users/customers only understand this software but you still want to do the computations in Matlab). Here is the code to read (1st line) and write (2nd line):
inputs = xlsread('inputfile.xls', 'inData', 'A1:B3');
[writeStatus, writeMsg] = xlswrite('outputfile.xls', myMatrix, 'outData', 'A1');
Now, there are several reasons why you may not be able to read and write directly to an Excel file: you have Matlab but
- you are on MS-Windows but MS-Excel is not installed (if you use OpenOffice.org, csv files in general or on a server where even Microsoft discourage the use of Excel in back-end, see “More information” here);
- you are on MacOS;
- you are on Linux;
- etc.
 Matlab provides a basic way to read and write in these cases:
 xlsread() will only read some xls files (saved as version 97-2003, which should not be an issue – at least this is an Excel file) ; xlswrite() will only write a .csv file. So you can’t deliver the Excel output.
Fortunately Open Source software is here to help you!
Indeed two recently published code on Matlab Central allow you to write “directly” to Excel.
The first solution is provided by Marin Deresco and apparently uses his own binder to Excel. The most simple code is:
display(['Add Java paths']);
javaaddpath('D:\JExcelAPI\jxl.jar');
javaaddpath('D:\JExcelAPI\MXL.jar');

display(['Writing matrix to file']);
writeStatus = xlwrite('output.xls', myMatrix, 'outData');
display(['writeStatus: "' num2str(writeStatus) '"']); % 1 = success, 0 = failure
I advise you to put the two .jar files in a central location (as done in the code above). That way all you functions will have access to the same version of these files (and updating them for all your projects will be much easier).
But there are three small issues. First the generated matrix will contain only text fields (and they are formatted as text fields, not numbers) ; it doesn’t really matter because Excel can then use this text as numbers directly. Then the second issue is that although it will actually write the requested data, there will be an error when opening the Excel file if you specified a sheet (‘outData’ here) that already exists. Finally you can only start writing at A1.
The second solution is provided by Alec de Zegher, partly in response to the limitation of the previous code. Alec is taking advantage of the Apache POI java library to handle the writing-side. His code also allows to start writing anywhere in the sheet. And it uses the same call structure:
display(['Add Java paths']);
javaaddpath('D:\poi_library\poi-3.8-20120326.jar');
javaaddpath('D:\poi_library\poi-ooxml-3.8-20120326.jar');
javaaddpath('D:\poi_library\poi-ooxml-schemas-3.8-20120326.jar');
javaaddpath('D:\poi_library\xmlbeans-2.3.0.jar');
javaaddpath('D:\poi_library\dom4j-1.6.1.jar');

display(['Writing matrix to file']);
writeStatus = xlwrite('output.xls', myMatrix, 'outData', 'B2');
display(['writeStatus: "' num2str(writeStatus) '"']); % 1 = success, 0 = failure
As you can see there are some more .jar to add. On the other hand, it uses a syntax that is very similar to the previous one and to the original Matlab command. Thanks, Marin and Alec, for this great help!
This was tested on Matlab R2012a on a Windows XP 64-bits and with the MCR (same version) on a Windows 2008 64-bits – according to the respective pages for the code, it should work on Mac and other platforms/configurations too.
Photo credits: matlab rubiks cube by gusset, on Flickr (licence by-nc-sa)
Android-based smartphones market share in Asia
31%
Tonight I was wondering what was Android market share in Asia. It is 31% according to a recent study from Ericsson’s ConsumerLab group (reported by TechRepublic). Although dominant through most studied countries, Android is not dominant in Singapore (iOS has 46%), in Indonesia (RIM has 29%) nor in Vietnam (Symbian has 26%).

Last year ABI Research released a study where they showed that Android-based smartphones market share grew from 16% in 2010 to 52% in 2011 (but this included tablets and did not cover exactly the same countries as the Ericsson study). Voila 🙂
