This page is looking at trends in COVID-19 cases/hospitalizations/deaths in Belgium.
I started this page to gather in one place all links to my blog posts on specific aspects of COVID-19 in Belgium, links to tools I developed as well as all figures generated (at the bottom). This will be updated as new posts/tools/figures are written. If you want to update all these analysis, all my code and figures are here, for free. And, as always, feel free to send me suggestions, comments and questions!
Note that if you want official information about COVID-19 in Belgium, please visit the Belgian government’s official COVID-19 page.
Blog posts:
- October 27, 2020 – COVID-19 cases in Wallonia schools
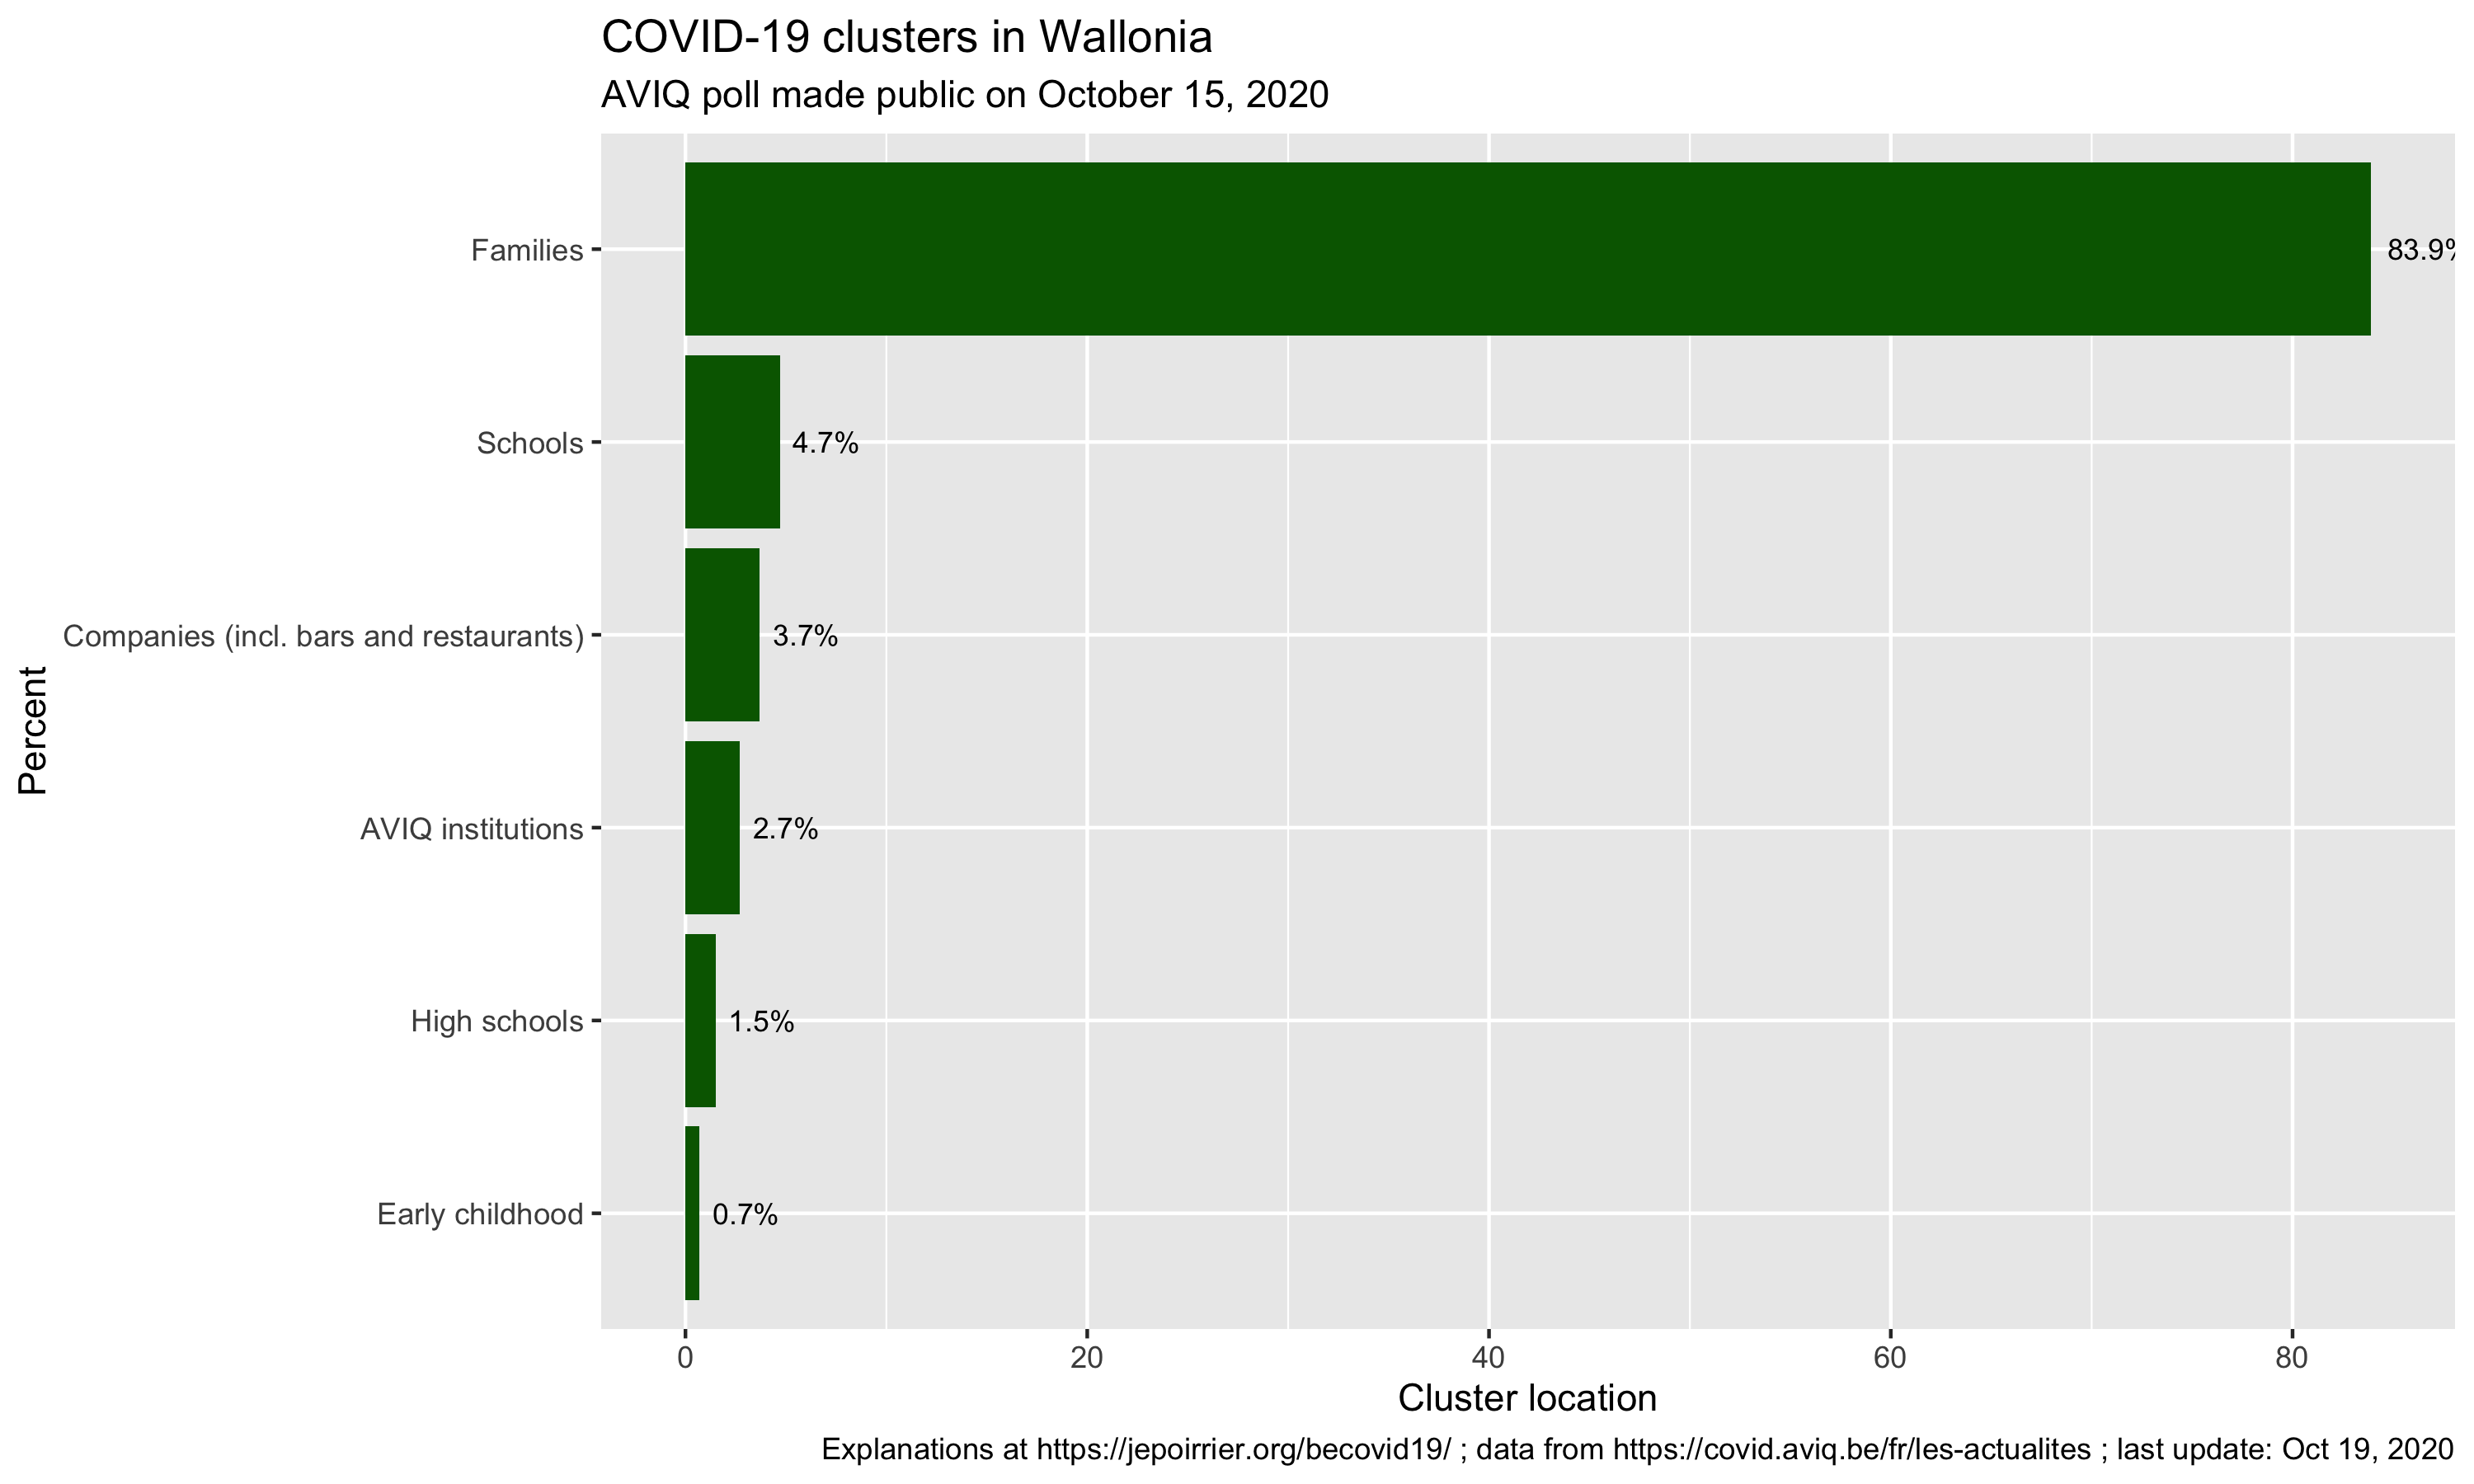
- October 20, 2020 – COVID-19 clusters in Belgium
Figures. These figures are all on the Github repo, in the figures/ directory. While they are not too many, I’ll link them below (they are updated automatically). You may click on them to better see details.
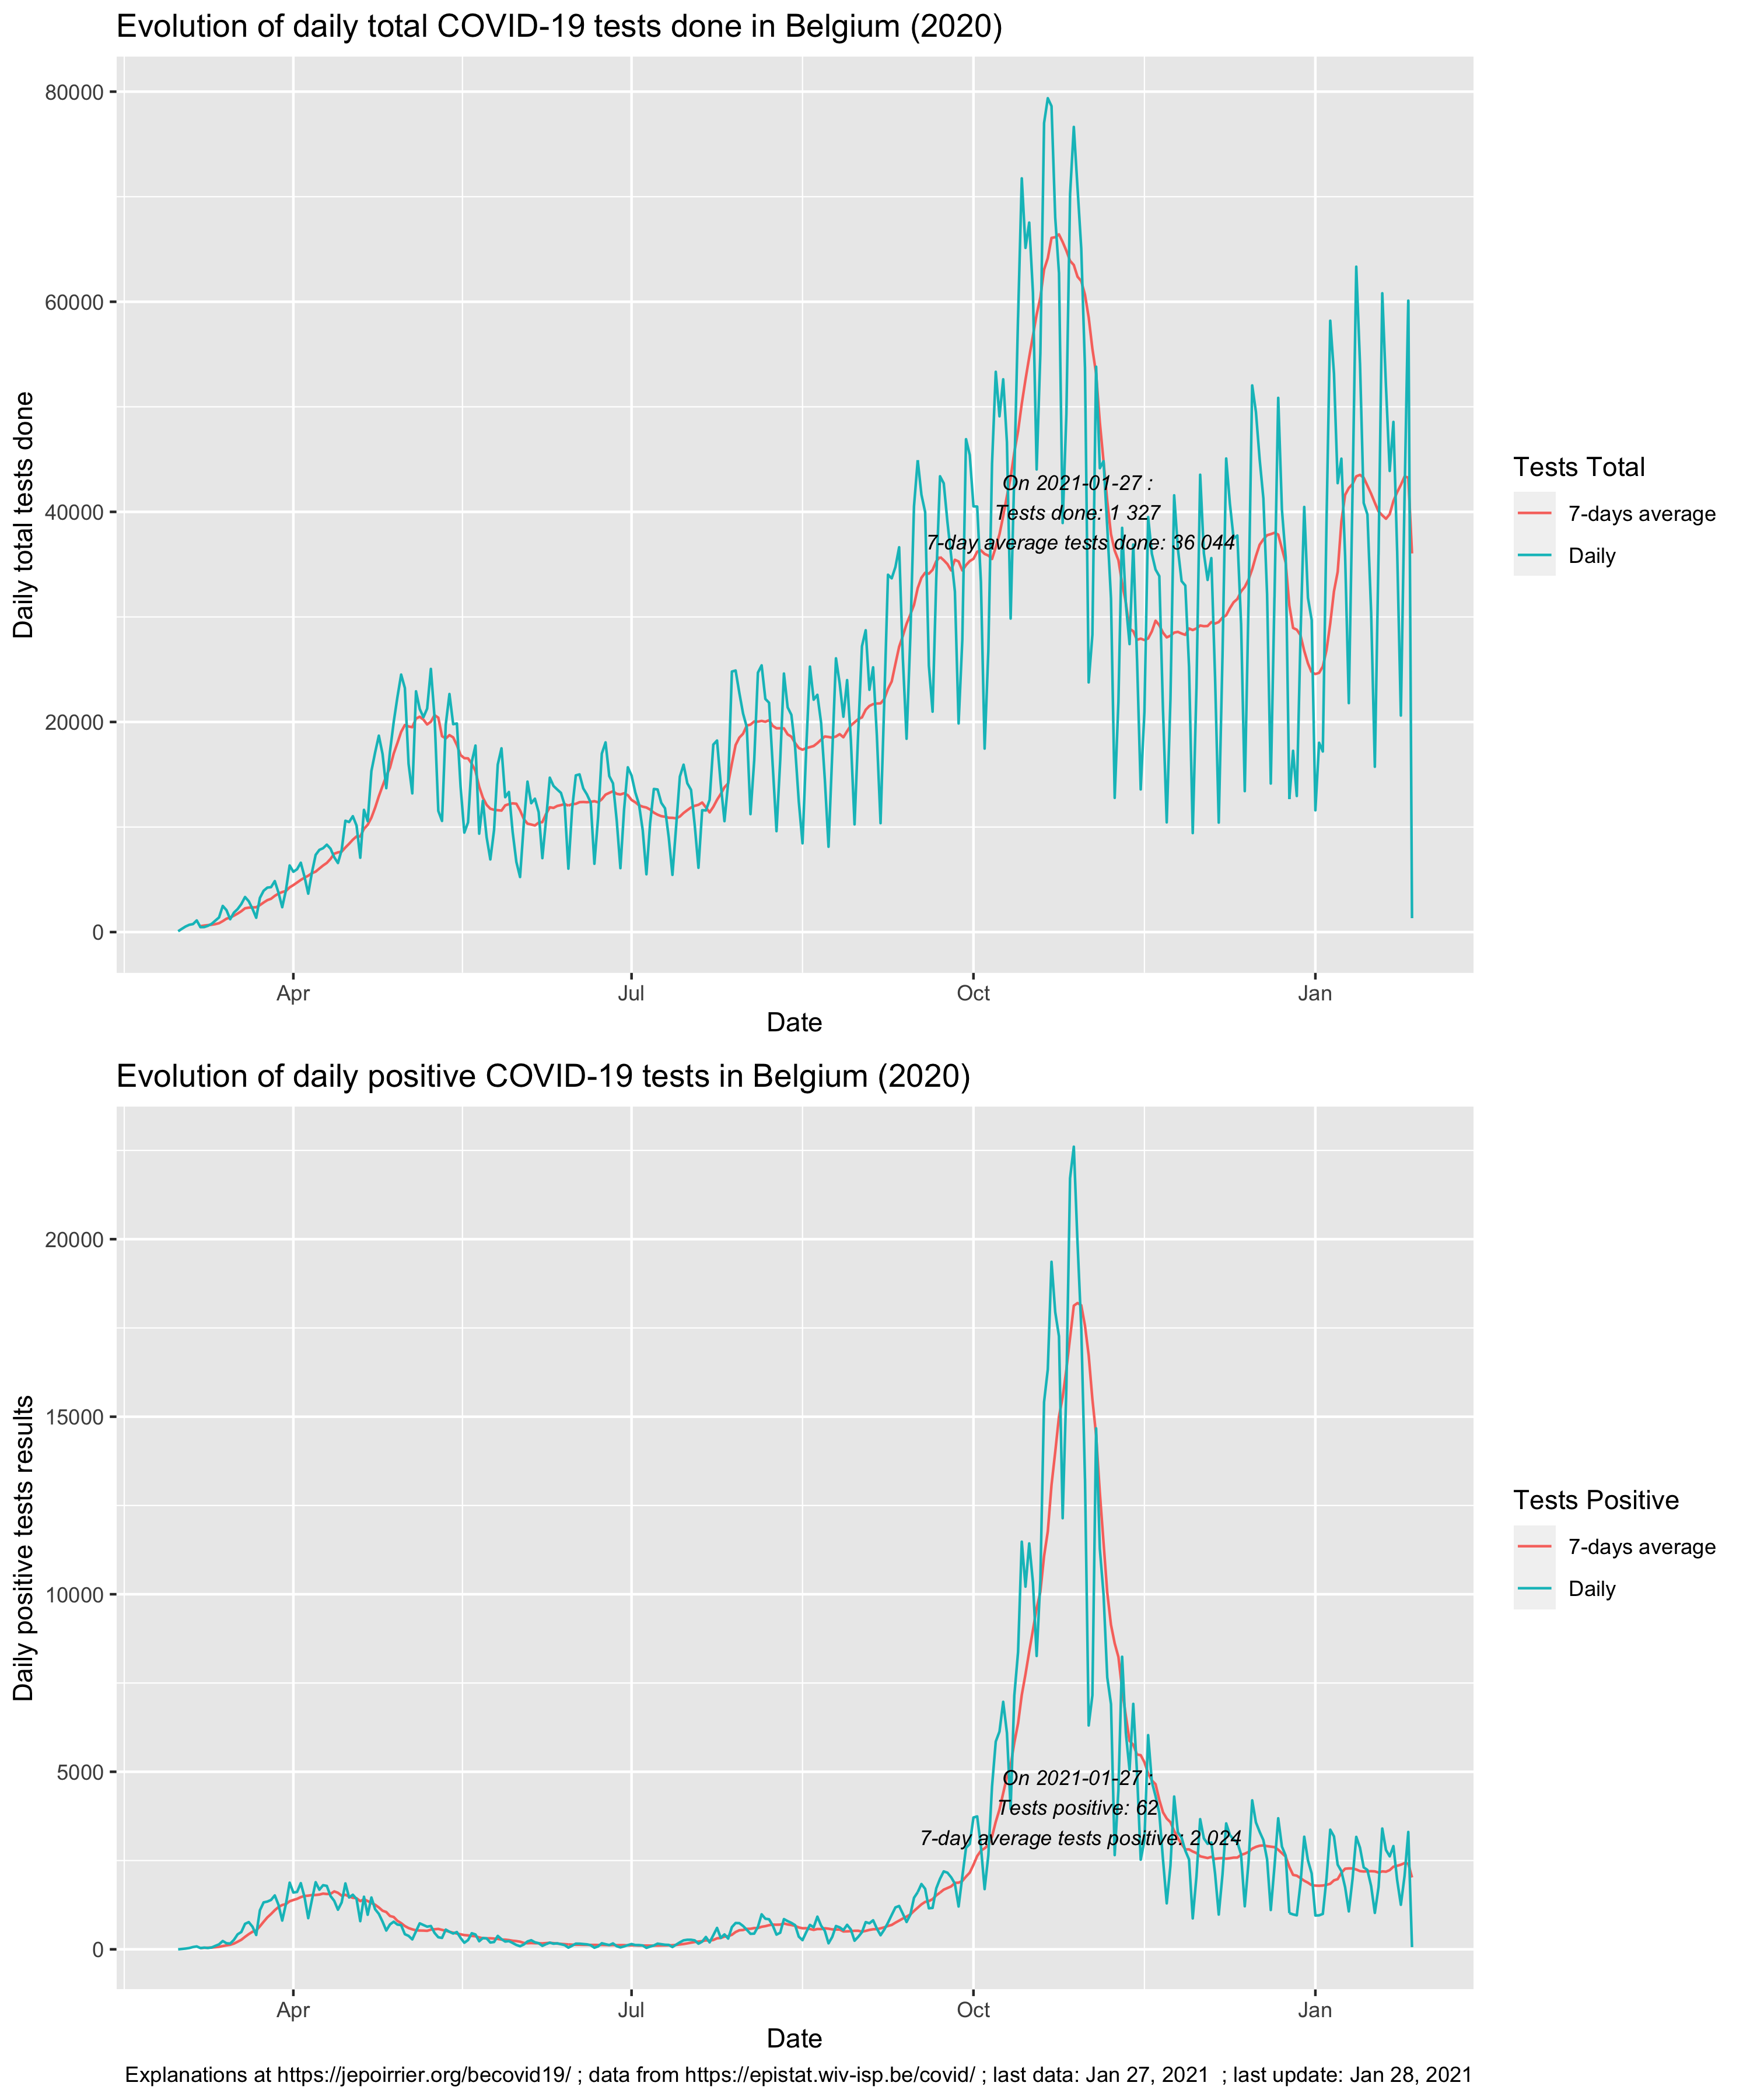
Tests
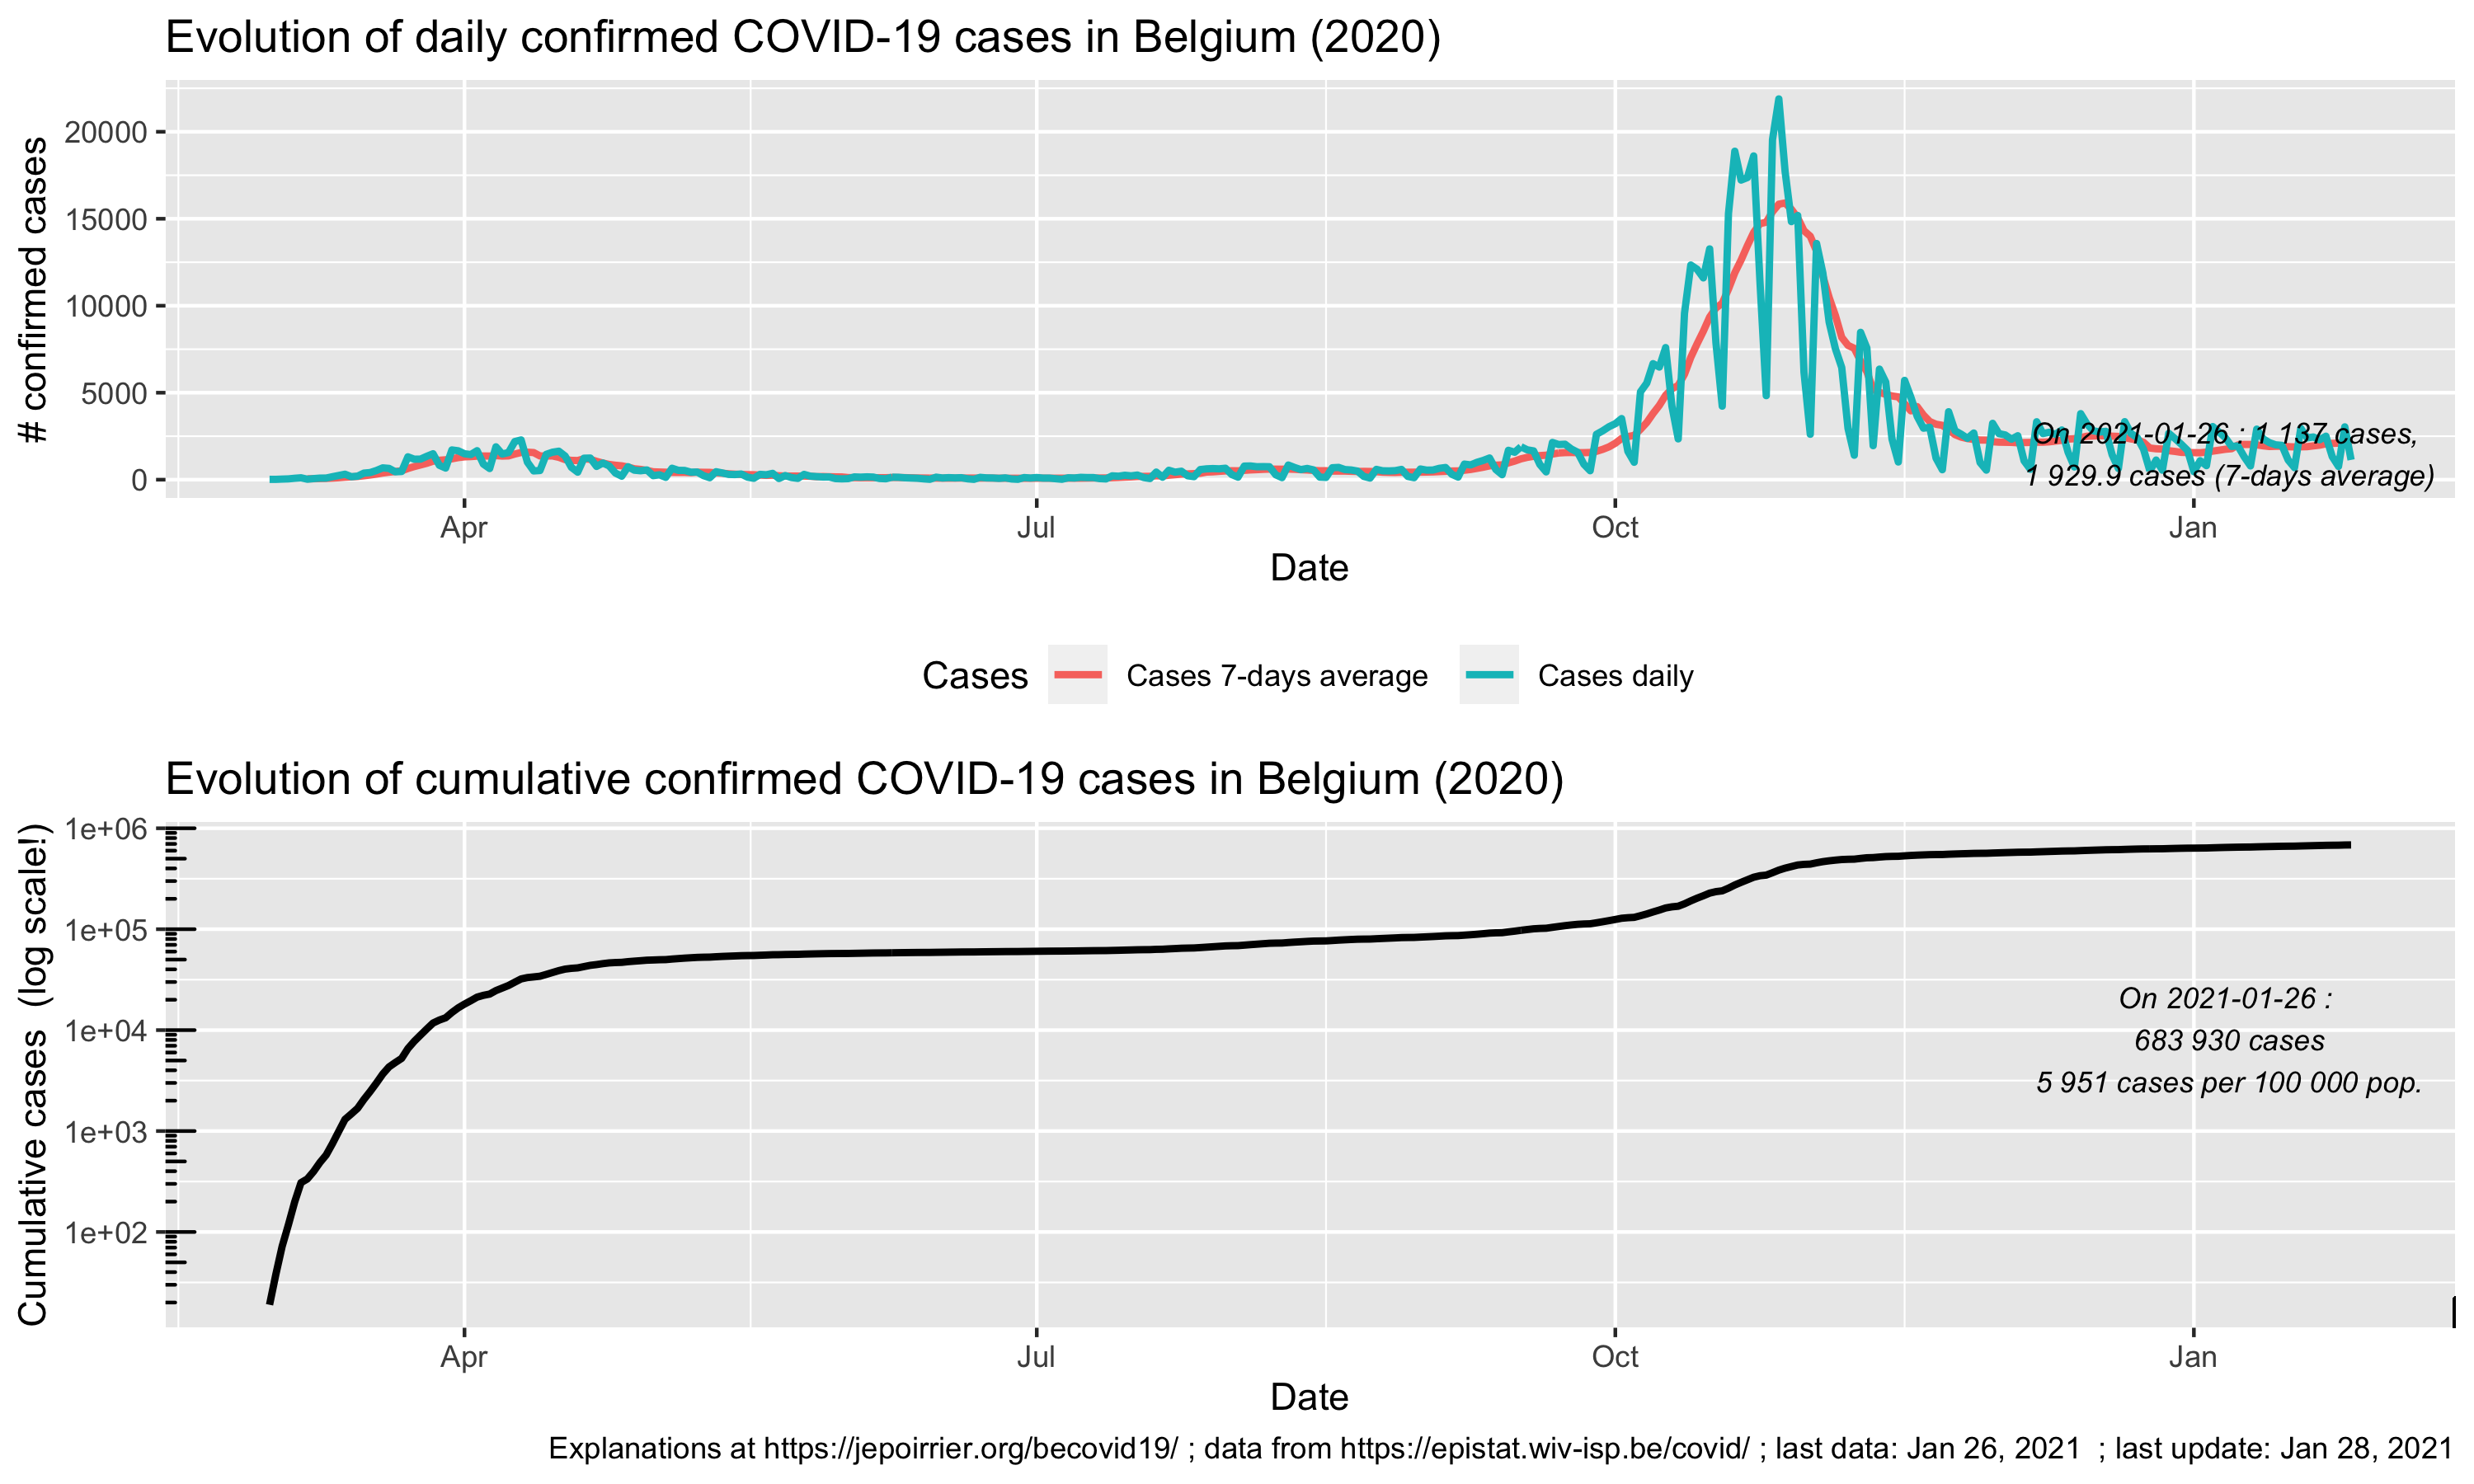
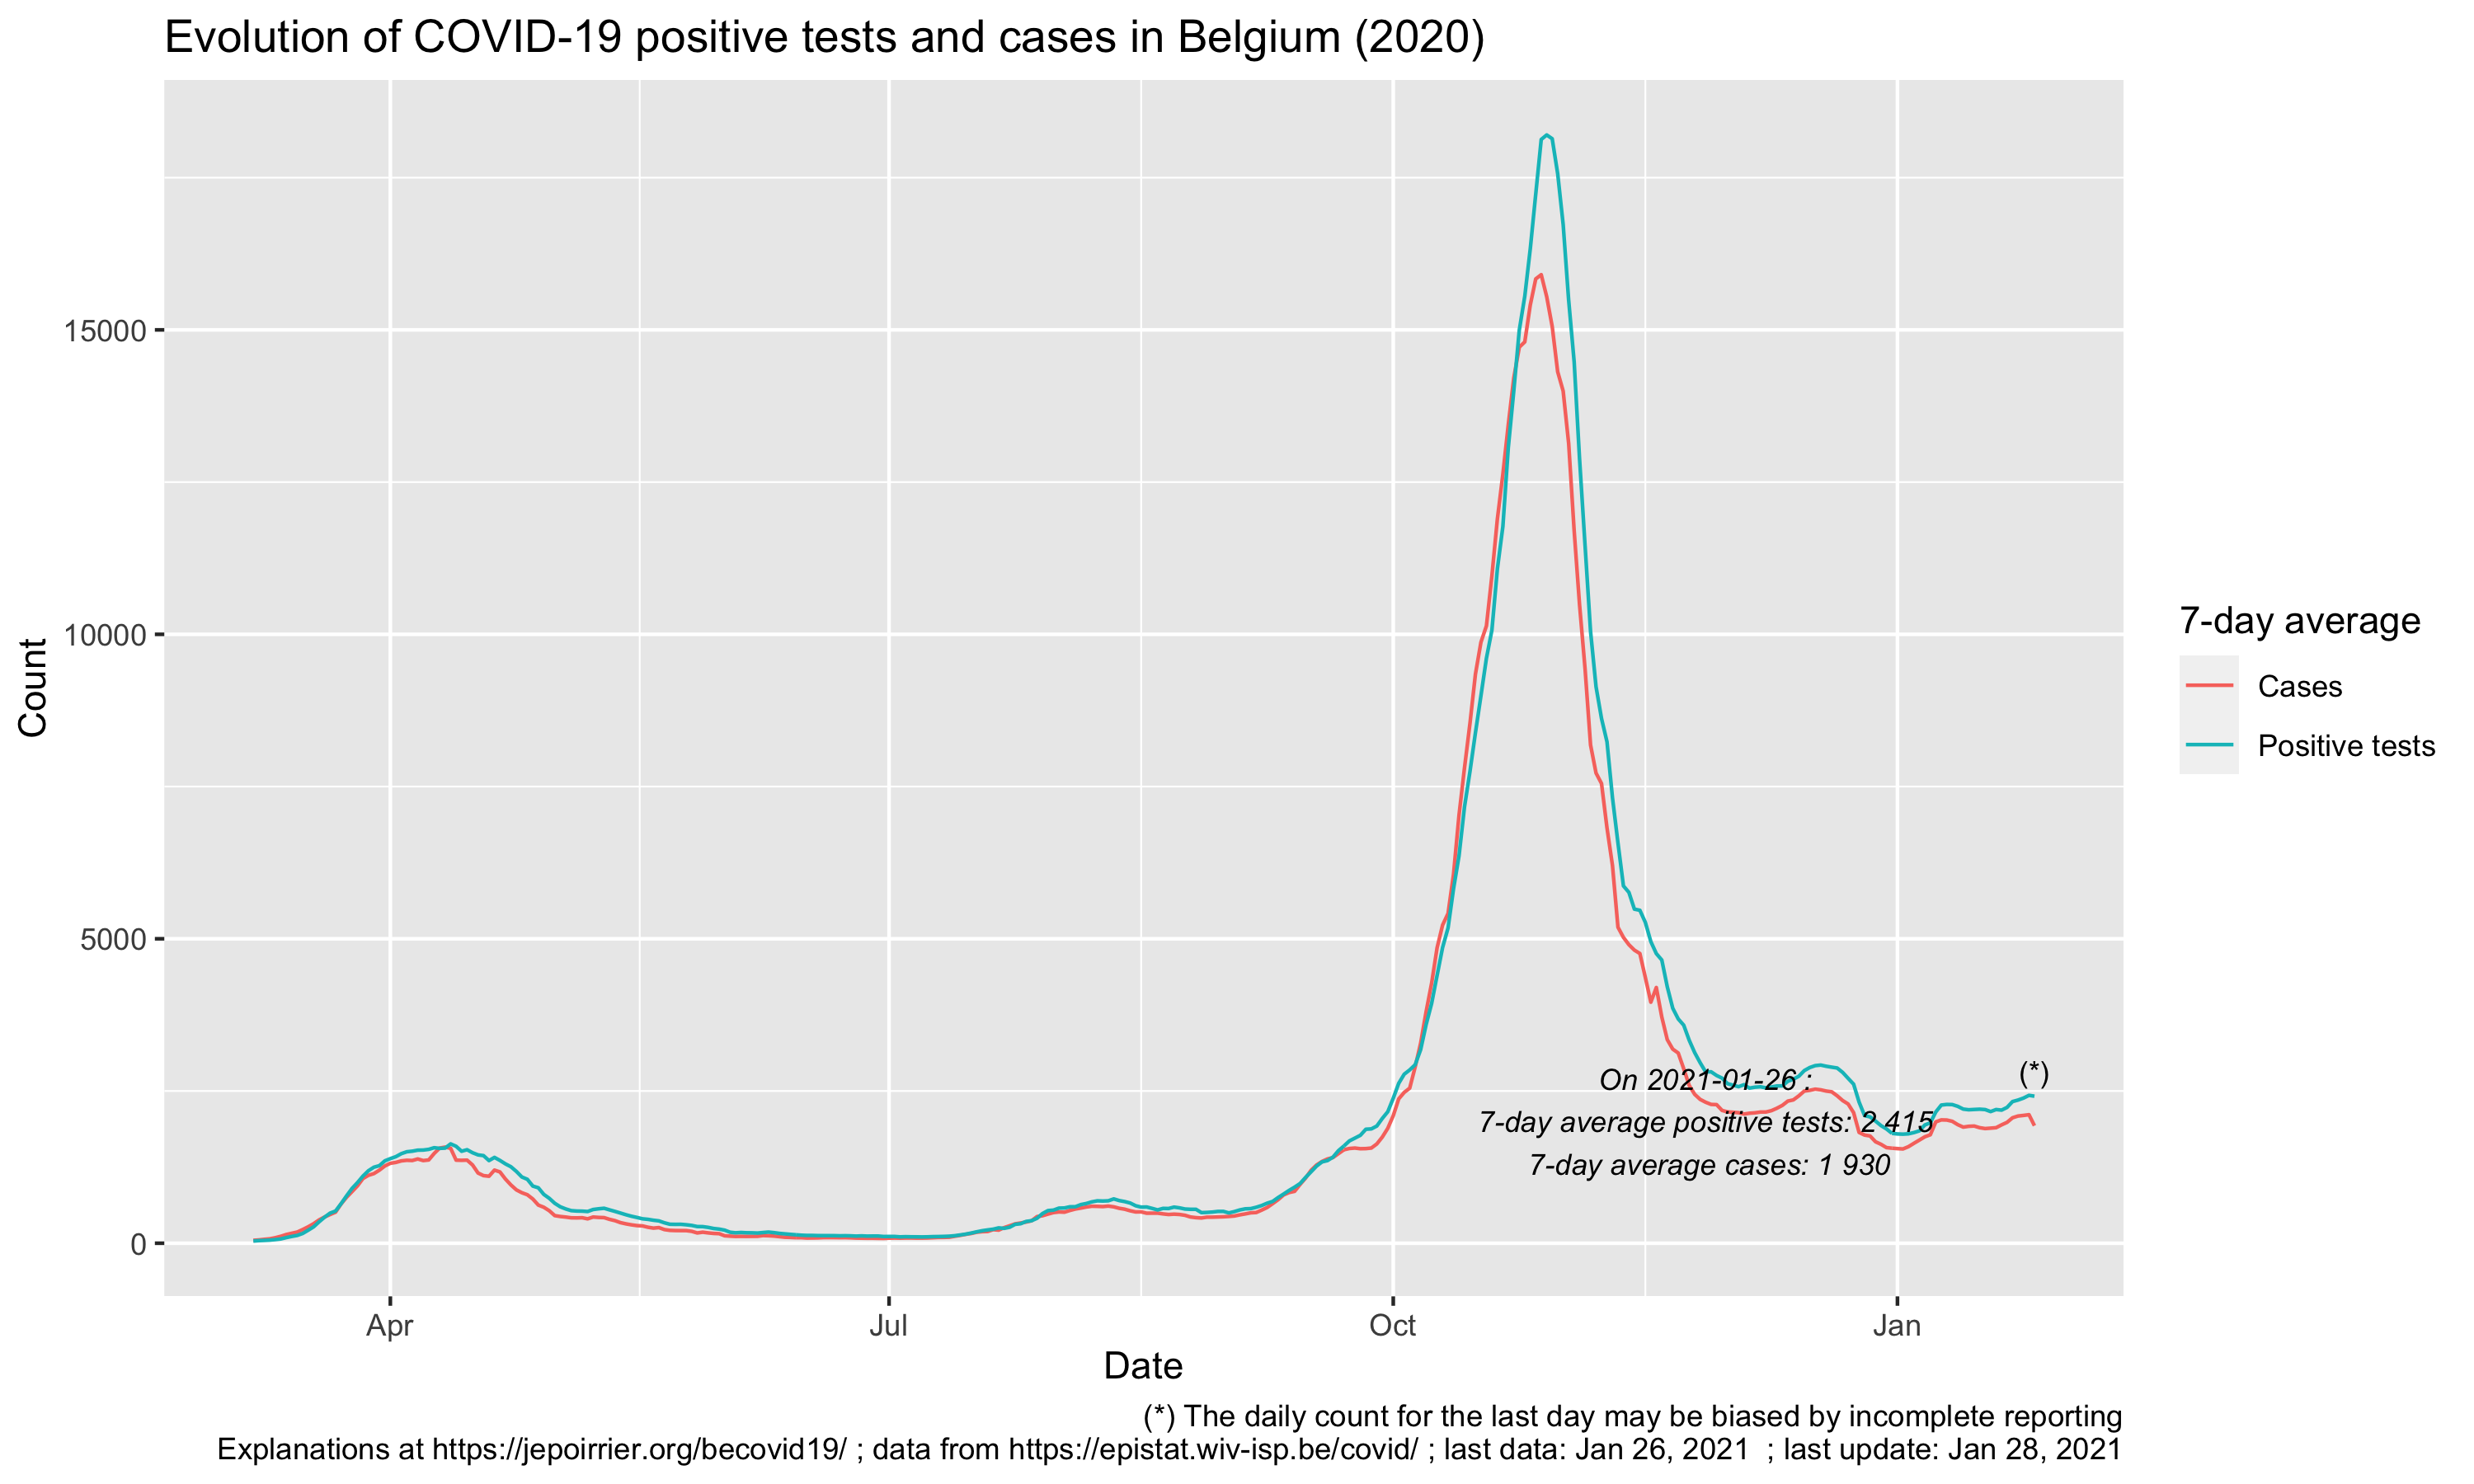
Cases
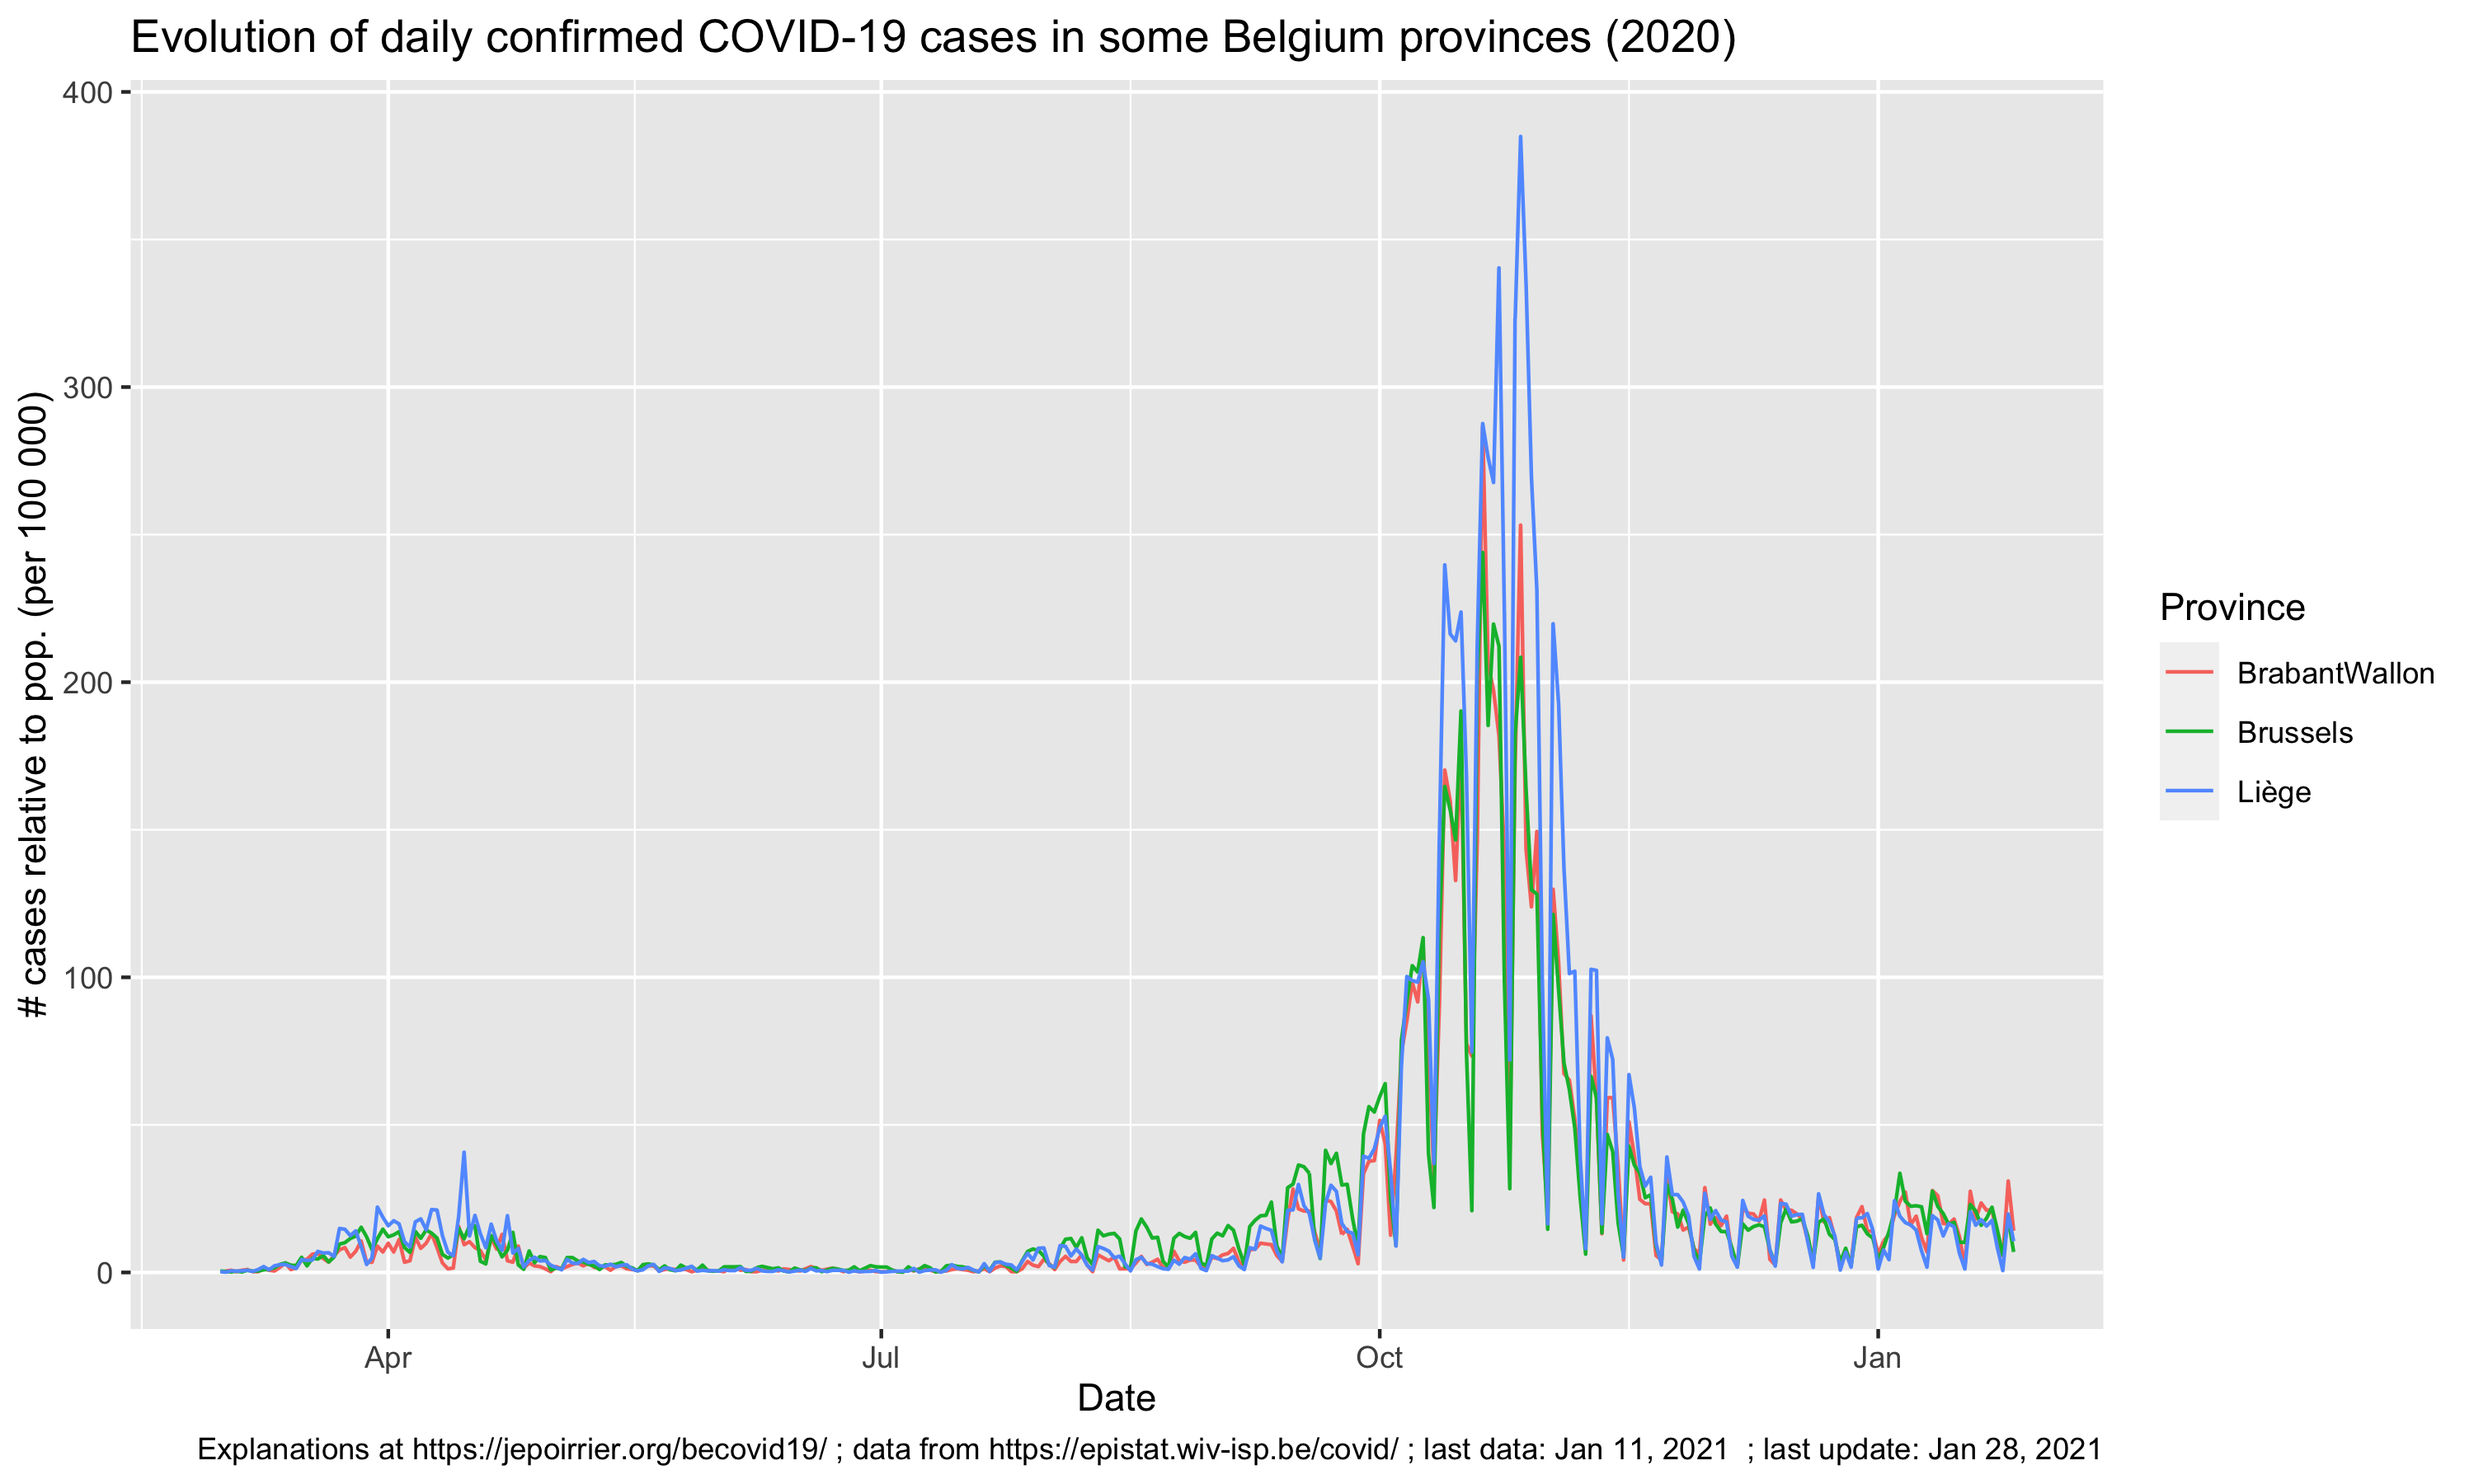
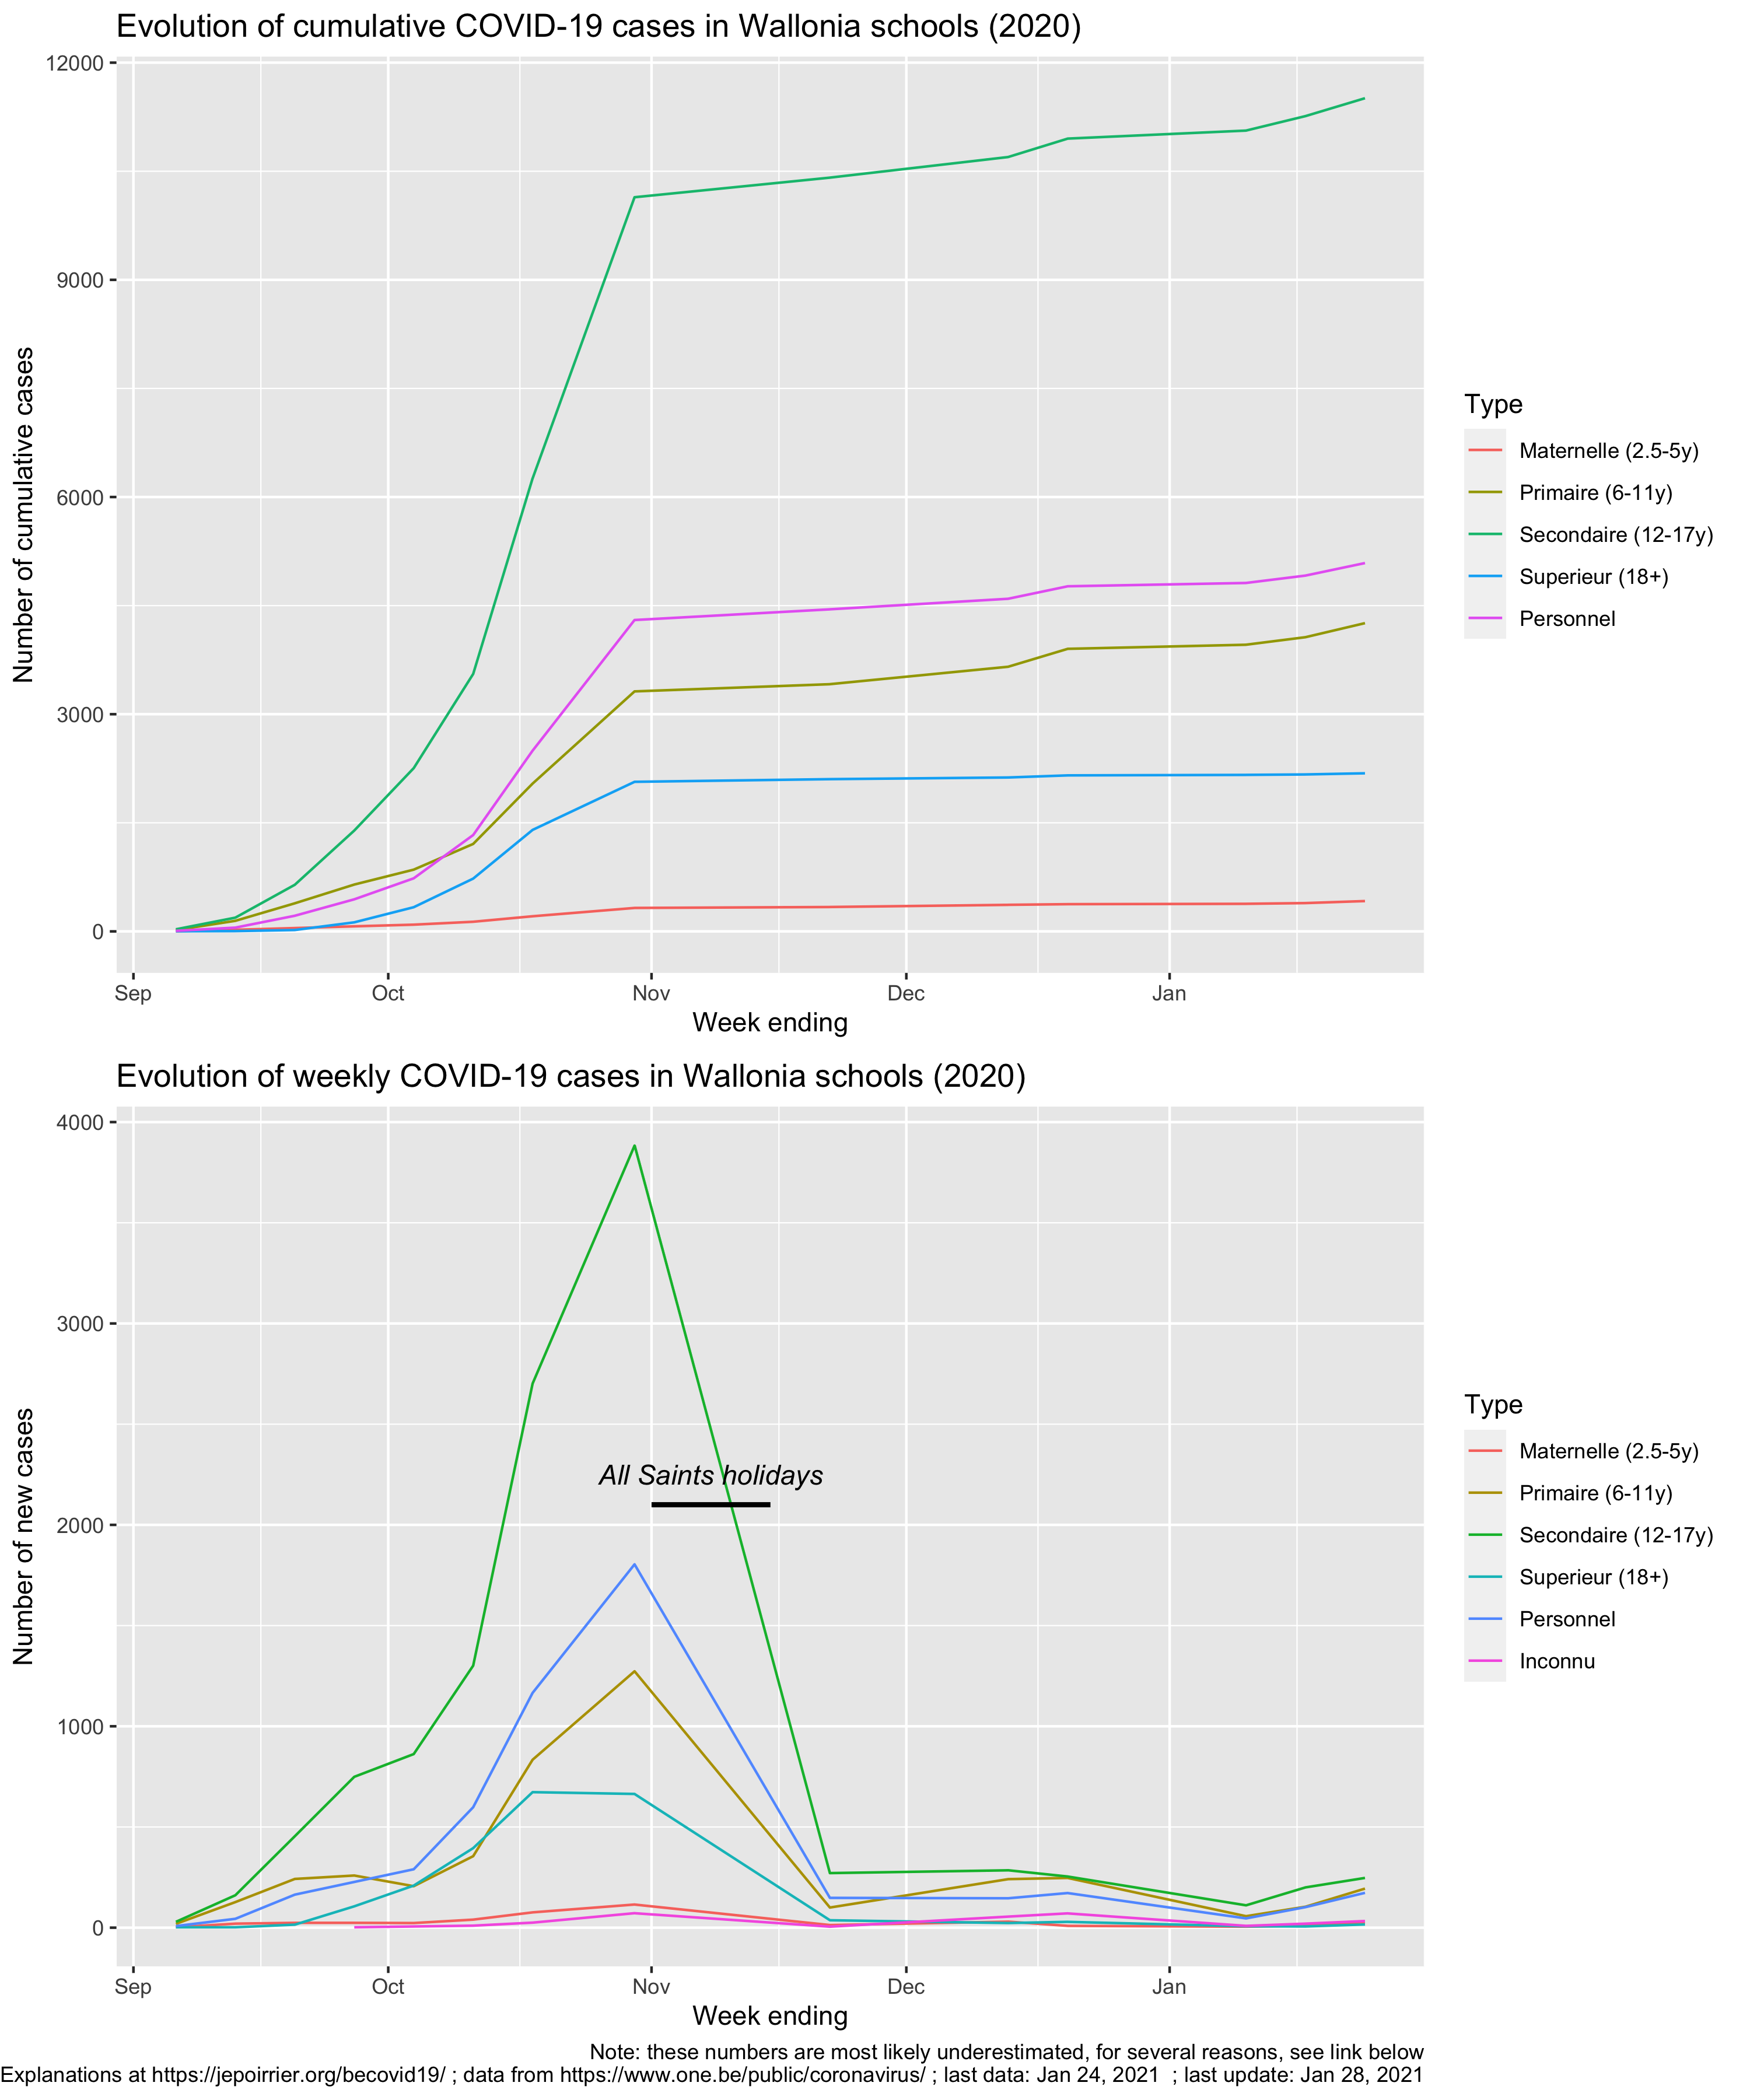
Cases in schools (Wallonia)
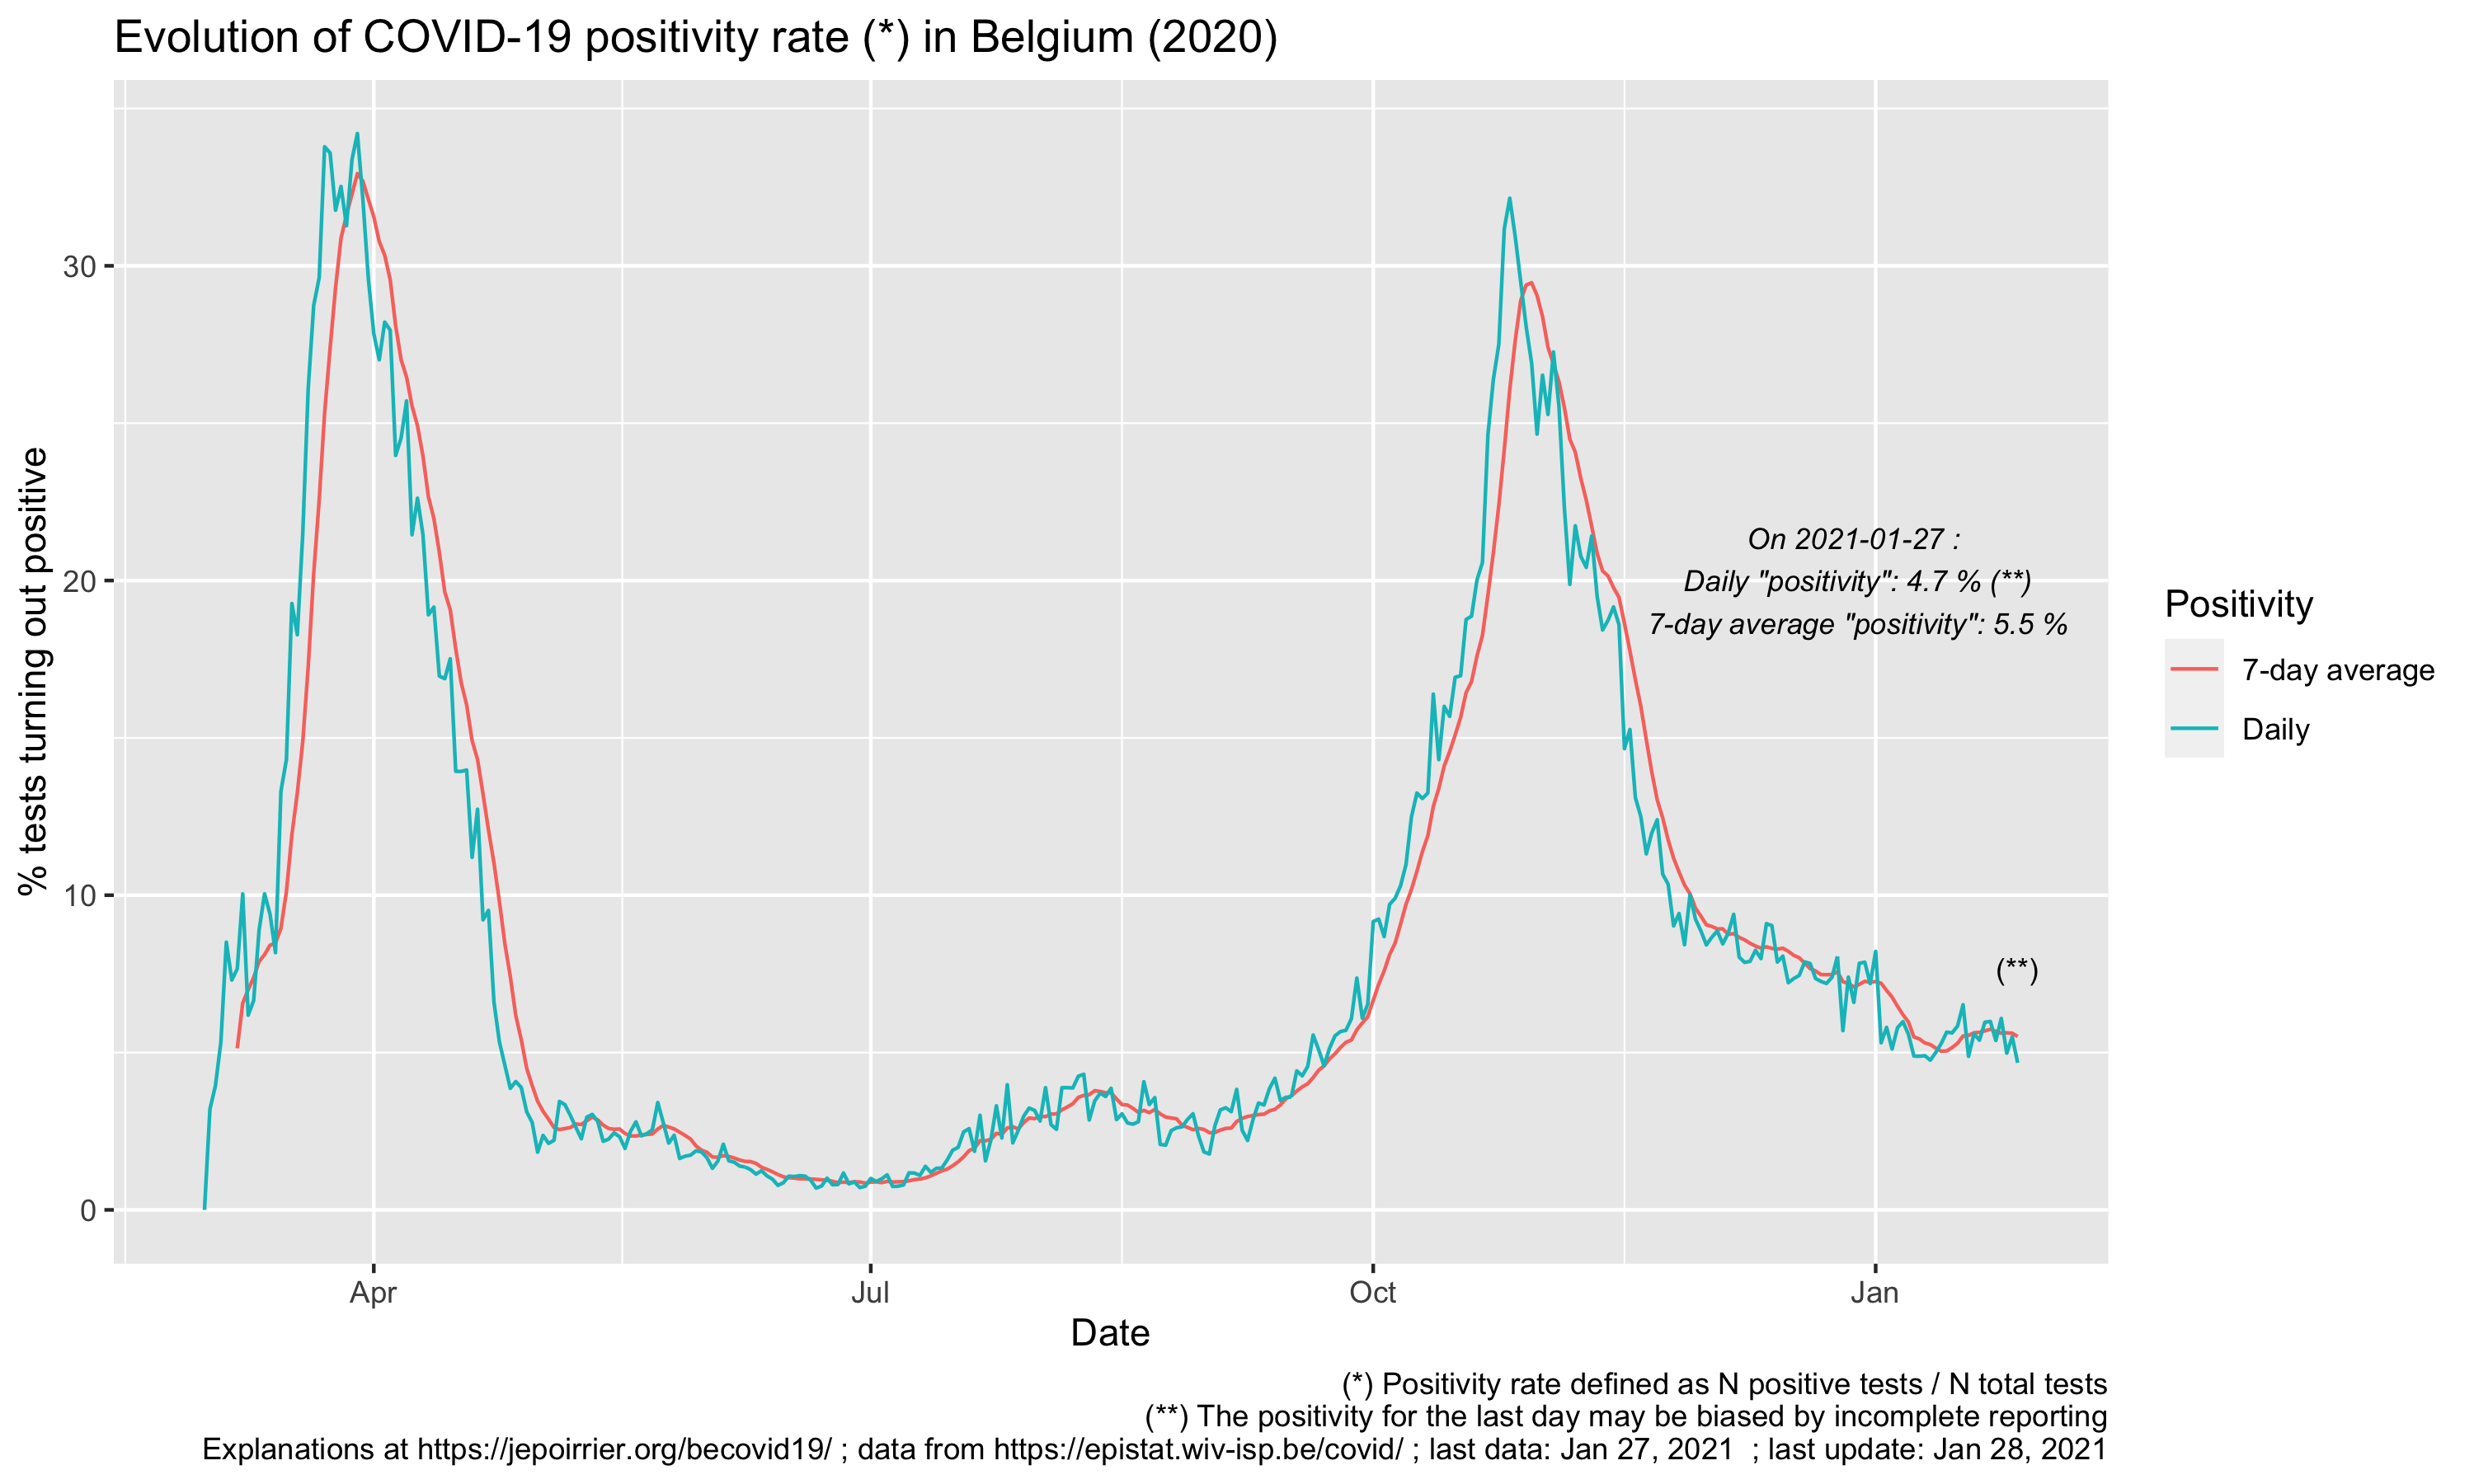
Positivity rate
Clusters
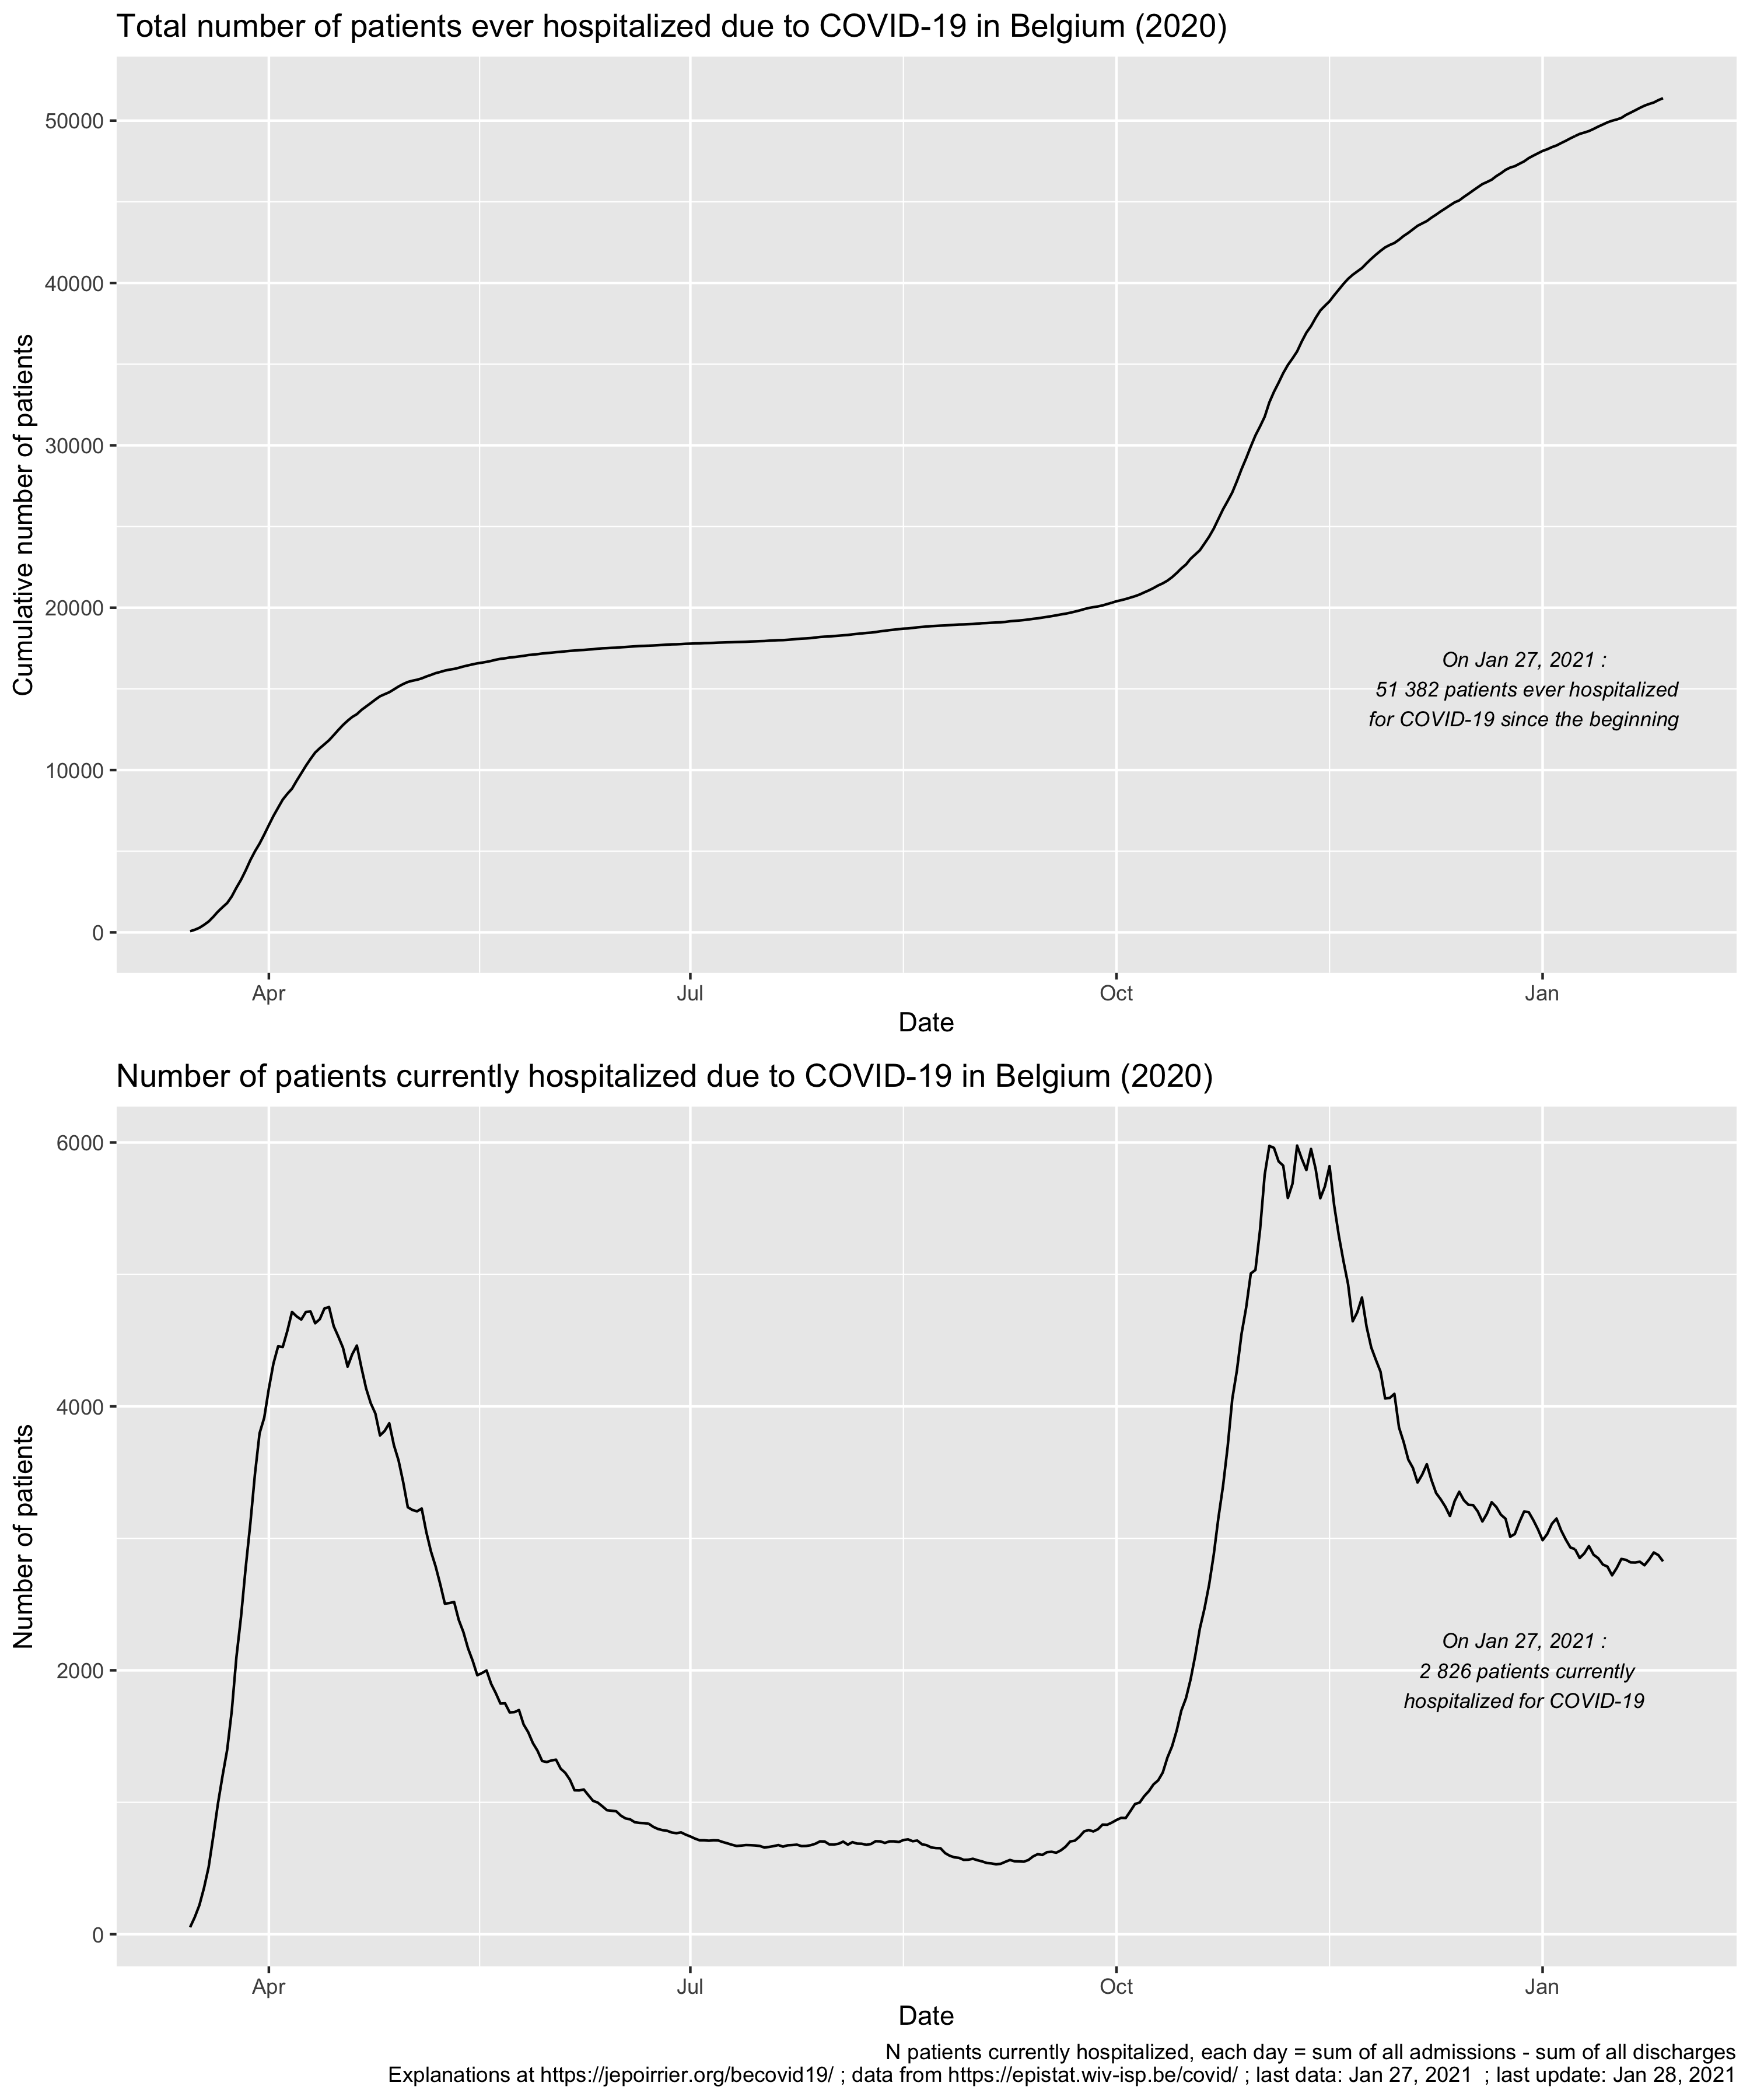
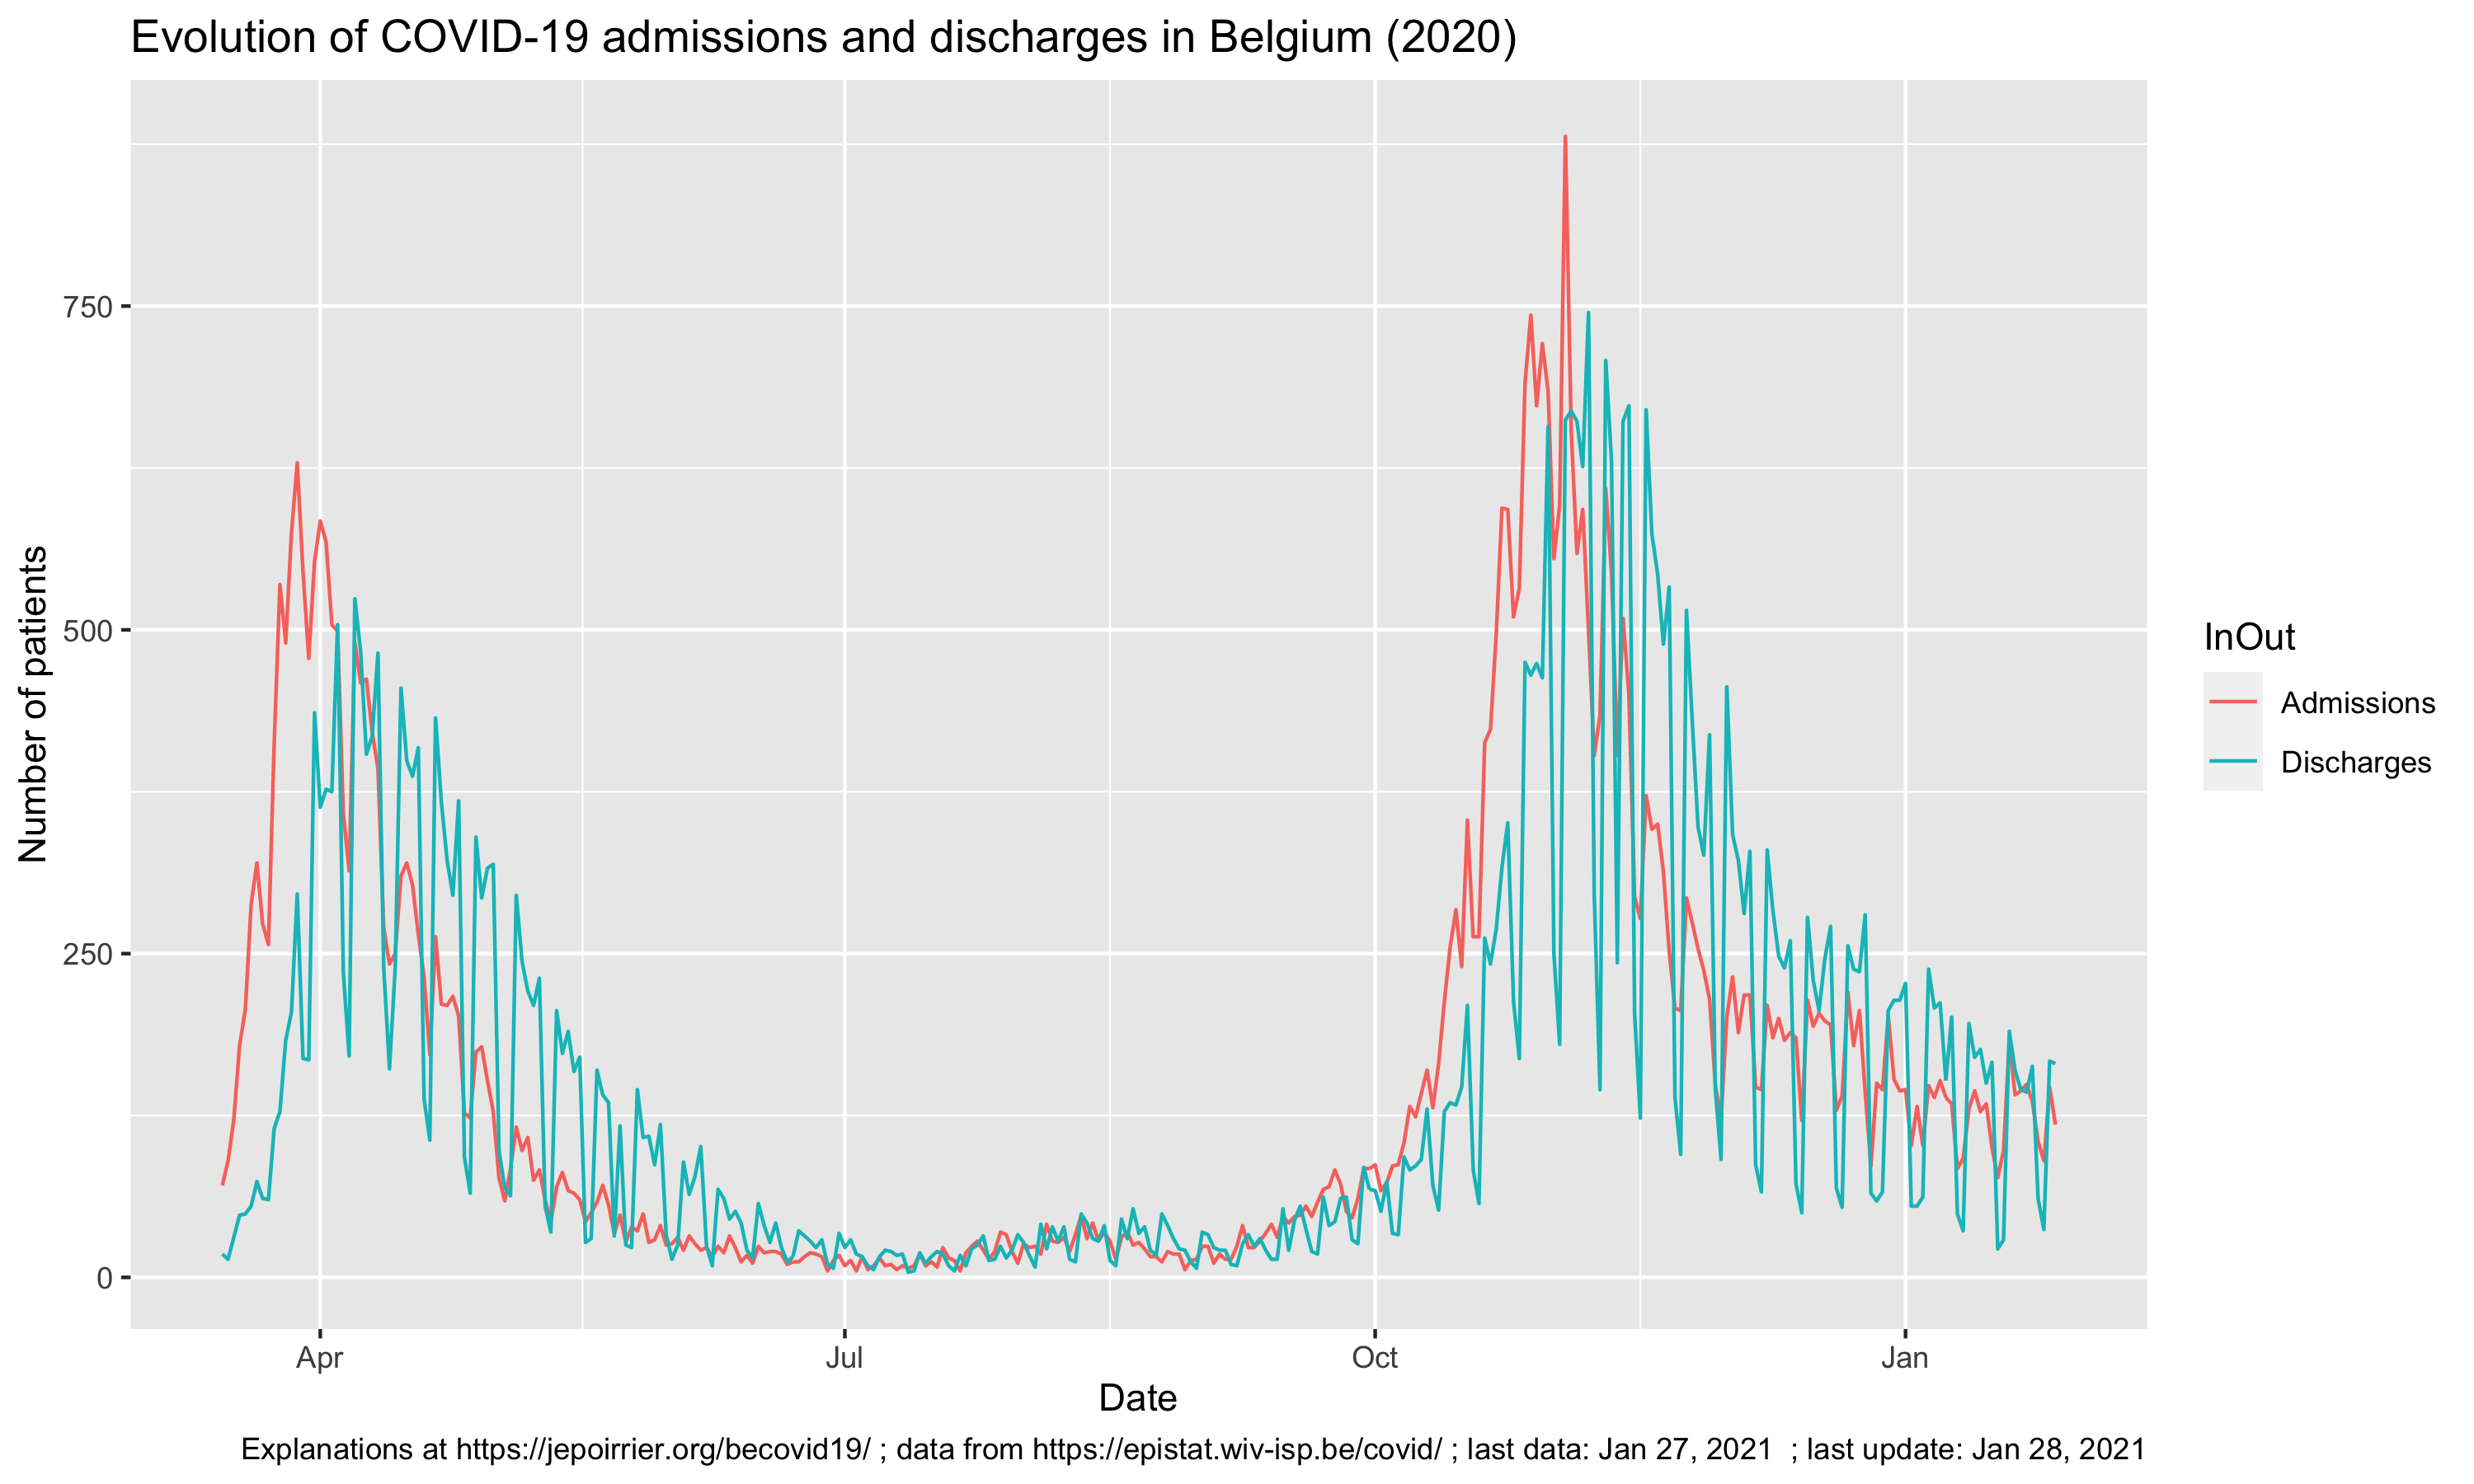
Hospitalizations
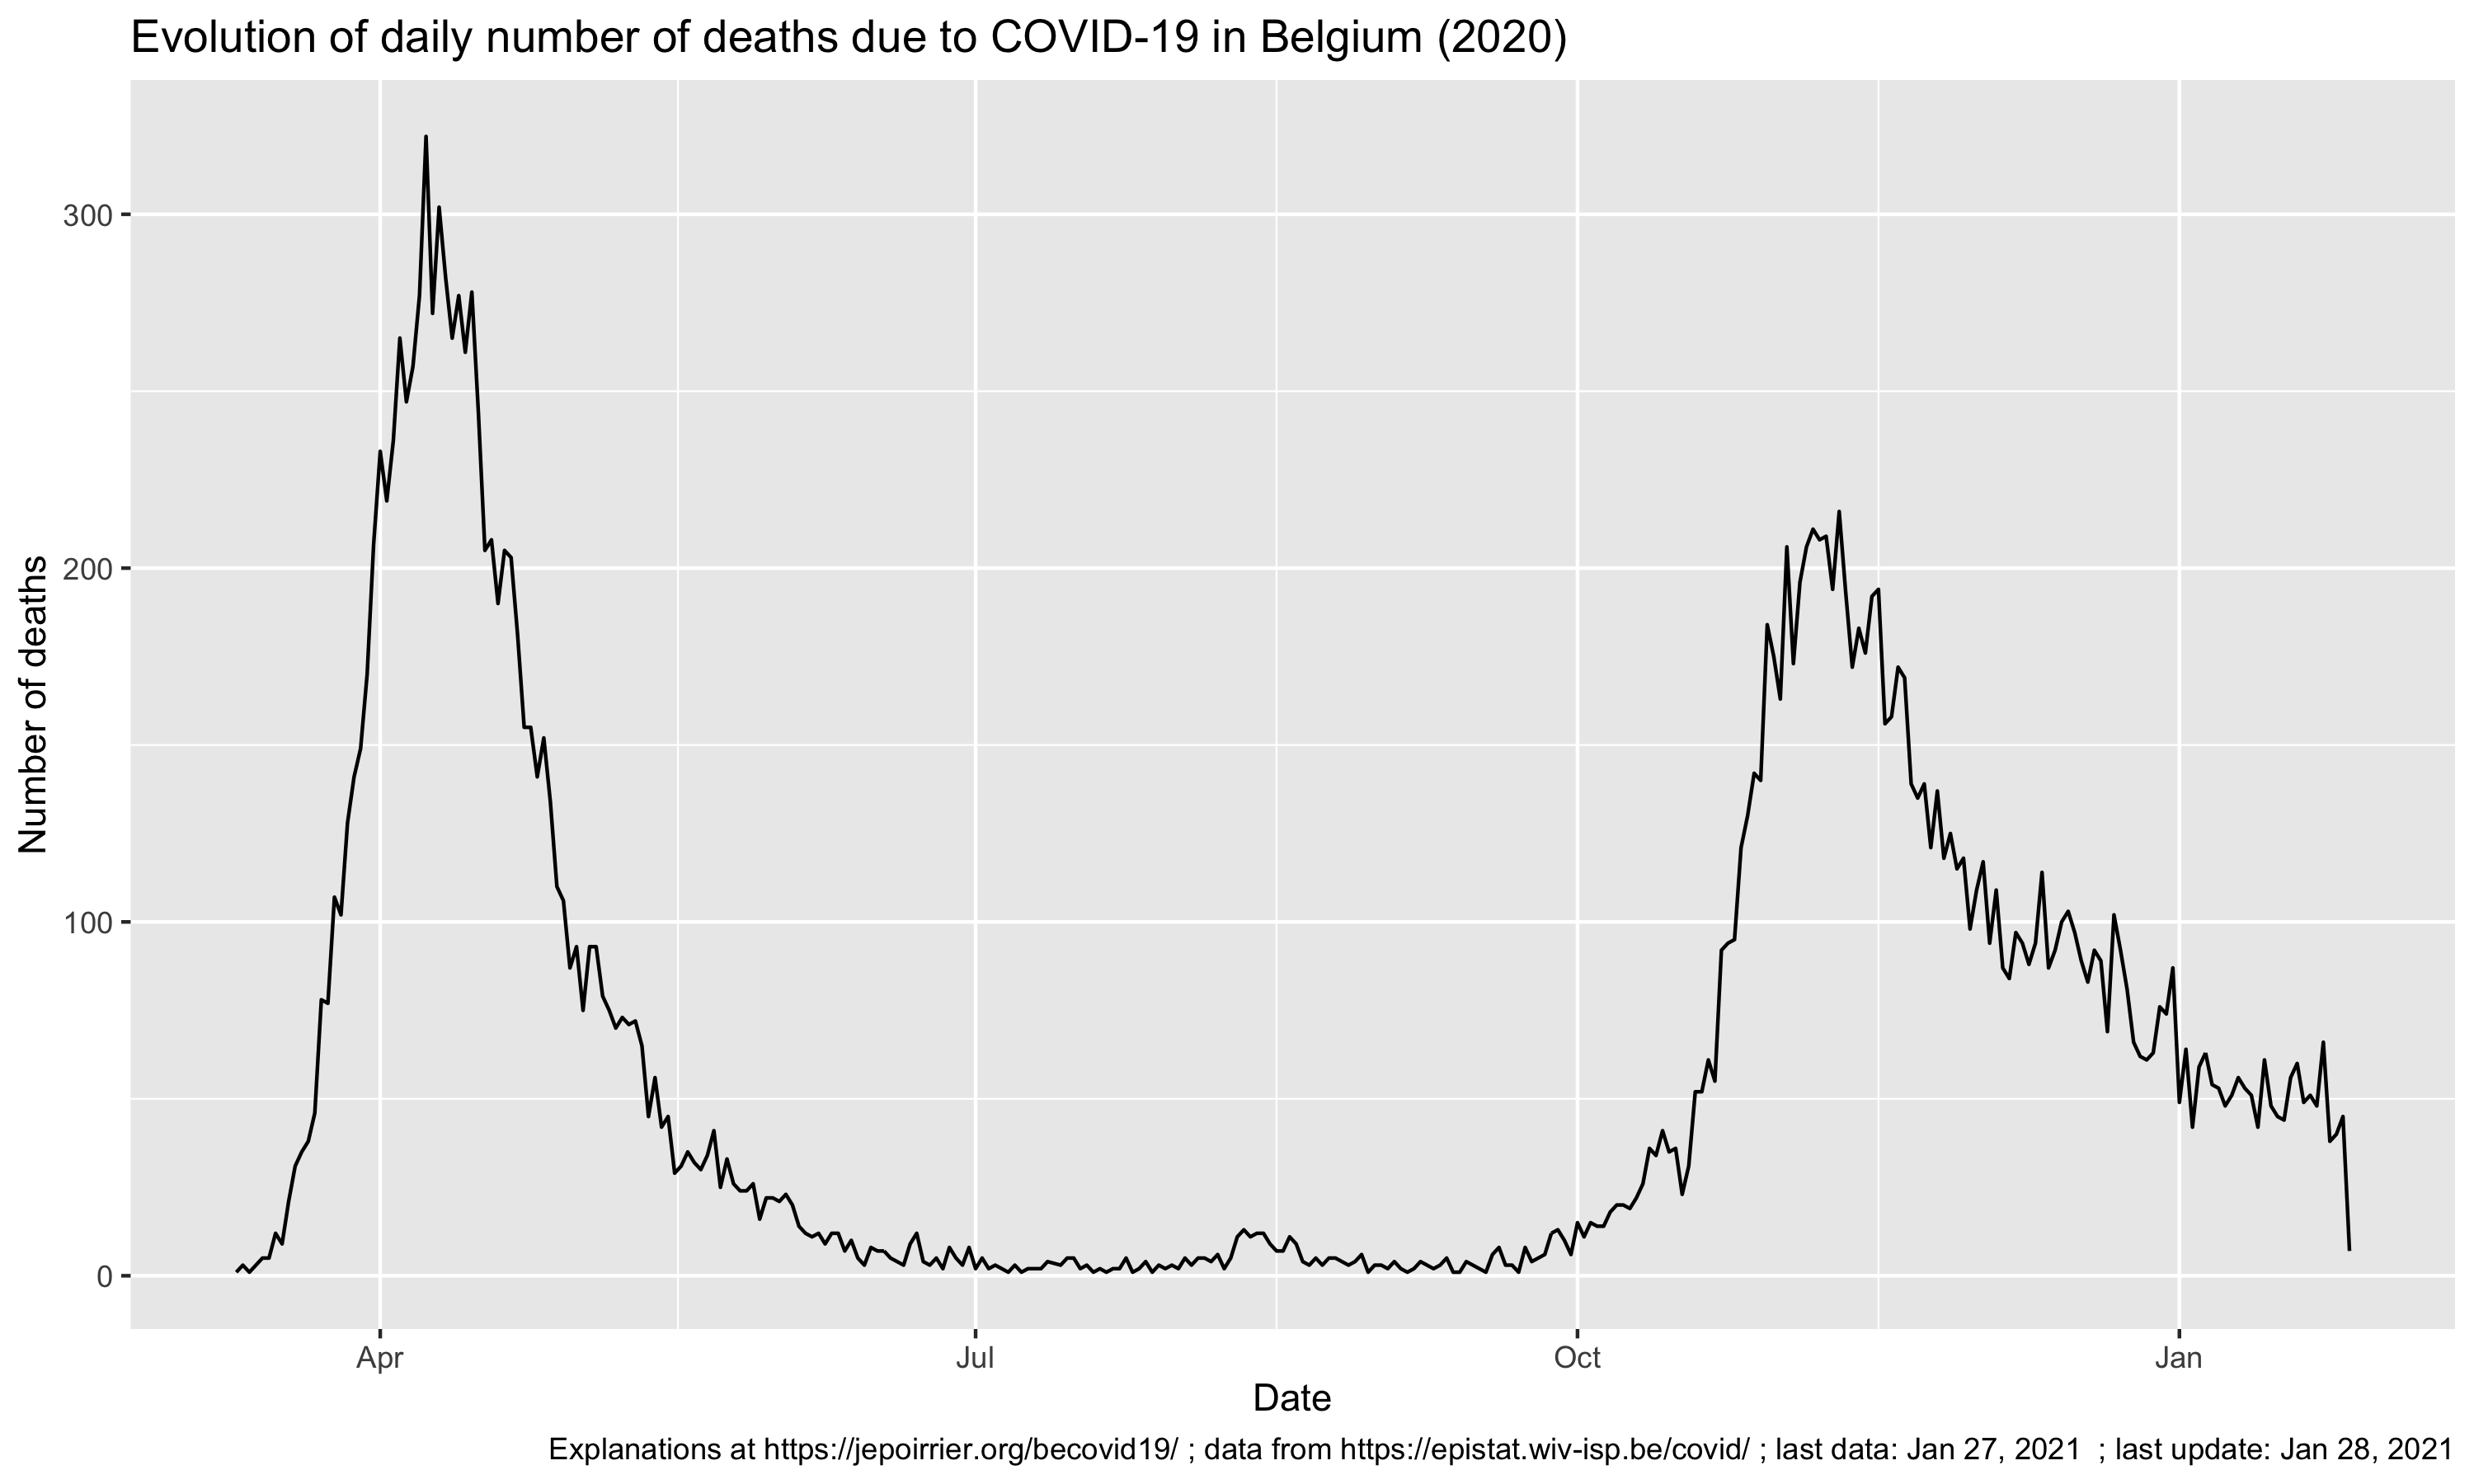
Deaths