This post was last updated on April 26, 2020.
A new post from April 27, 2020 is here.
Following up on my previous post, here are updated trends in Coronavirus cases in Maryland (USA), the state I live in. I am writing a second post because the Maryland Department of Health (MDH) updated its dashboard with way more data than before (more on this below). Before continuing, please note that the same disclaimer as in my previous post applies here (in short: read the CDC and MDH websites for official information).
The new type of data that the MDH released is: the total number of hospitalizations and releases, more granular age categories and the number of cases by sex. And on March 28, we saw the return of the number of negative tests!
Here are the plots that I will try to update daily (check the bottom right of charts to see when it was last updated):


On March 28, MDH reintroduced the total number of negative cases (11,516). Having the total number of cases done is important because it allows to understand better the disease dynamic than just the number of positive cases …
Suppose you have 992 positive cases (like on March 28) but no total number of cases tested. It’s a lot – or maybe it’s not much, who knows? It depends on how many were tested. Up to that day, imagine that only 1,000 people were tested – this becomes a lot of positive cases because 99% of people tested turned out to be positive. Now, MDH said they actually tested 12,508 people – this means that 7.9% of people tested turn out to be positive. Given the few tests available, testing is reserved for people who are believed to be at risk (more or less ; read the MDH testing FAQ here). So less than 10% of people tested (thought to be at risk) turn out to be actually infected. That’s good!
End of March, the MDH also released more granular data on the age categories of the people tested positive. Age groups 30-39 and 40-49 have the most cases. Therefore, mostly adults are impacted, probably among people working (who are not or can’t do social distancing). Given hospitalization and death rates are lower in these age groups than in older adults (most hospitalizations, ICU admissions and deaths are occurred among adults aged ≥65 years with the highest percentage of severe outcomes among persons aged ≥85 years, according to the March 26 CDC paper), we’ll hopefully see less dreadful cases in adults than in older adults.
On March 30, the MD governor decided that everyone should stay at home, except for food and medicine shopping. The recent days see an increase in cases but especially an increase of deaths, due to an outbreak in a nursing home.
We entered April and the number of cases continued to increases. On April 3rd, the MDH page on coronavirus got enriched with a very nice dashboard with a lot of data:

On April 5, we could see that all numbers are continuing to climb. Frederick County and Baltimore County are shooting up (with Frederick County now being the first county in number of cases). I’ve added a chart with the daily number of cases and it’s hard to grasp that nearly 500 people received a positive COVID-19 test result today (in 1 day) (that’s about an entire elementary school, except the age category doesn’t match)! And we are not even in a state where the number of cases explode … We also see that all adults [30-59] have most of the cases, less for older adults and even less for children and teenagers.
On April 7, Maryland continues to see an increase in all cases, hospitalizations, in all counties and all age groups. Since yesterday, we have more than 1,000 hospitalizations. We went about 100 deaths today. And, for the first time, Prince George’s County has more than 1,000 positive cases of COVID-19 (+104 from yesterday).
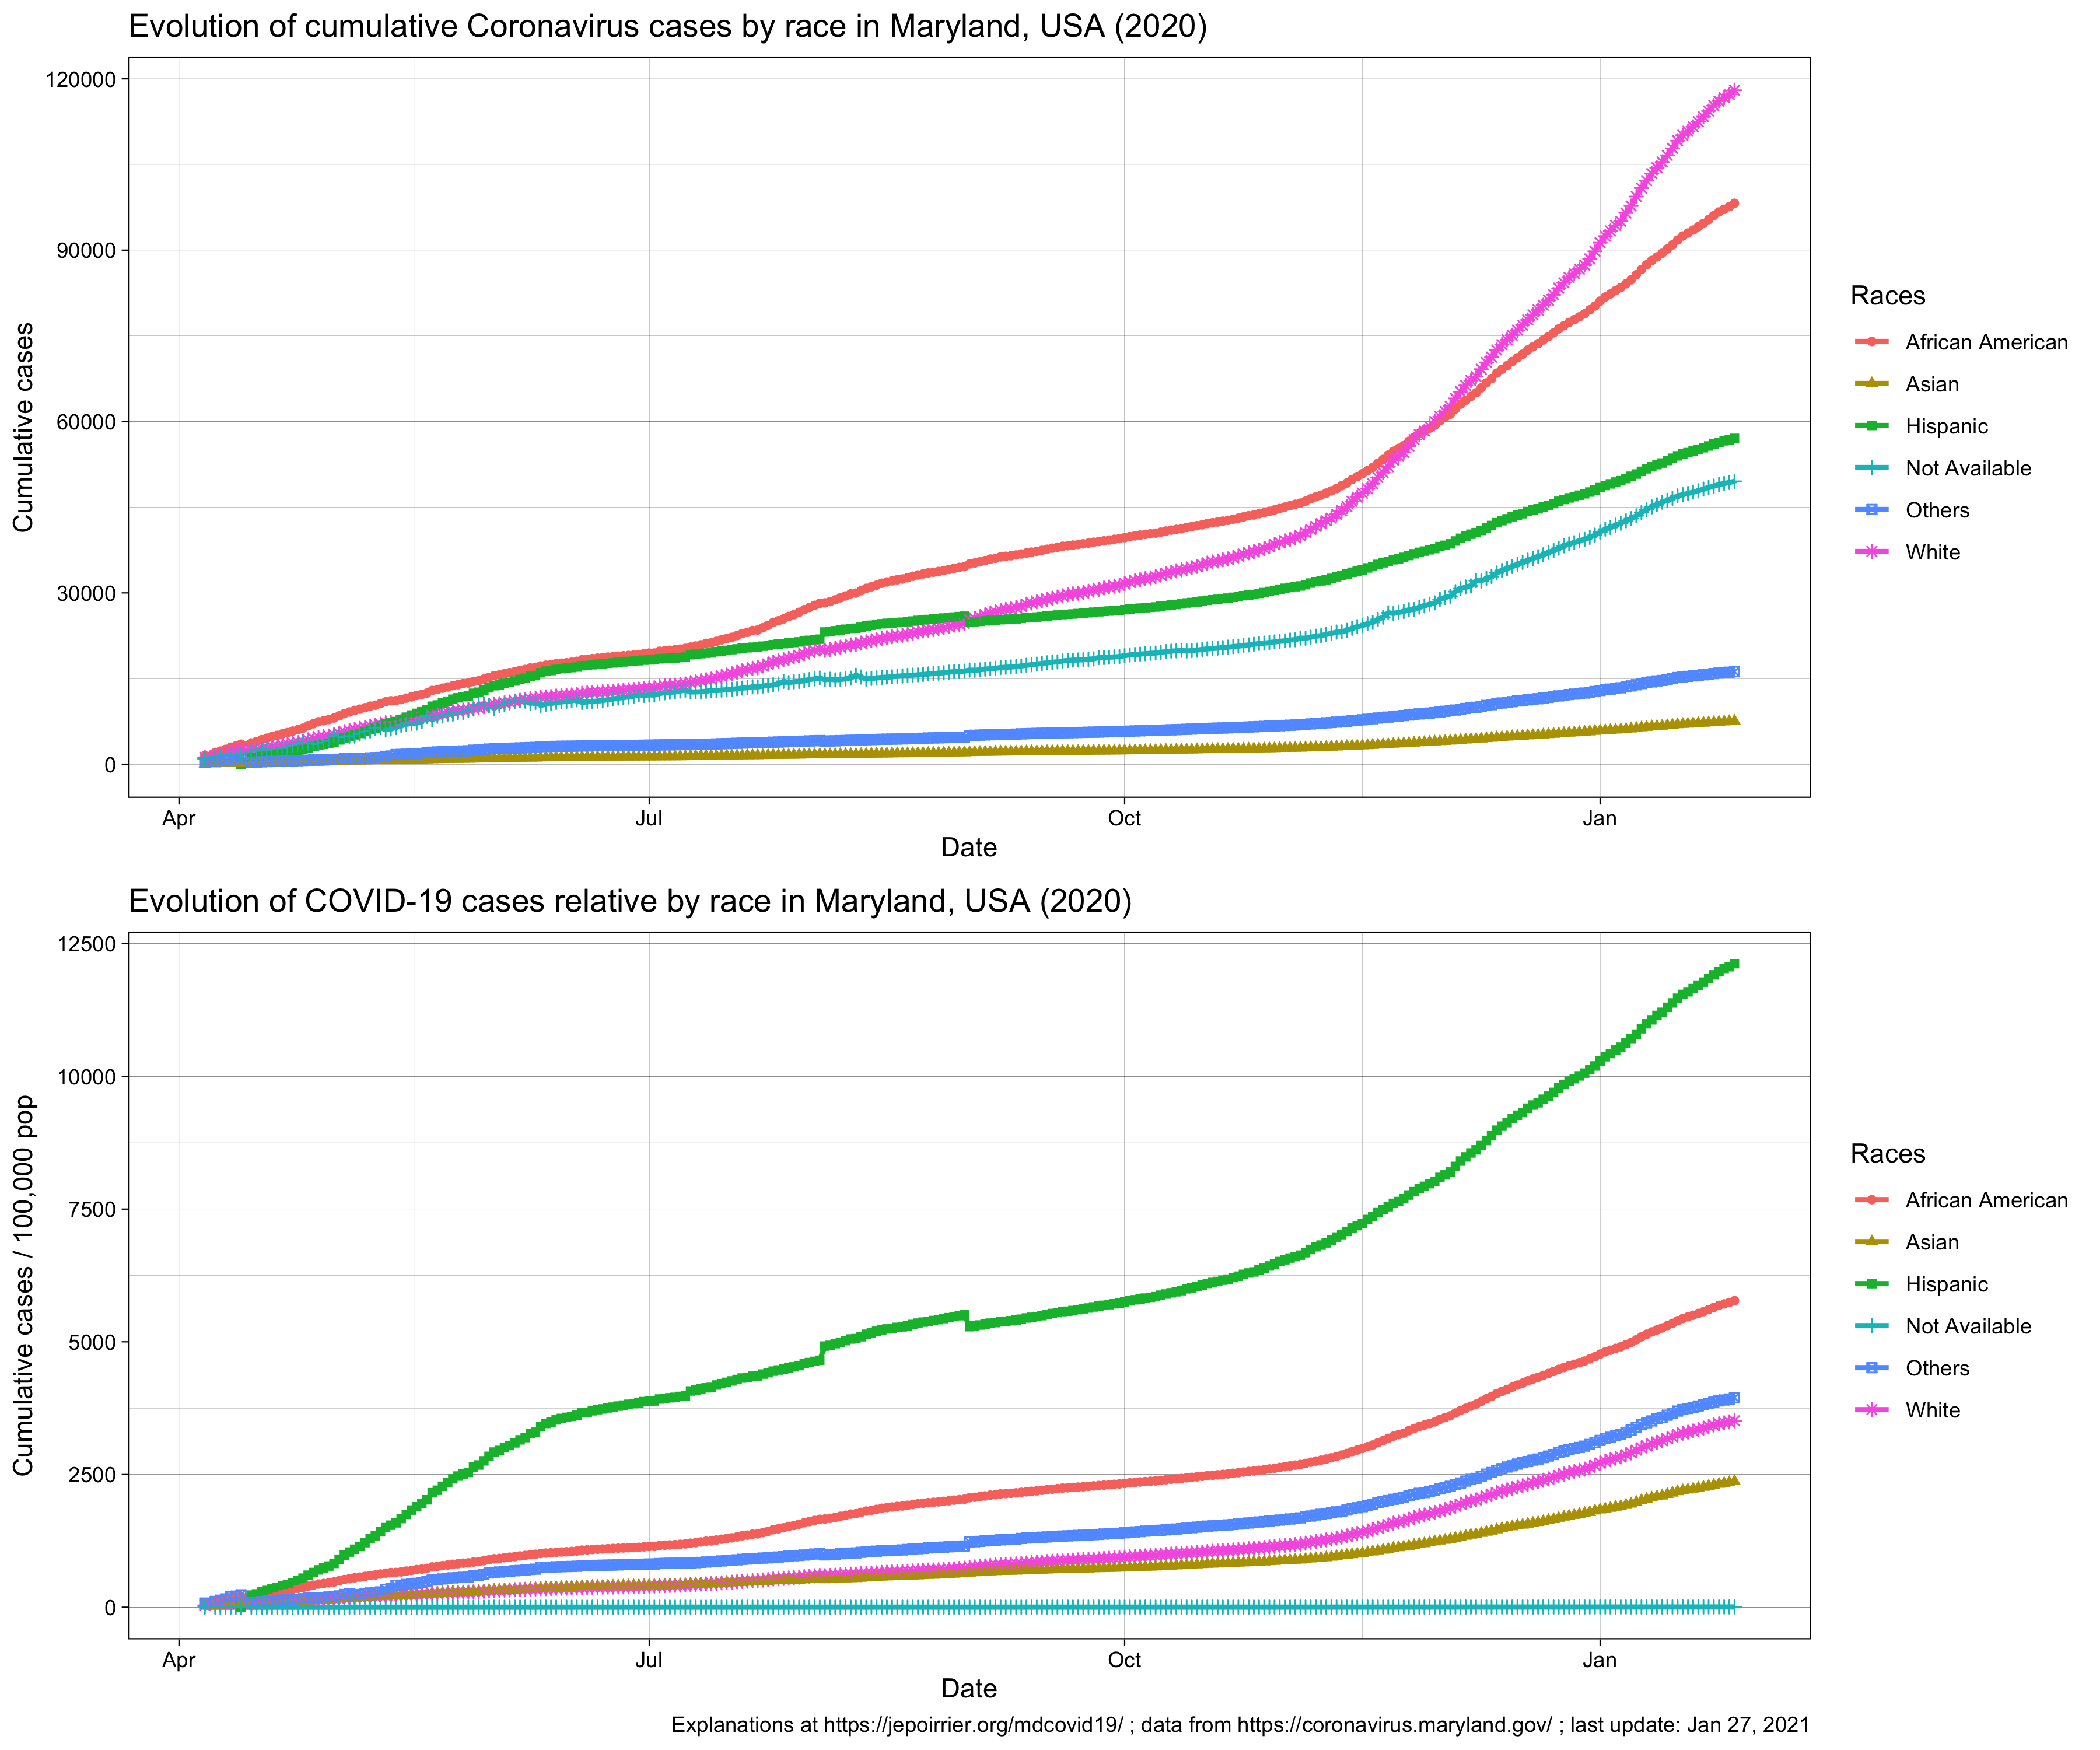
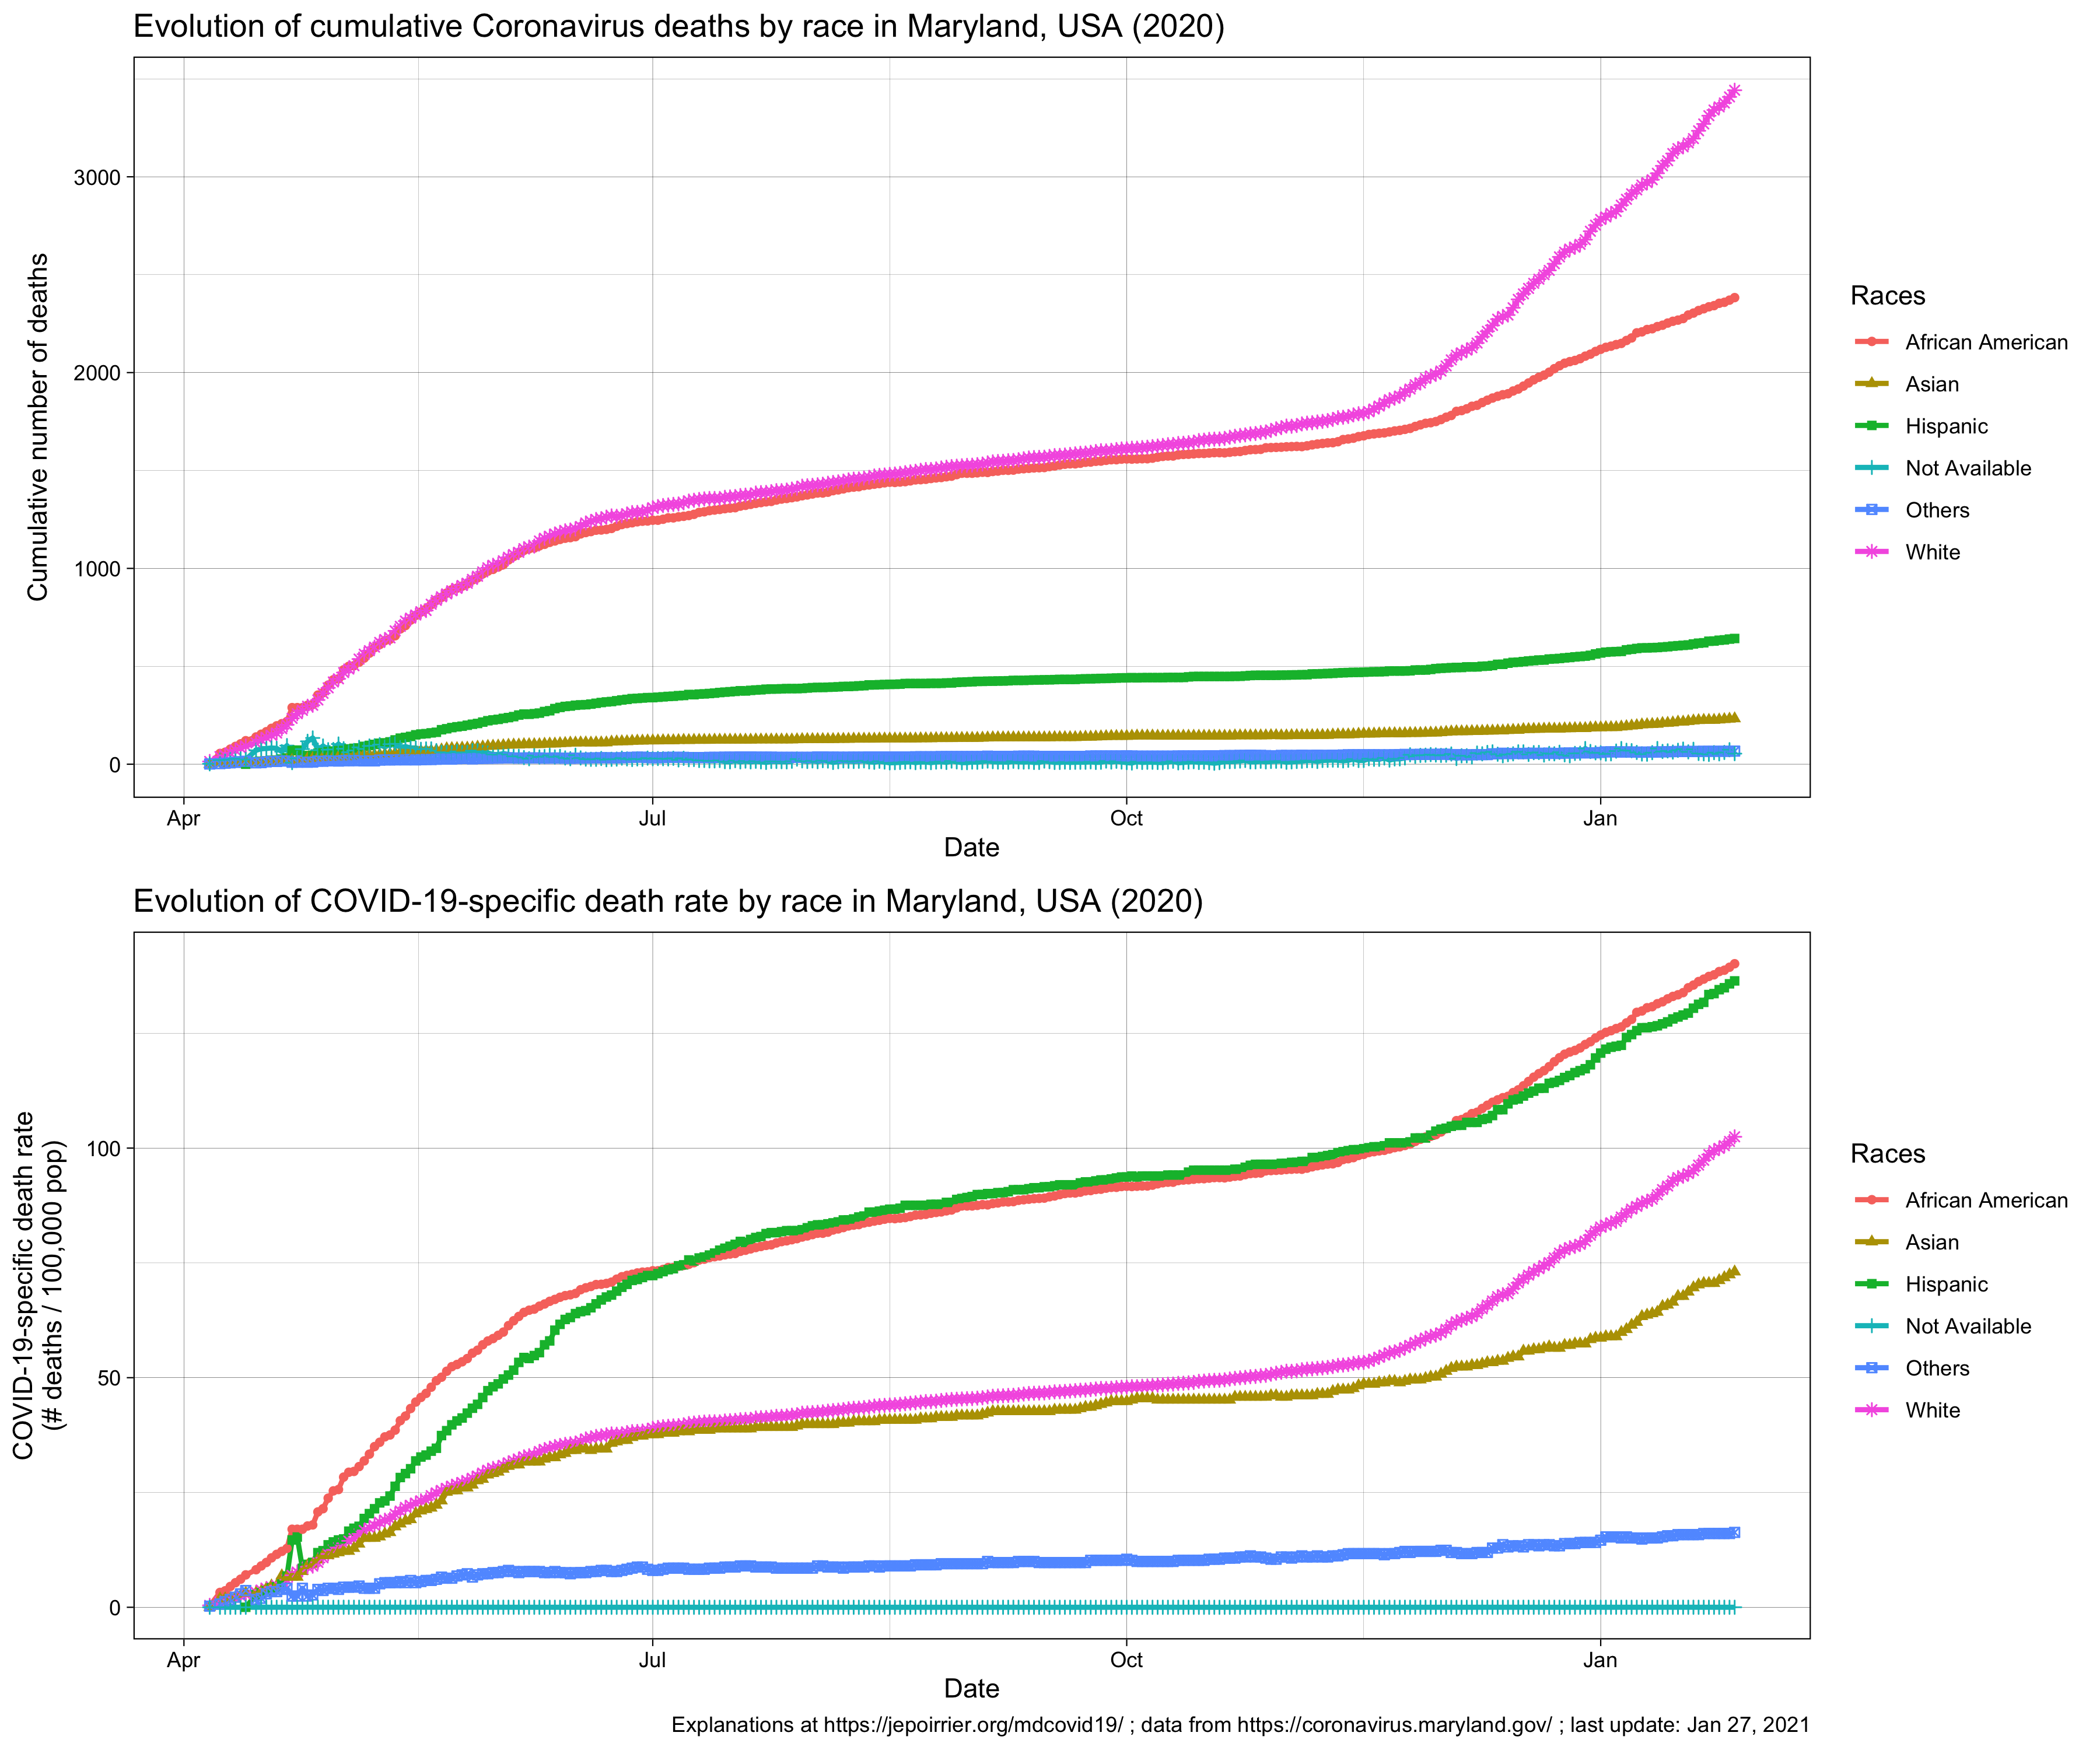
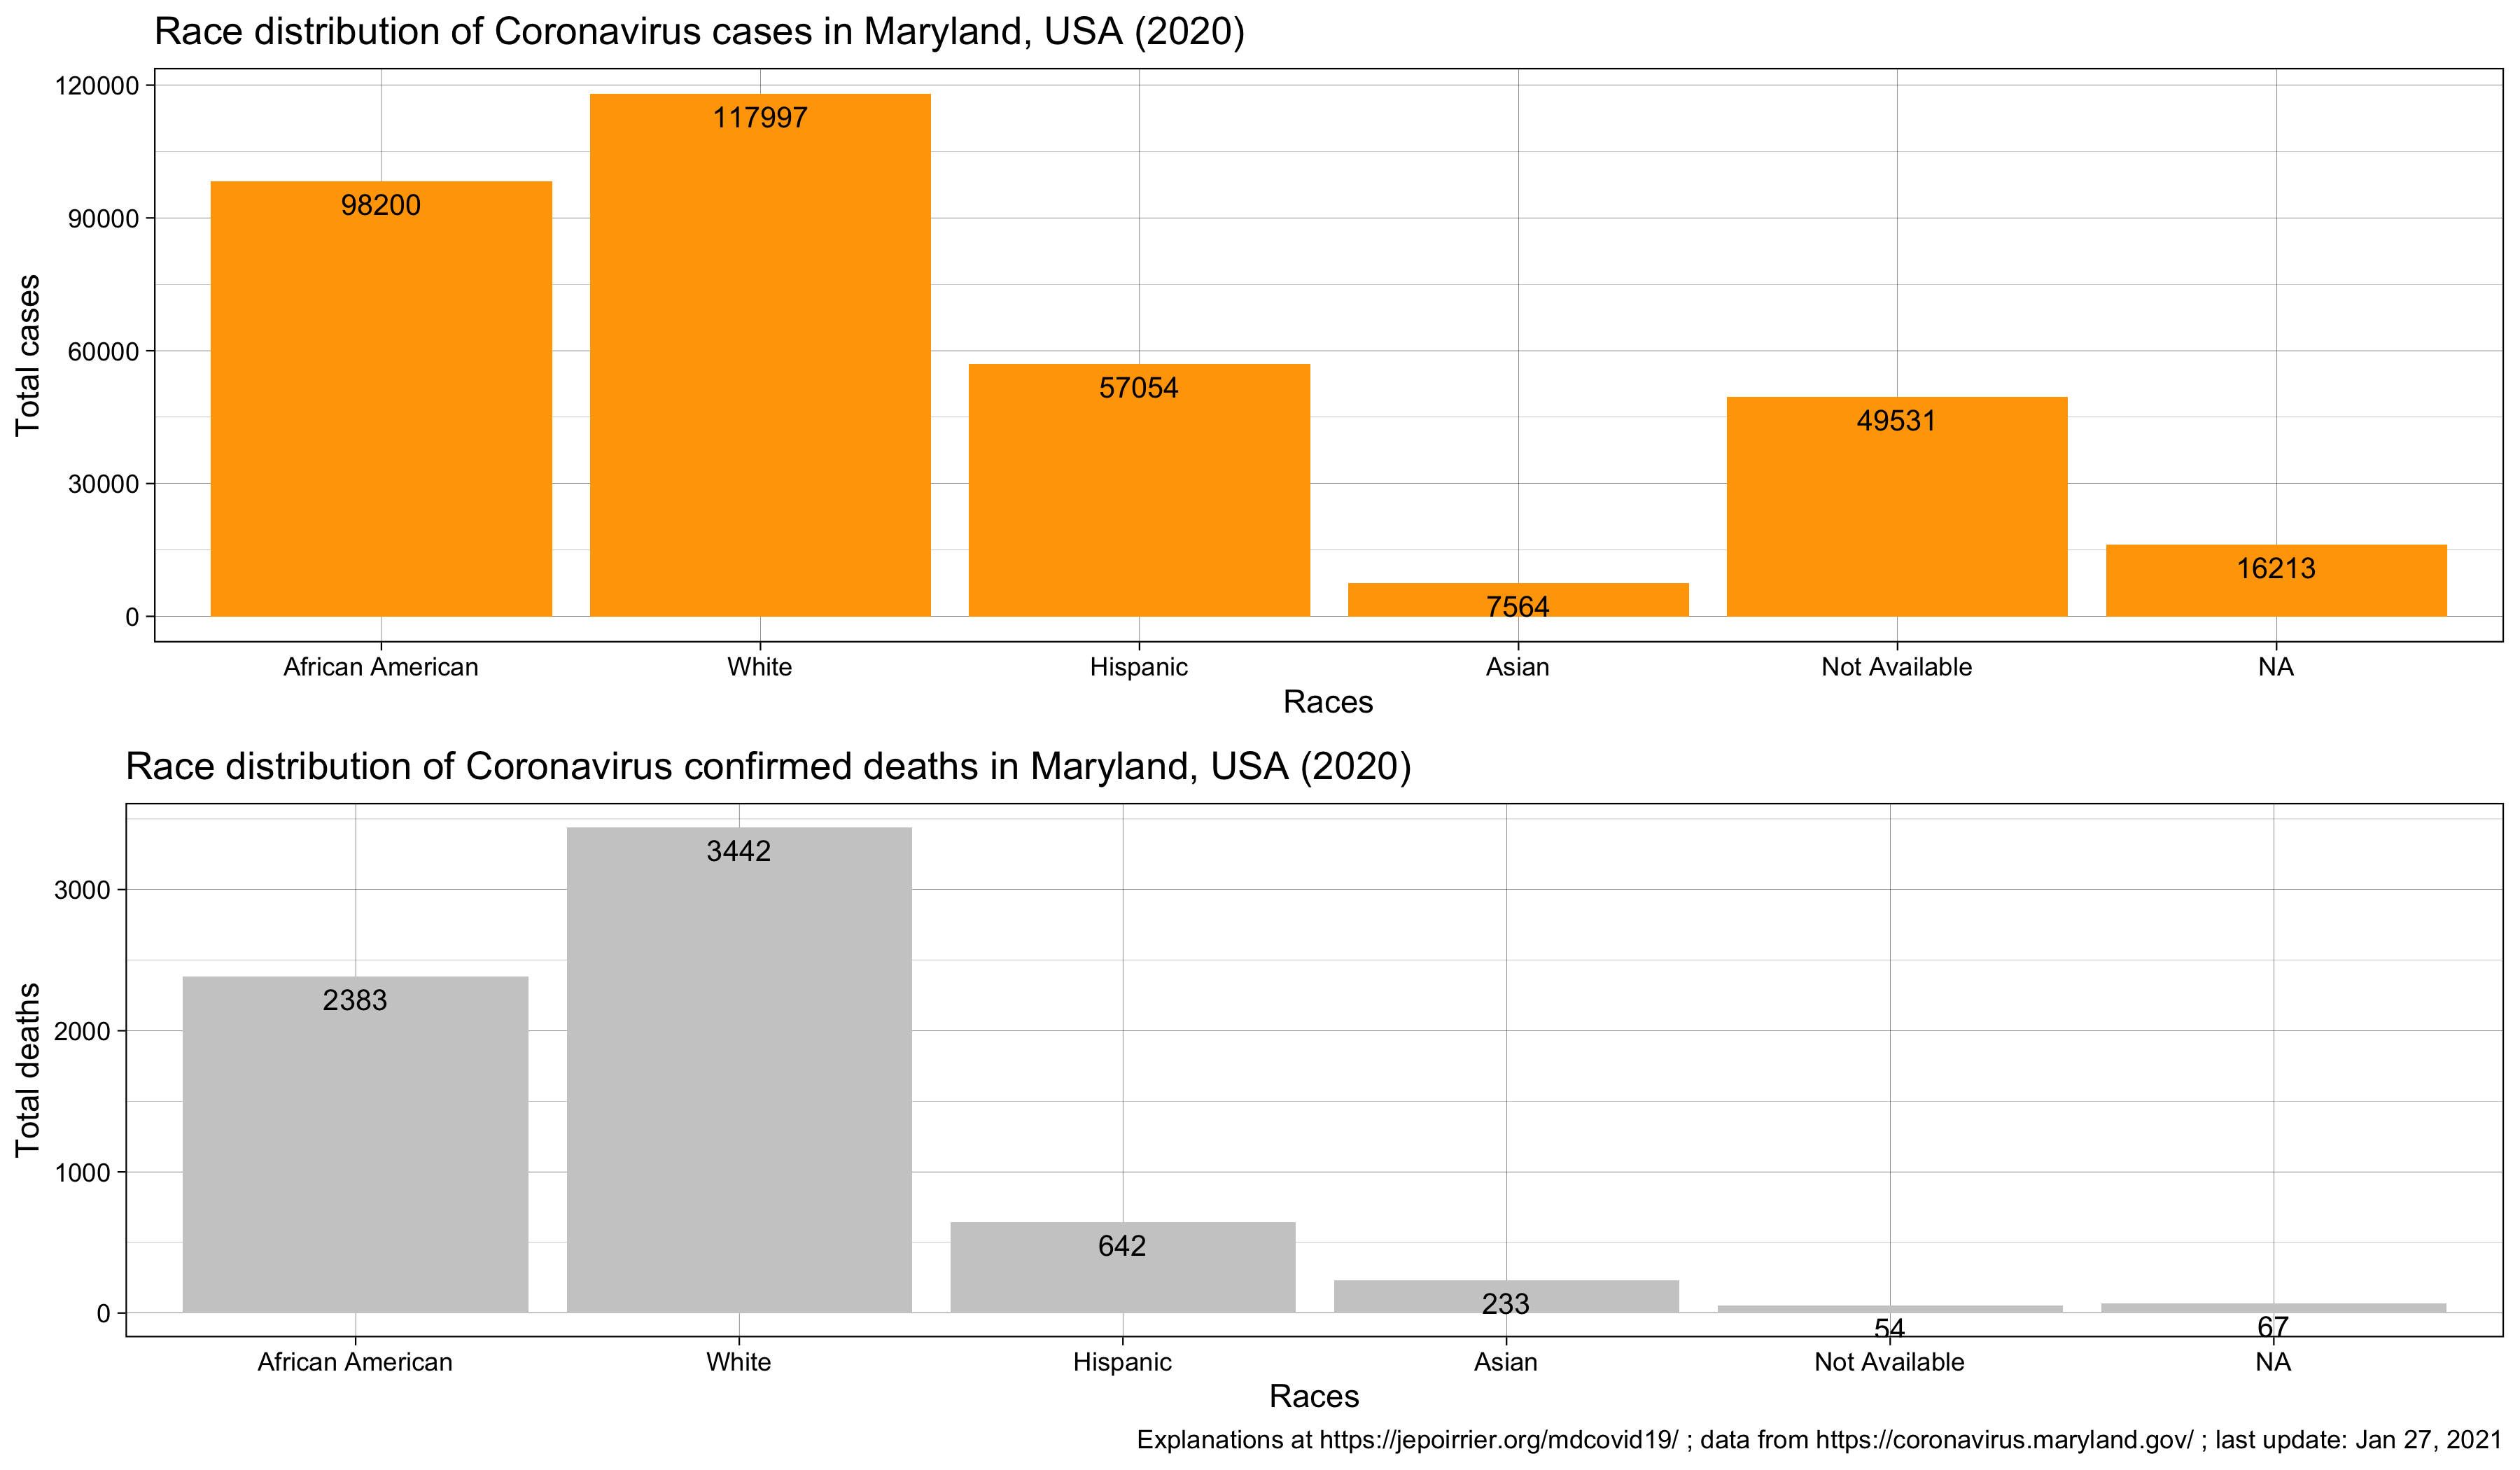
On April 9, Maryland continues to see an increase in all cases, hospitalizations, in all counties and all age groups. Today, the MDH started to display the number of cases and number of deaths by race/ethnicity. The African-American community has the most number of cases, followed by the White community – but we shouldn’t forget about the “Other” and “Data Not Available” categories. On top, as usual, although it’s unfortunately not surprising that the African-American community is harshly impacted, one should keep in mind that without the total number of tests done by community, there is little we can say. Given the percentage of positive tests is about 15% overall, one should see if this percentage is similar by community or not.
As the number of cases continues to increase and the data made available by the Maryland Department of Health also increases, I went back to the code and changed a few things (mainly to help maintain it on a daily basis). One choice I made is kind of breaking things: from now on, the trend by age group will not start at the same date as all charts. That’s because MDH changed their reporting of age structure on March 27. I no longer report the previous data (for age groups). I also added the trends of number of deaths by county and the gender distribution.
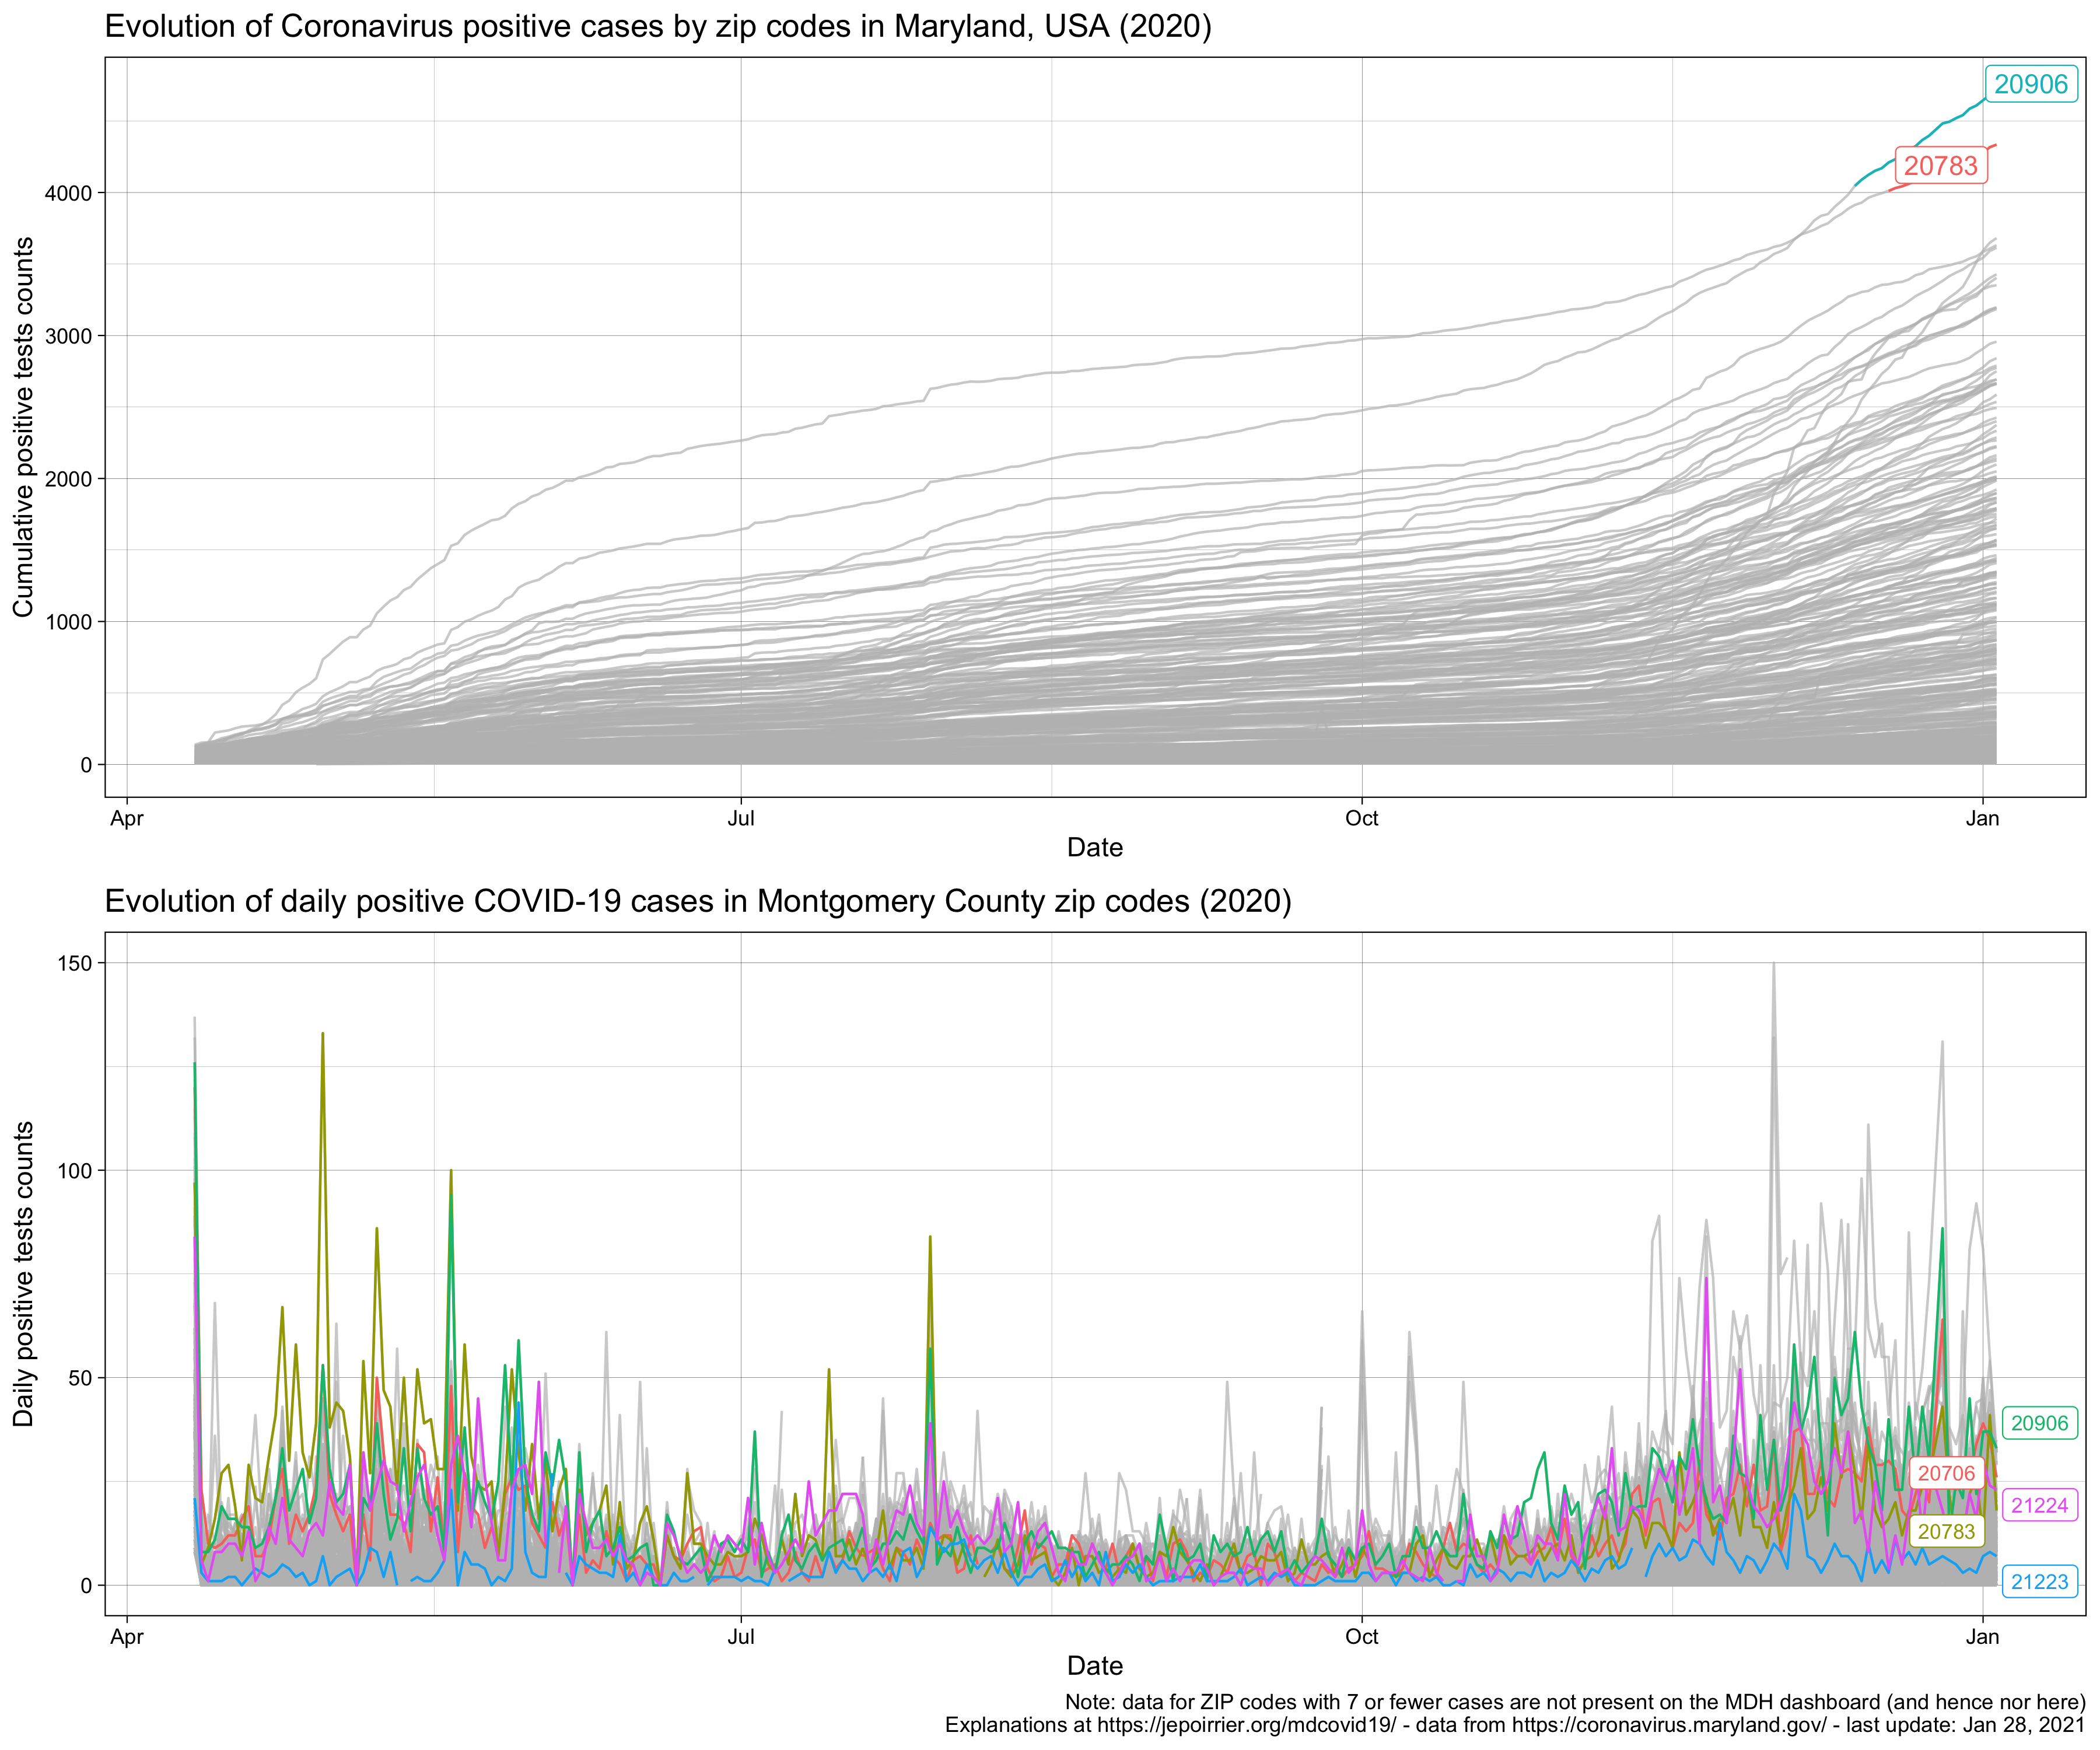
On April 12, the total number of positive cases in Prince George’s County is now above 2,000. I added the number of hospitalized. This is approximately the number of patients in hospital each day (equation: total # hospitalized – total # released) as a proxy for the number of patients currently sick (this is not perfect because of the lag in reporting, the data not available since the beginning, etc.). MDH also started to report the # of positive tests by zip code (this is very labor-intensive to transcribe these, I won’t do any chart with this data unless there is an easy way to download the data).

On April 13, cases continued to increase, with a small dip (maybe due to the weekend). Dorchester and St-Mary’s counties reported their first death due to COVID-19. On the good news side, the number of new patients released today (+147) was higher than the number of new patients hospitalized (+115). This reduced a little bit the number of patients currently hospitalized.
On April 14, I found a way to get data by ZIP code without too much hassle. I added the data to the Github repository and added the chart above. Any idea to improve the chart is welcome! (Straightforward idea: displaying ZIP codes as a map – but then we lose the temporal aspect)
On April 15, MDH added probable deaths. According to the CDC, death due to COVID-19 with certainty should use ICD-10 code U07.1. Where the cause of death is established with a clinical or epidemiological diagnostic (but with inconclusive or without lab results), the ICD-10 code U07.2 is proposed. There is a 3rd level of uncertainty, when the cause of death is “probable” or “likely” COVID-19. There, this guidance doesn’t specify what to do (it doesn’t mean that future guidance wouldn’t refine the algorithm). I assumed here that MDH “probable deaths” are coded with U07.2. Actually, it’s easier than that: Kata D. Hall mentioned in a tweet that a “death is classified as probable if the person’s death certificate lists #COVID19 as the cause of death, but it has not yet been confirmed by a laboratory test“. In total, today, probable deaths due to COVID-19 represents 18.3% of deaths due with certainty to COVID-19.
This had implications for the death count by county. Confirmed deaths diminished in some counties (e.g. Prince George’s: -7, Montgomery: -10, Baltimore County: -14) while the number of “probable” deaths in most counties doesn’t counterbalance these loss (e.g. Prince George’s: 11, Montgomery: 14, Baltimore County: 5). This is because new deaths occurred and a new category appeared: Data Not Available (i.e. deaths for which we don’t know the county, strange).
On April 15, we also see the cumulative number of positive cases to be over 10,000 for the first time (10,032). It took 38 days to reach that number. MDH also started to report cases and deaths in the Hispanic community. One can see they were reported in the “Other” community before.
On April 16, cases and deaths are still up. Montgomery County is now over 2,000 confirmed cases. Following this article in NPR (The New Coronavirus Appears To Take A Greater Toll On Men Than On Women), I was interested to see what we could see in Maryland. We have more positive cases in women than in men; that would go in the same direction as in the article: if women seek more testing than men (something we can’t see with MDH data), it’s normal more women would turn positive than men. What the article didn’t show (and what we can see at least in Maryland) is that, of all positive tests, men seem to die in greater number (4.1% instead of 3.2%) – see table below. Note that it can be due to a higher risk of dying for men and/or simply due to the lower number of tests done in men (increasing the proportion of more urgent cases).
| Gender | # positive cases | # confirmed deaths | % deaths / cases |
| Female | 5,817 | 187 | 3.2% |
| Male | 4,967 | 205 | 4.1% |
On April 17, we reached a total of more than 50,000 negative cases, more than 11,000 positive cases, more than 400 deaths and no new patients released. Not a good day. I stop reporting the negative tests on the charts with cases in order to better look at the cases. Negative tests are indirectly on the % of positive tests.
On April 18, all numbers are still going up. However, even if testing is progressing (but not accelerating yet), the percentage of positive cases seems to have difficulties going above 18-19% of all tests.
On April 19, numbers are still going up. At the bottom of the graph, today see more 30-39 years old dead due to COVID-19 than 40-49 years old (2 more) although this age category “benefited” from the inclusion of “age not available (DnA below). I don’t know if it’s a temporary glitch or an actual trend? Also, there seems to be a cycle of ~6 days where the daily approximate # of COVID-19 patients remaining in hospital decreases (less hospitalization and/or more releases). But it’s maybe an effect of the weekend?
On April 20, Maryland Governor Hogan announced he procured 500,000 COVID-19 tests from South Korea. Hopefully this will increase the testing capabilities in Maryland. All data still going up.
On April 21, MDH released current and past data on the number of patients daily in hospital and broken down by acute care department and ICU. I therefore removed the previous way to compute this data as it’s not useful anymore (and I overestimated this number in recent days).

On April 22, the number of total positive ever done in MD was above 60,000 (but still no drastic improvement due to the 500k tests delivered last weekend). And we have now more than 600 deaths. Baltimore County has now more than 2,000 cases since the beginning of the pandemic. And Montgomery and Prince George’s counties have both the same number of deaths (58). The number of confirmed deaths in the 80+ age group is growing fast while we still don’t see any deaths below 20 years old (that’s great!). Also, MDH played a bit with past hospitalization data on the dashboard. Thanks to Tyler Fogarty for spotting it and correcting it directly in the GitHub repo (no need to check the dashboard and re-copy past data :-))!
On April 23, cases continues to accrue and no sign yet that the tests ordered by Gov. Logan from South Korea are impacting results. However, if hospitalization and discharge procedures didn’t change, we can see a second day of decline in the number of people in hospital. Also: it’s been there since a few days now, the zip code 20783 (Hyattsville, MD: NE of Washington DC) is surging in number of cases and overtook 21215 (Baltimore, MD: MW region) today (309 cases vs. 293).
On April 26, we see the trend in testing increasing again (+7,542, we are now close to 100,000 tests since the beginning of this count). Since the last 24 hours, we saw a huge increase of negative reports and a decrease of negative reports, bringing the % of positive test at 19.22% of all tests. However, the acute care beds were increasing (+63 in the last 24h) and therefore the total number of beds occupied today too. I added the proportion of positive and negative cases and it seems that, on a daily basis, it slowly decreases.
Stay safe and stay inside.
This post continues on another post, starting April 27, 2020.
All the data and scripts are on a Github repository if you want to play.


