Sometimes, you think that you found something interesting but the Maryland Department of Health is already presenting it on its COVID-19 dashboard 😀
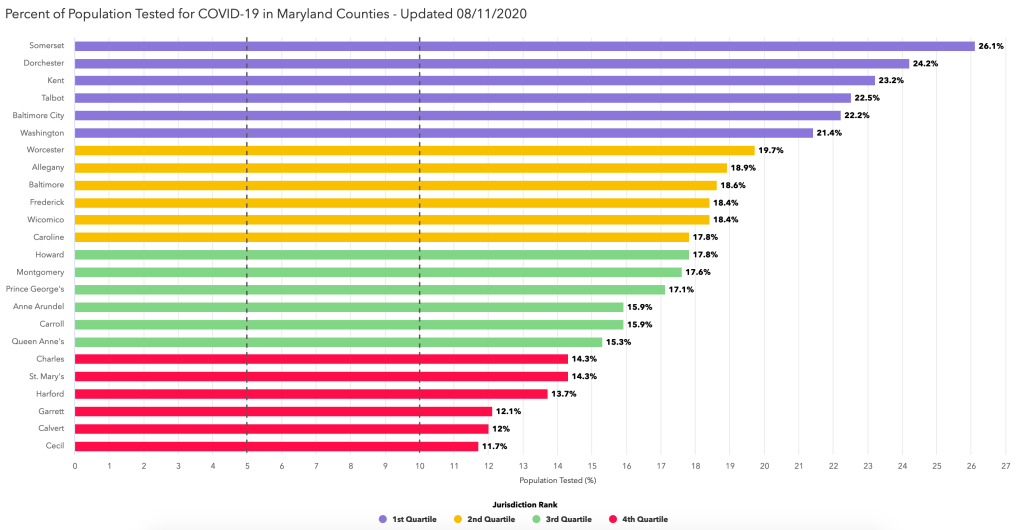
For instance, I calculated the percentage of residents of the different counties ever tested (regardless of the test result). I found out that a third of Maryland counties (8/24) tested at least once more than 25% of their residents. Indeed, as of yesterday (August 10), here are the counties in that category:
| County (alphabetical order) | % population ever tested |
|---|---|
| Baltimore | 25.8% |
| Baltimore City | 30.2% |
| Dorchester | 30.4% |
| Kent | 30.6% |
| Somerset | 30.8% |
| Talbot | 28.6% |
| Washington | 27.7% |
| Wicomico | 25% |
While we are at it, here are the 5 counties with less than 20% of their population tested (still as of August 10, 2020):
| County (alphabetical order) | % of population ever tested |
|---|---|
| Calvert | 14.9% |
| Cecil | 15.3% |
| Charles | 18.6% |
| Harford | 18.1% |
| Queen Anne’s | 19.4% |
Graphically, we see that all counties are testing more and more, and increasing at approximately the same speed:
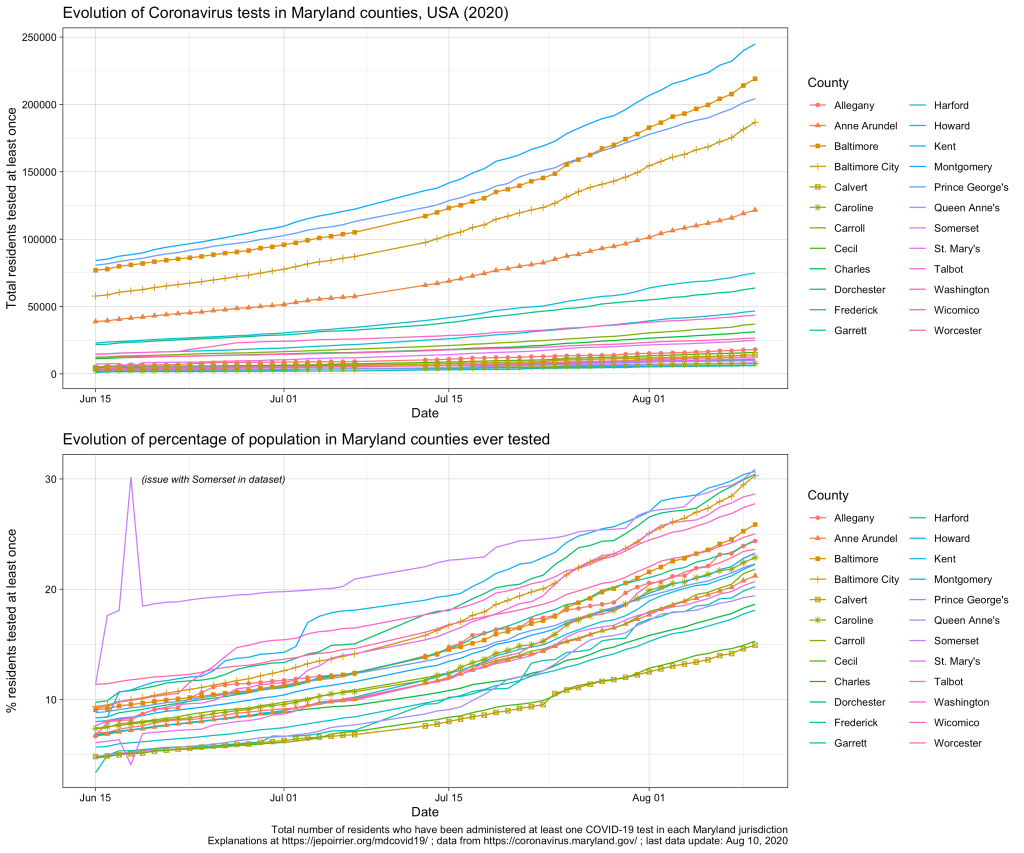
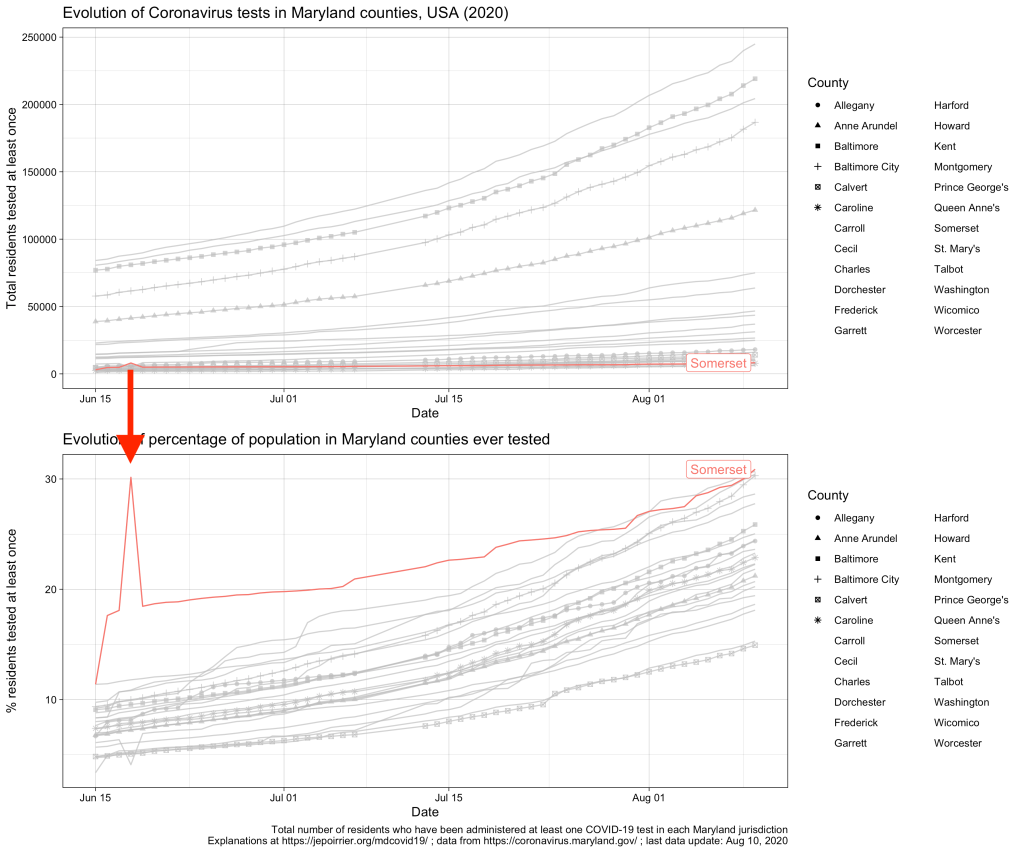
As you can see, there are 2 minor issues with the dataset from the MDH API. First, Somerset reported more than double the normal number of tests on June 18, 2020; it went back to “normal” on the next day (I suspect an encoding error here, see highlight below). Then, there is no data after July 7; data resumes on July 13 (a posteriori, I don’t recall reading any issue about county data collection during that time). None of these prevents looking at the current data.
Now, as I mentioned, the official dashboard has already this data, presented by quartile, as a kind of competition between counties 😉 … (the % are slightly different, probably because we are using different sources for the population totals – I’m using the population projections from the Maryland Department of Planning).
To be continued …
As usual, you’ll find other graphs on my page about COVID-19 in Maryland (and figures above are updated with new data as they appear) and the data, code and figures are on Github (including these ones).
