This page is looking at trends in COVID-19 cases in Maryland, USA.
I started this page to gather in one place all links to my blog posts on specific aspects of COVID-19 in Maryland, links to tools I developed as well as all figures generated (at the bottom). This was updated as new posts/tools/figures were written but please note that I don’t live in Maryland anymore (but I still love this state!). If you want to update all these analysis, all my code and figures are here, for free. And, as always, feel free to send me suggestions, comments and questions!
Note that if you want official information about COVID-19, please visit the Maryland Department of Health. And as always, scientific and understandable information is on the CDC website.
Figures. These figures are all on the Github repo, in the figures/ directory. While they are not too many, I’ll link them below (they are updated automatically). You may click on them to better see details.
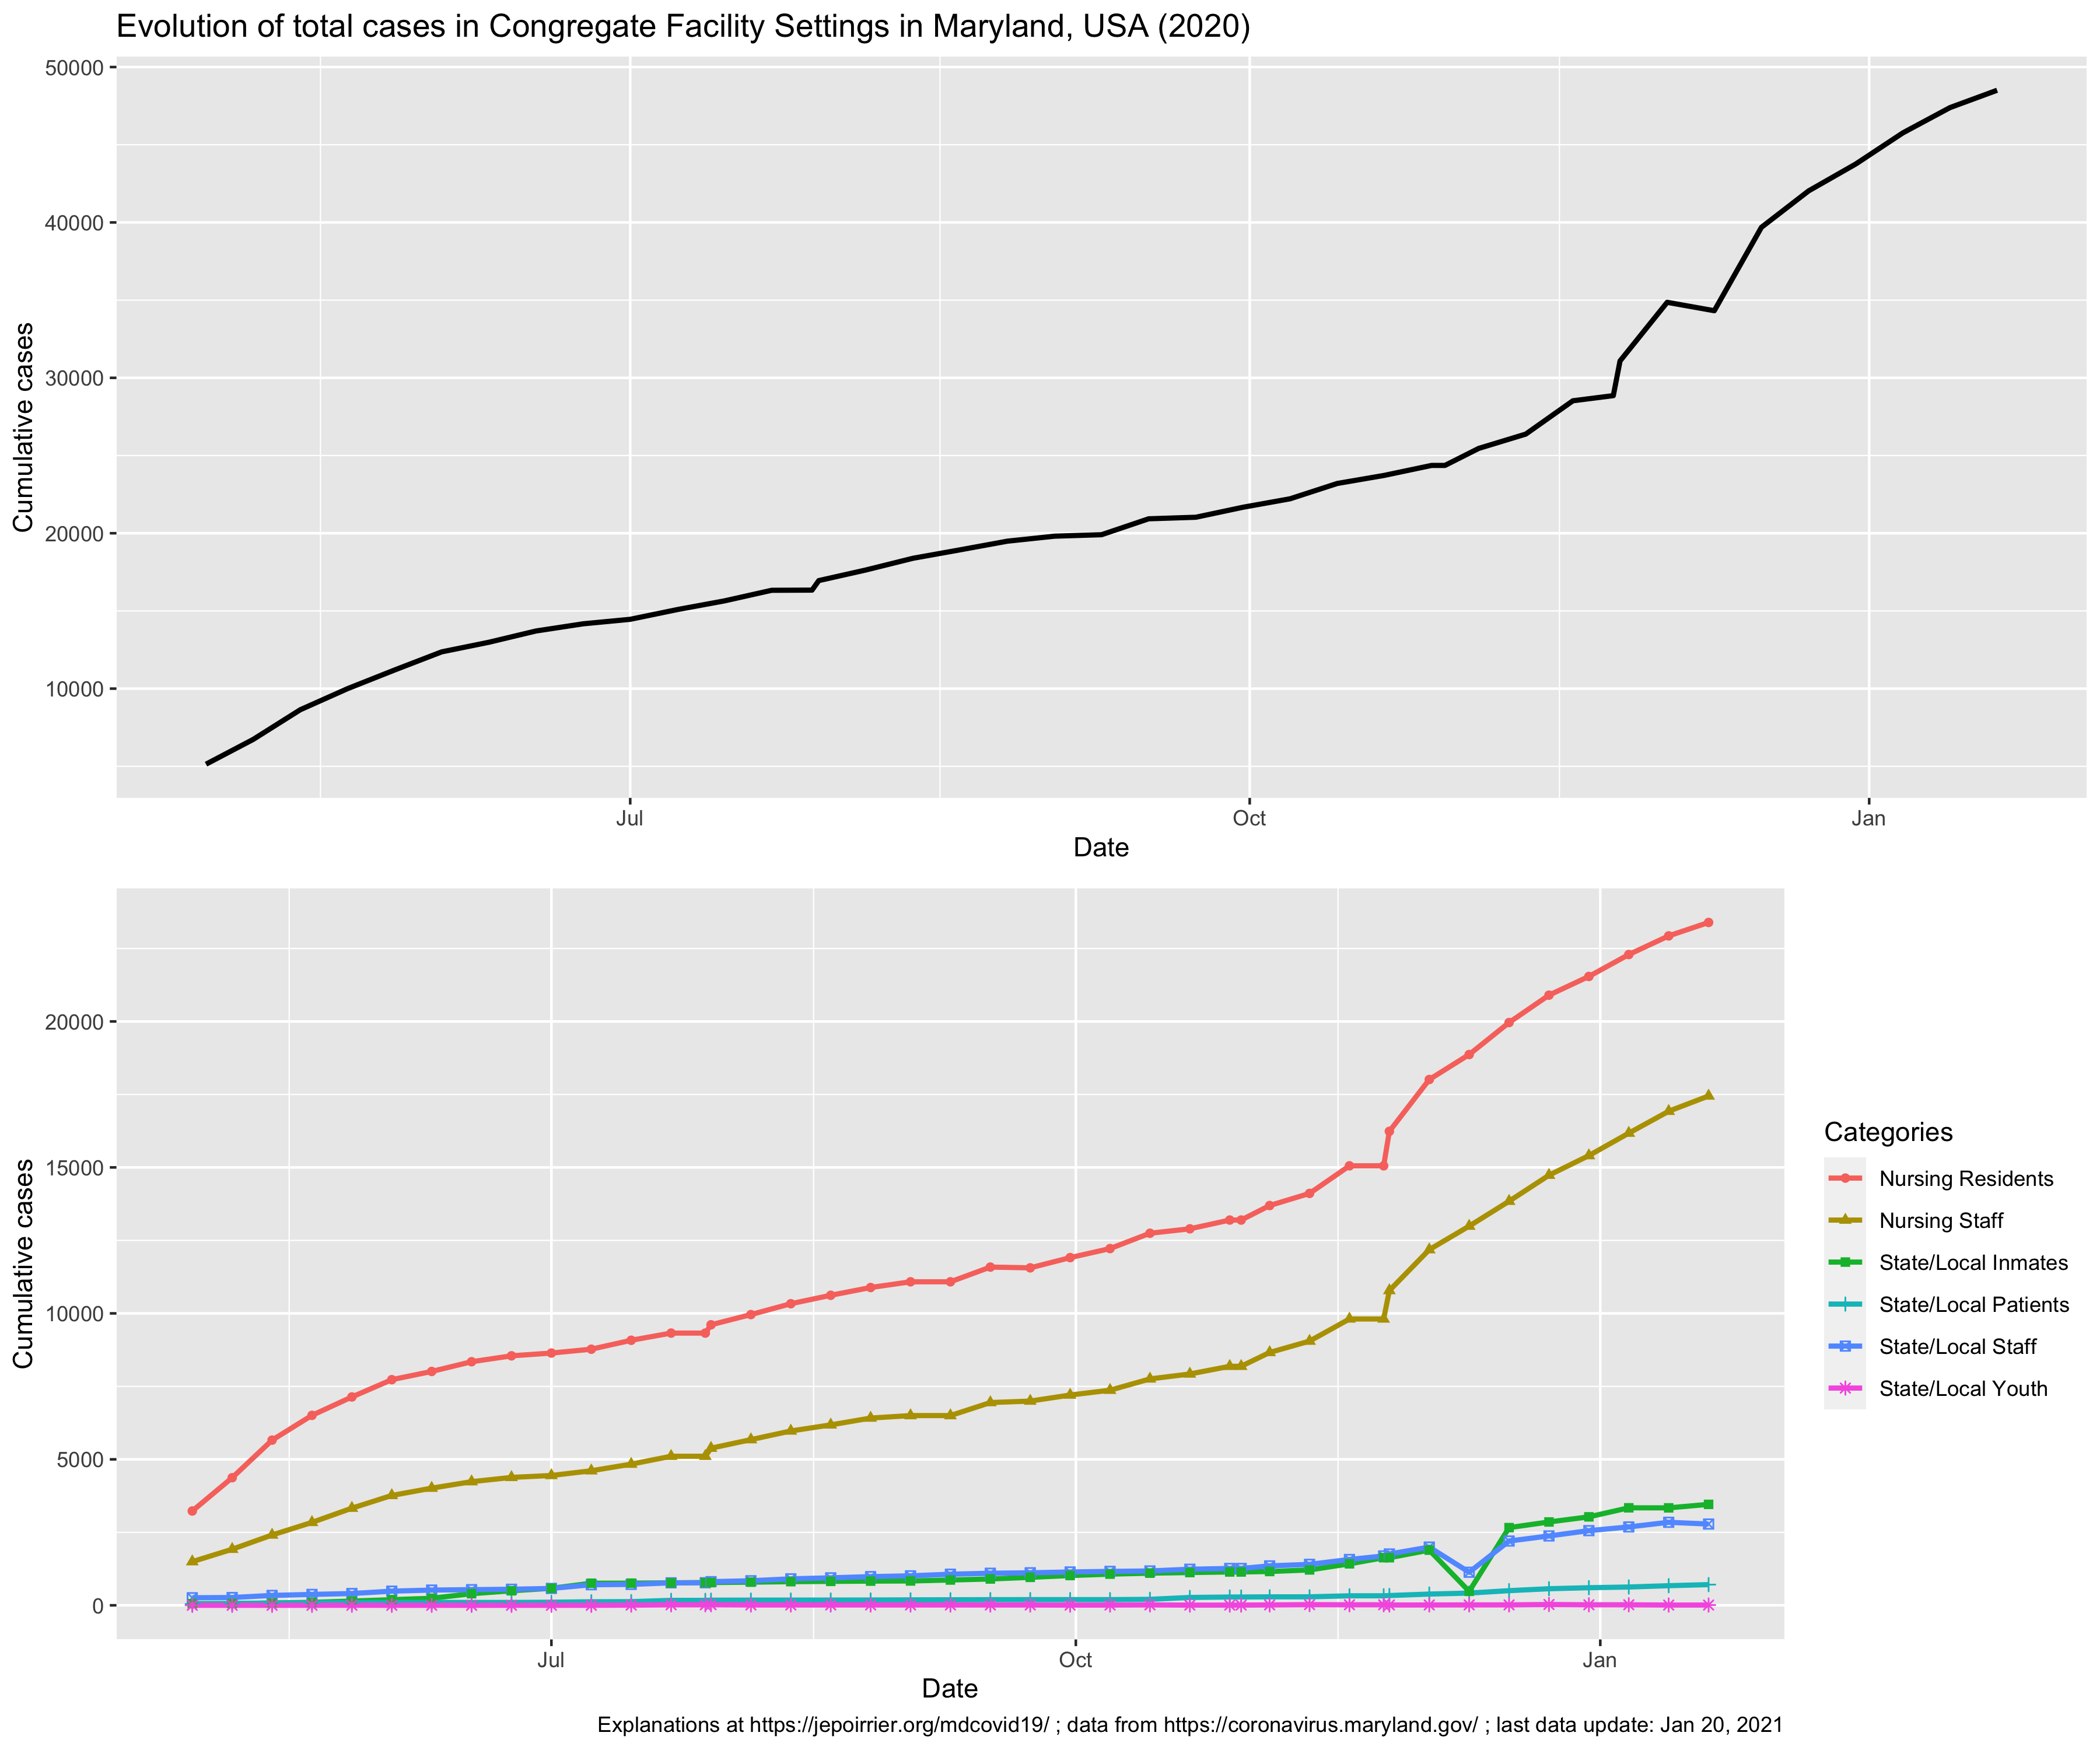
Cases
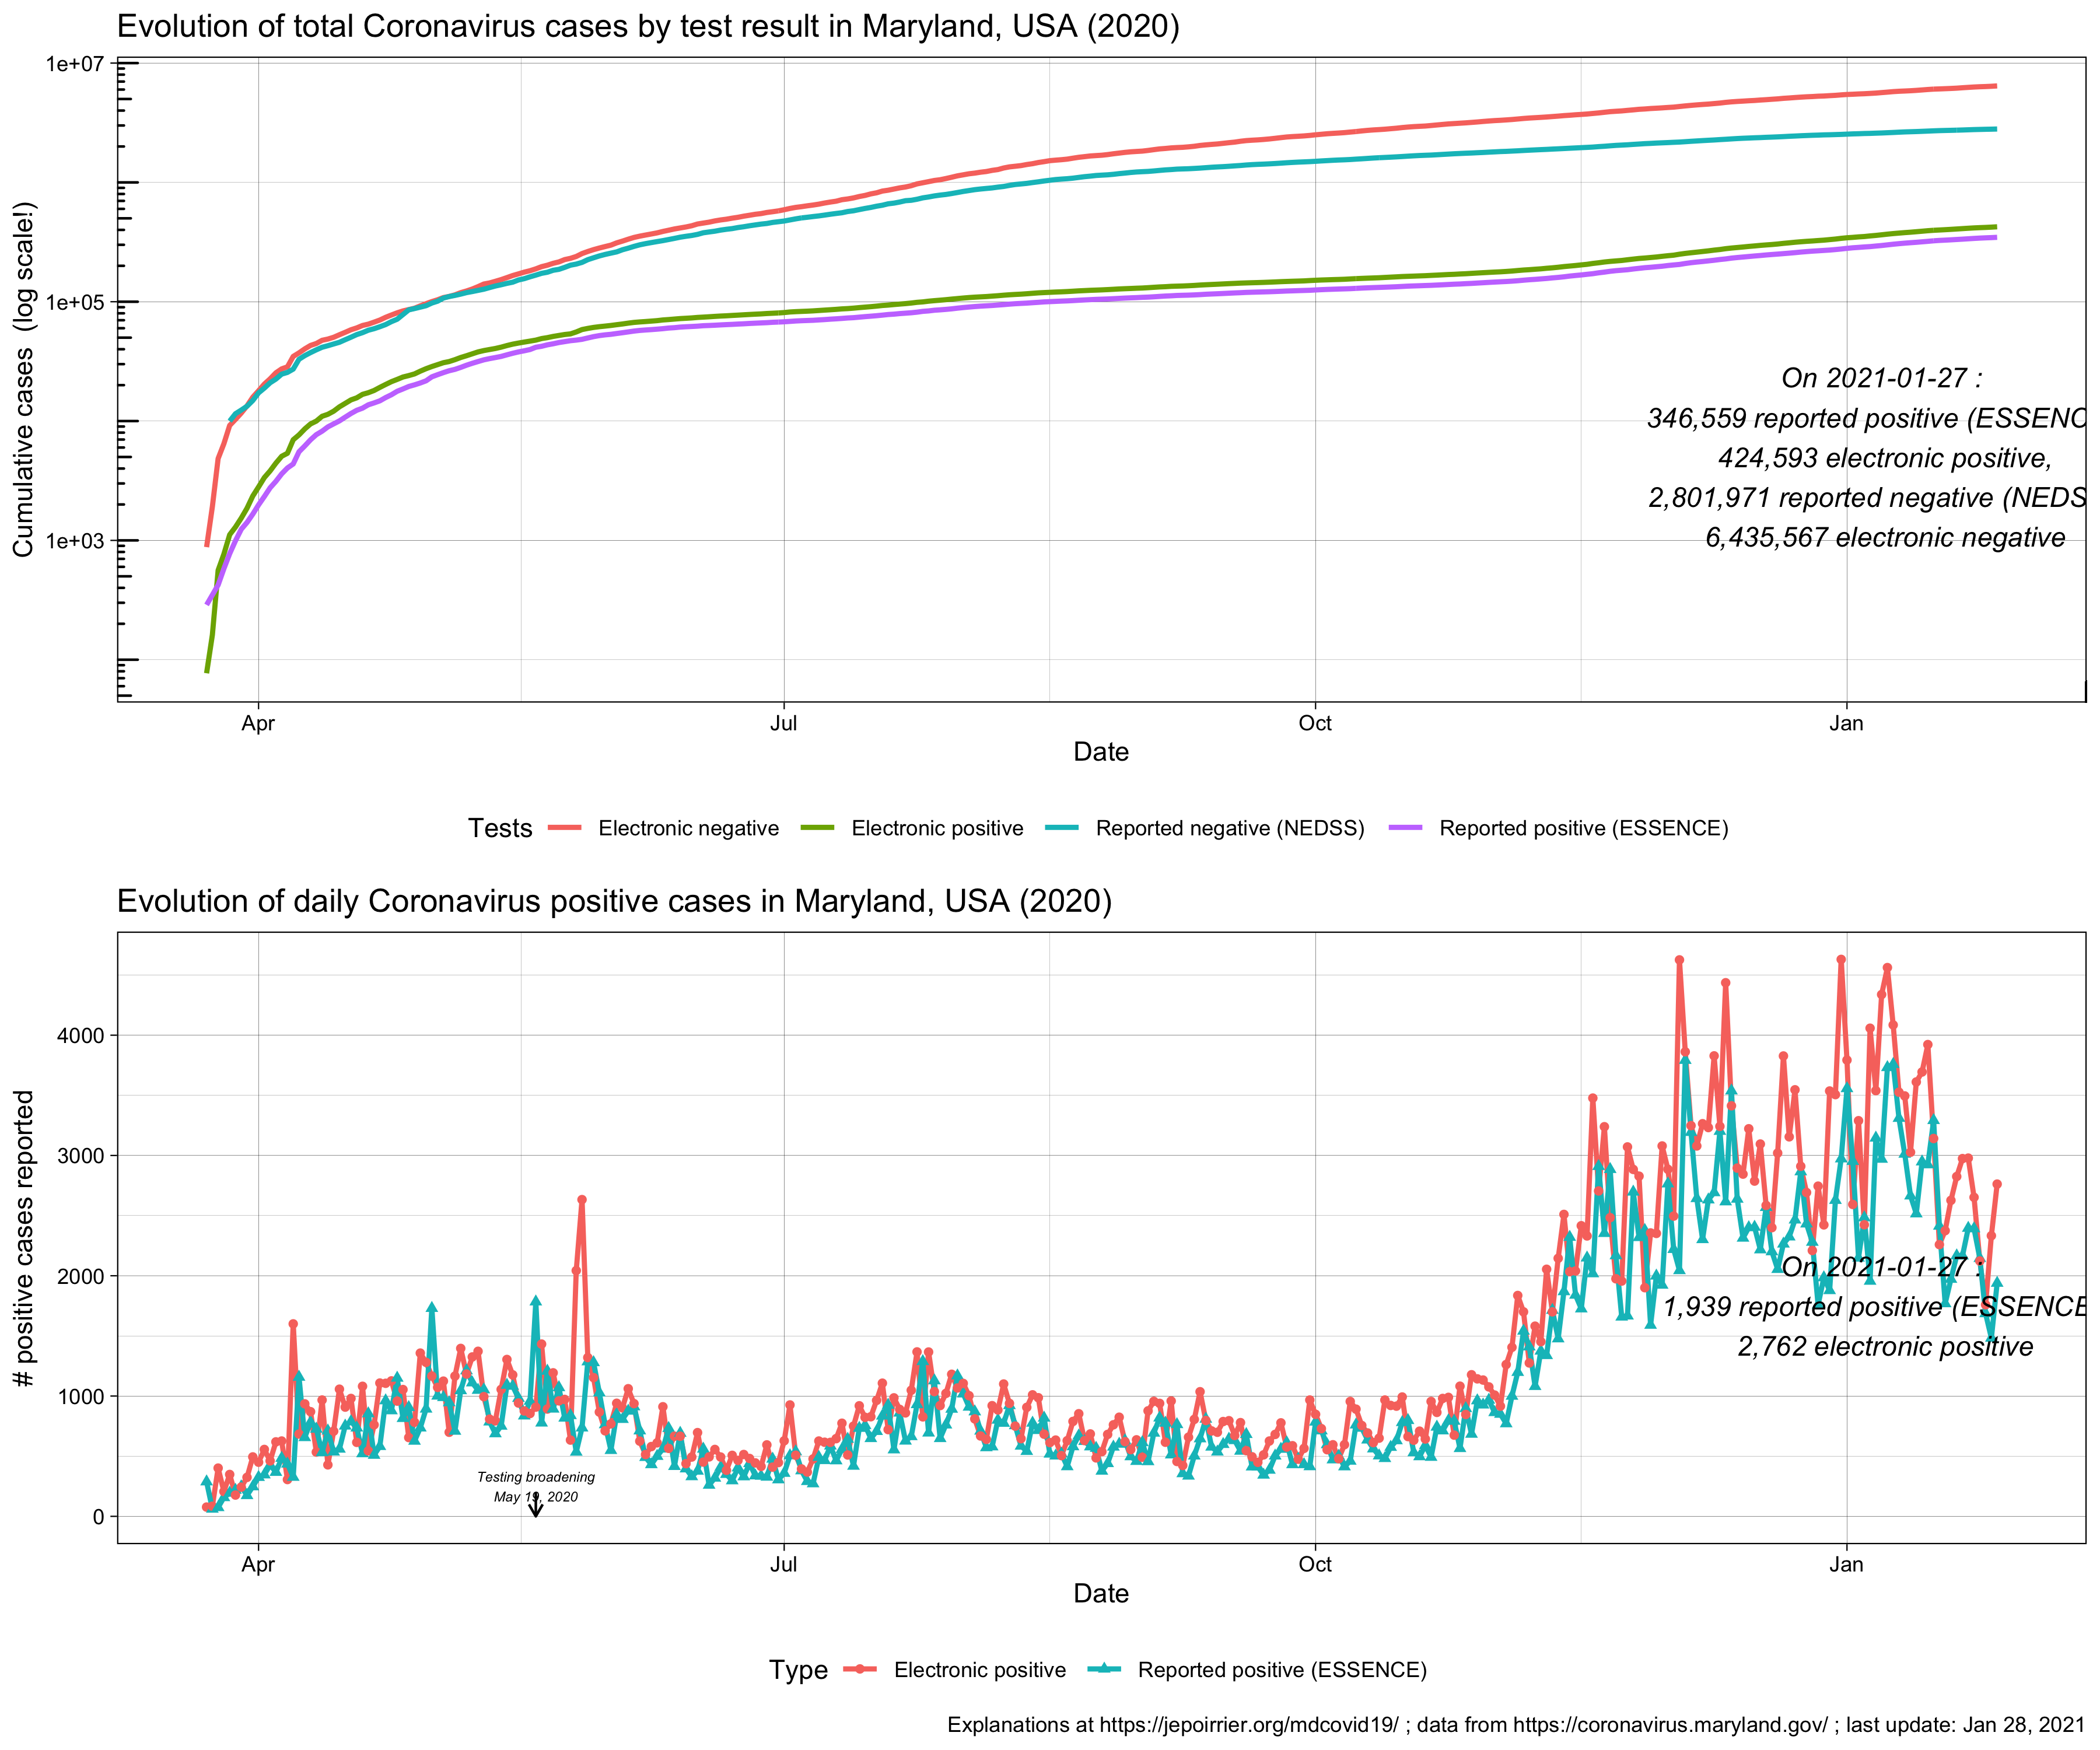
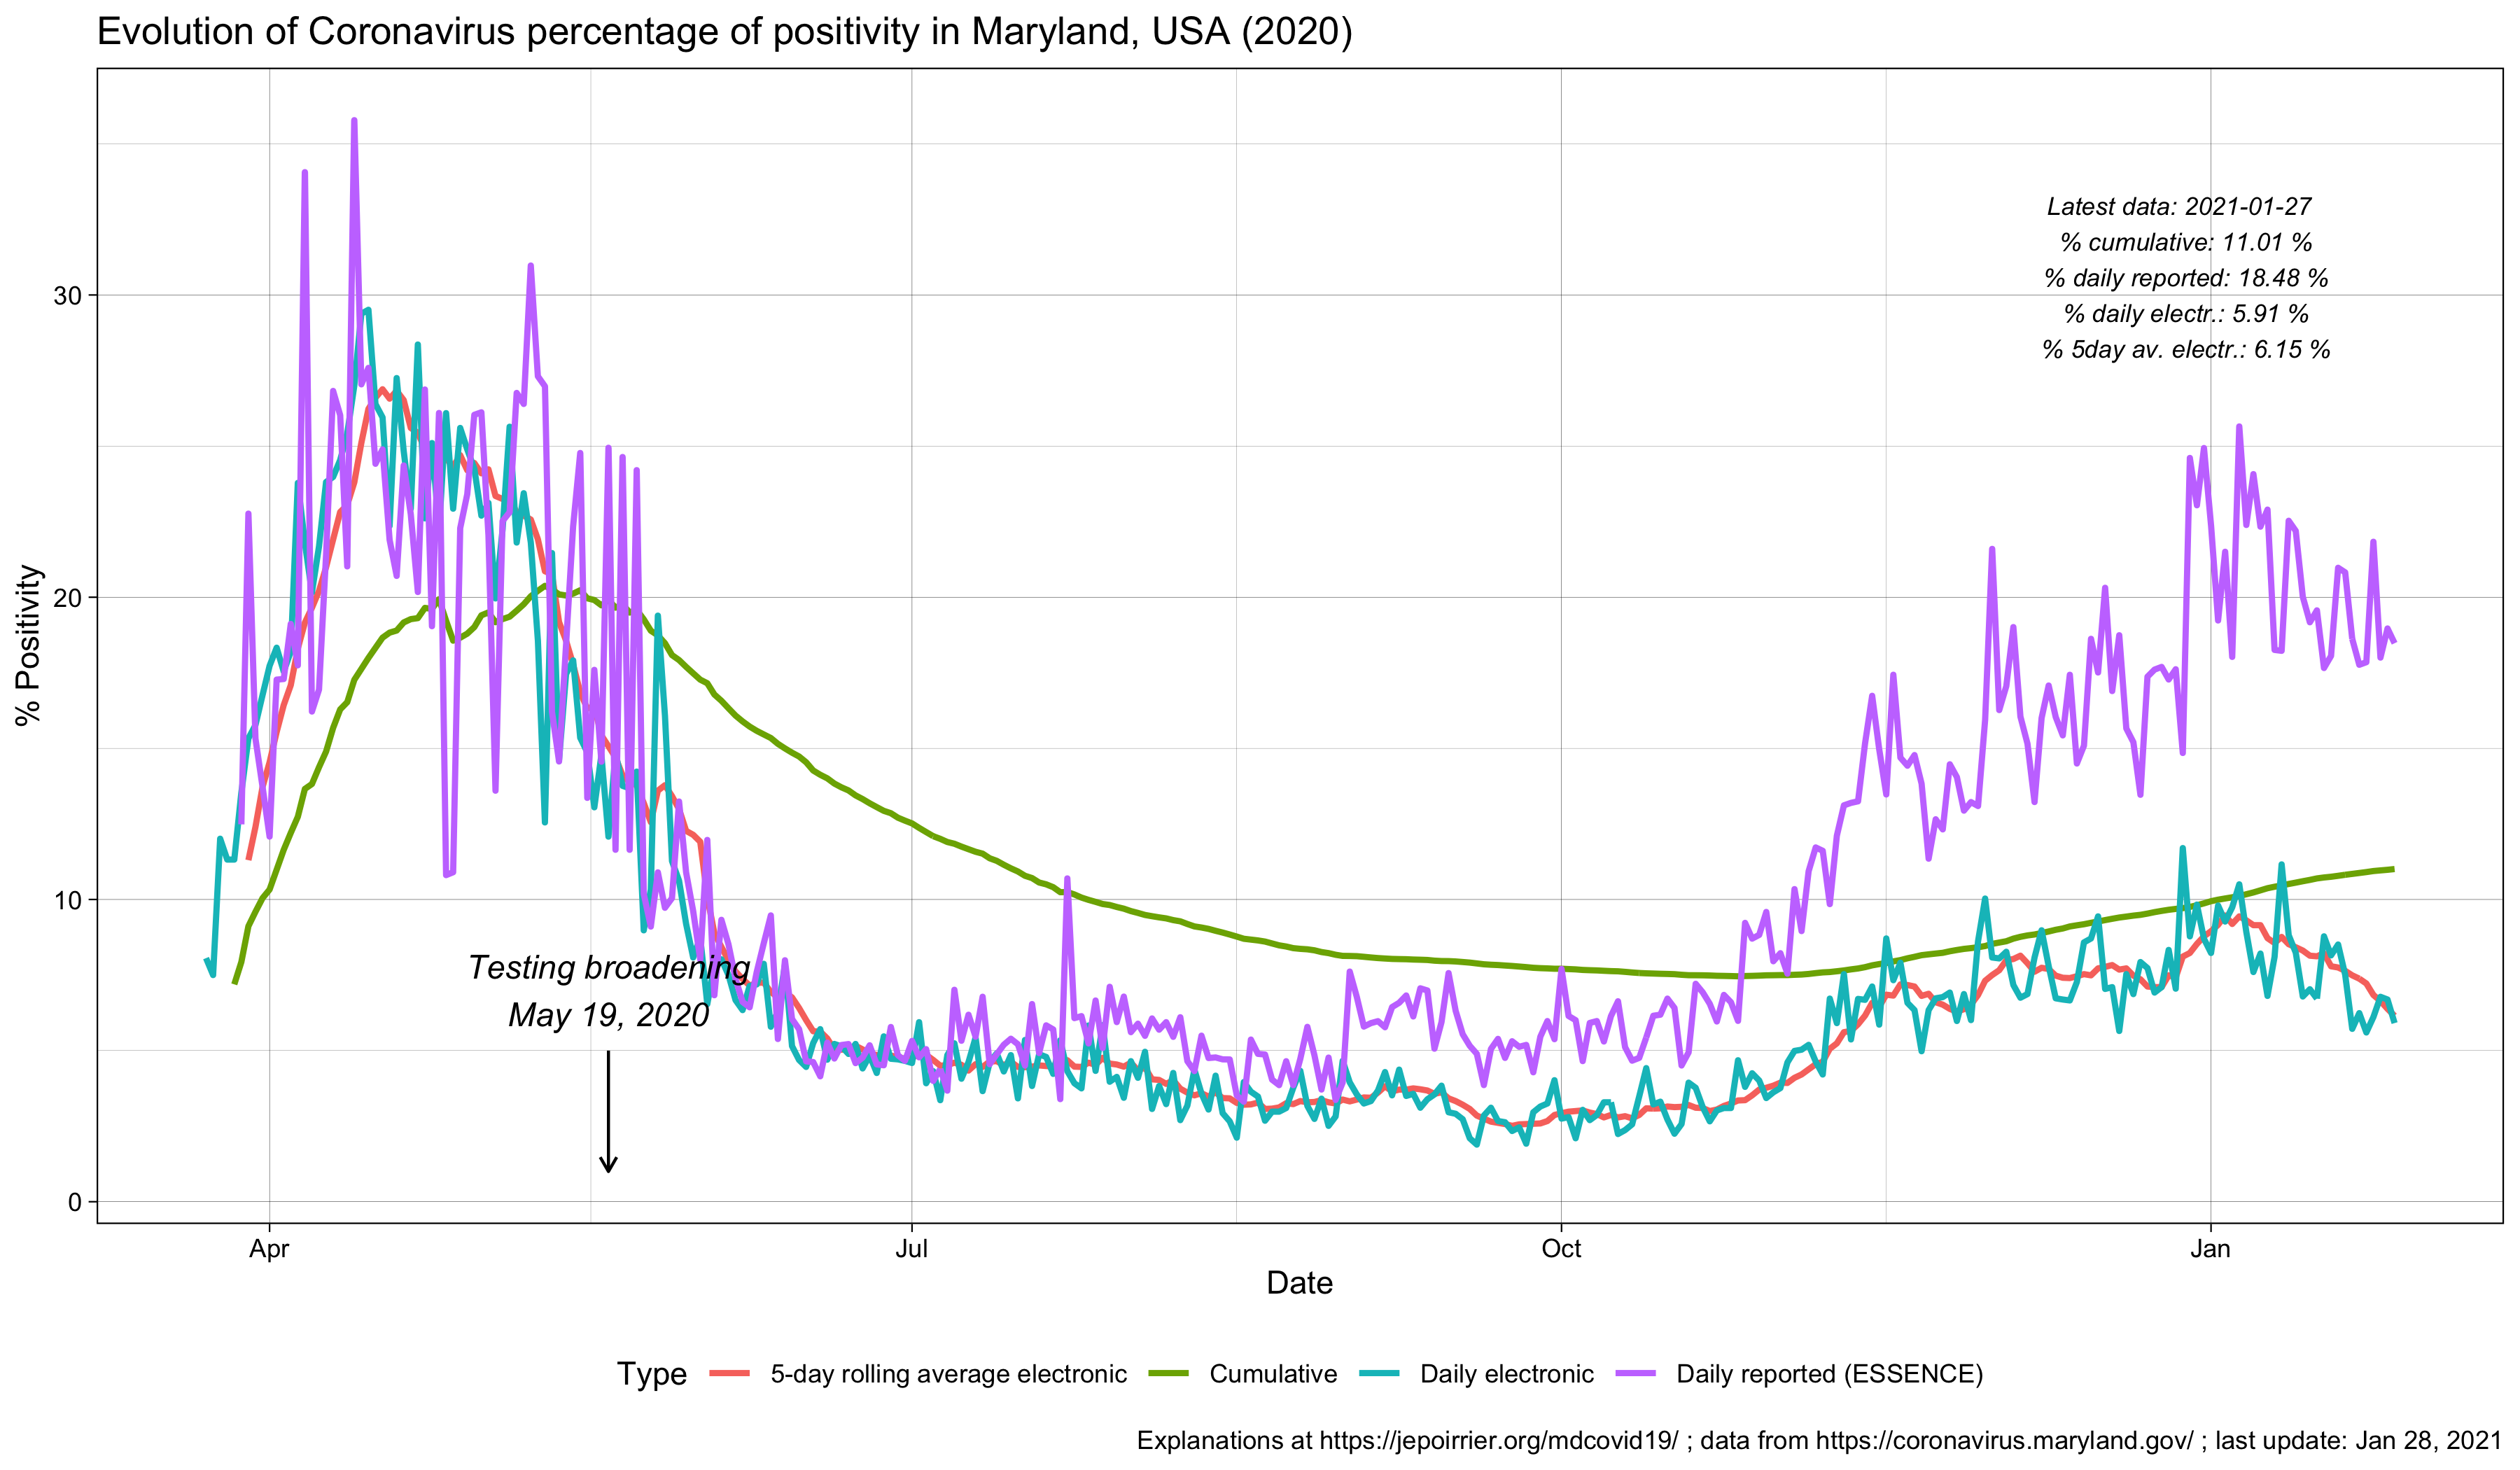
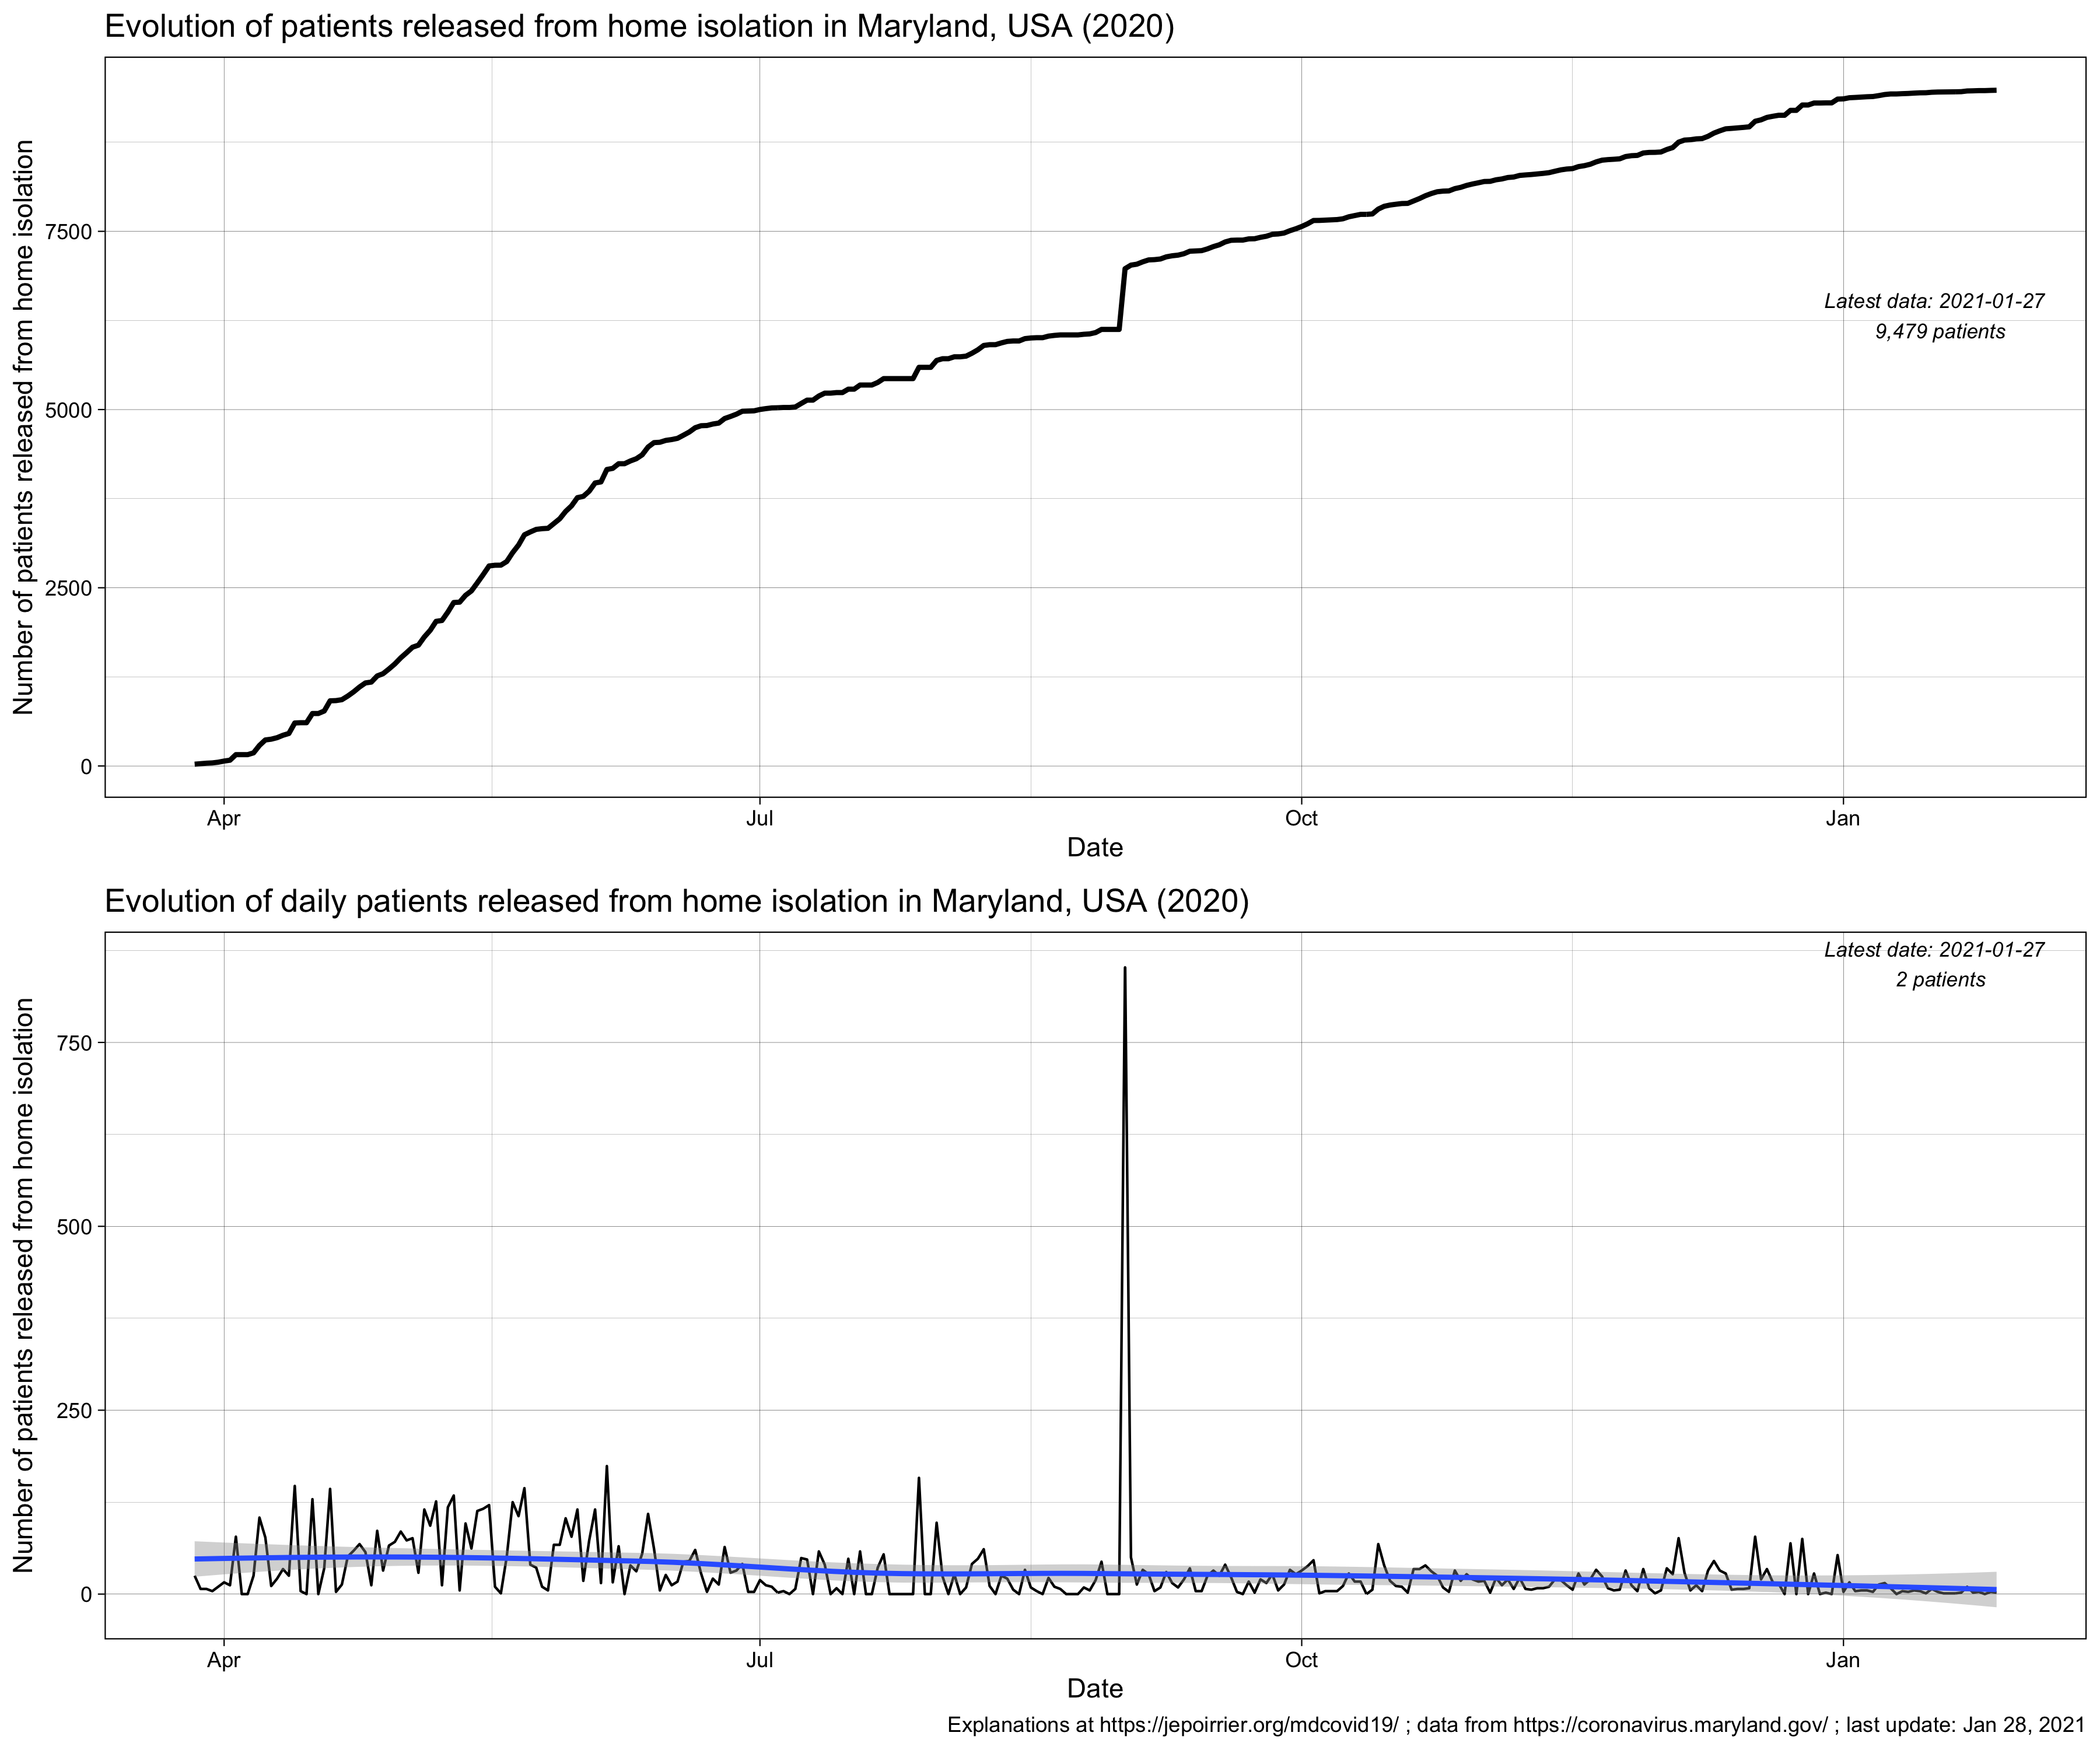
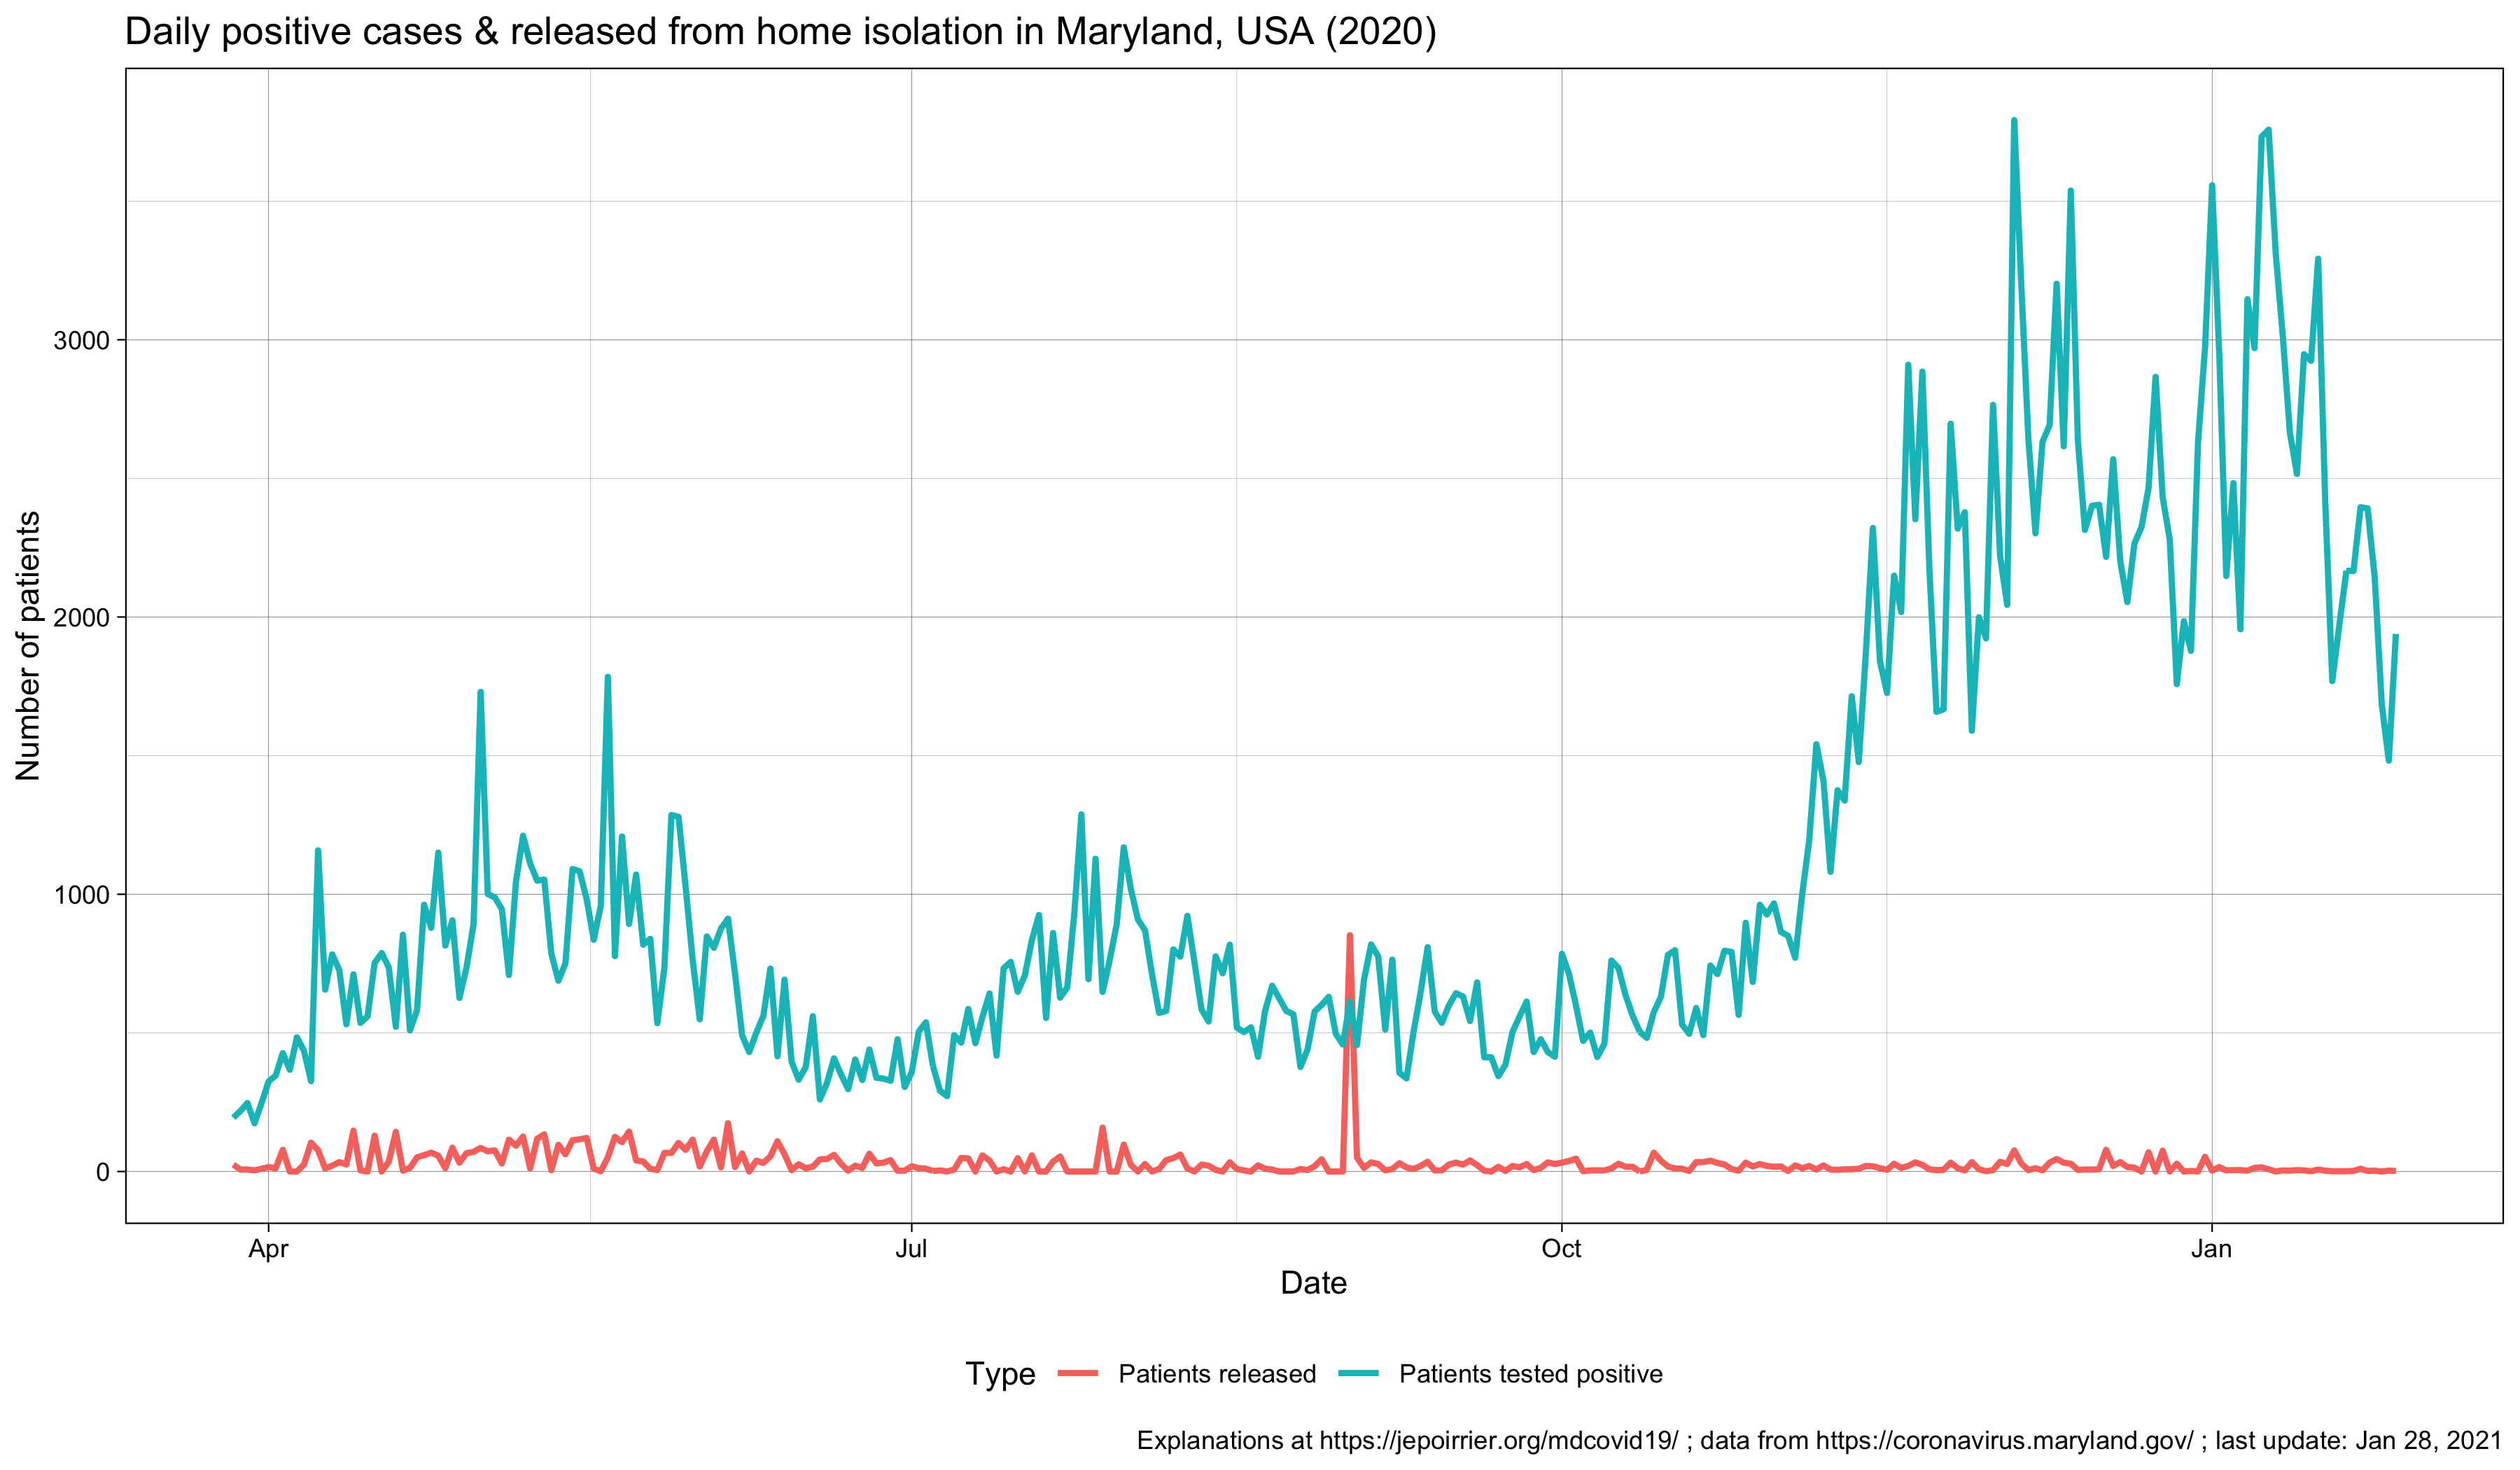
Graphs showing the cumulative and daily evolution of COVID-19 tests in Maryland. One can see there are several reporting sources, giving different daily numbers. But usually trends are similar.Graph showing the evolution of the COVID-19 positivity rate in Maryland. Since there are many sources reporting positive cases, there are many positivity rates. I wrote about that when I started comparing these rates.Graphs showing the cumulative and daily evolution of COVID-19 releases from (home) isolation in Maryland. I wrote about how the purpose of this data was not very clear (at least in August 2020).Graph showing the daily COVID-19 positive cases and the number of patients released from (home) isolation in Maryland. It seems there is a similar pattern for both.
Hospitalizations
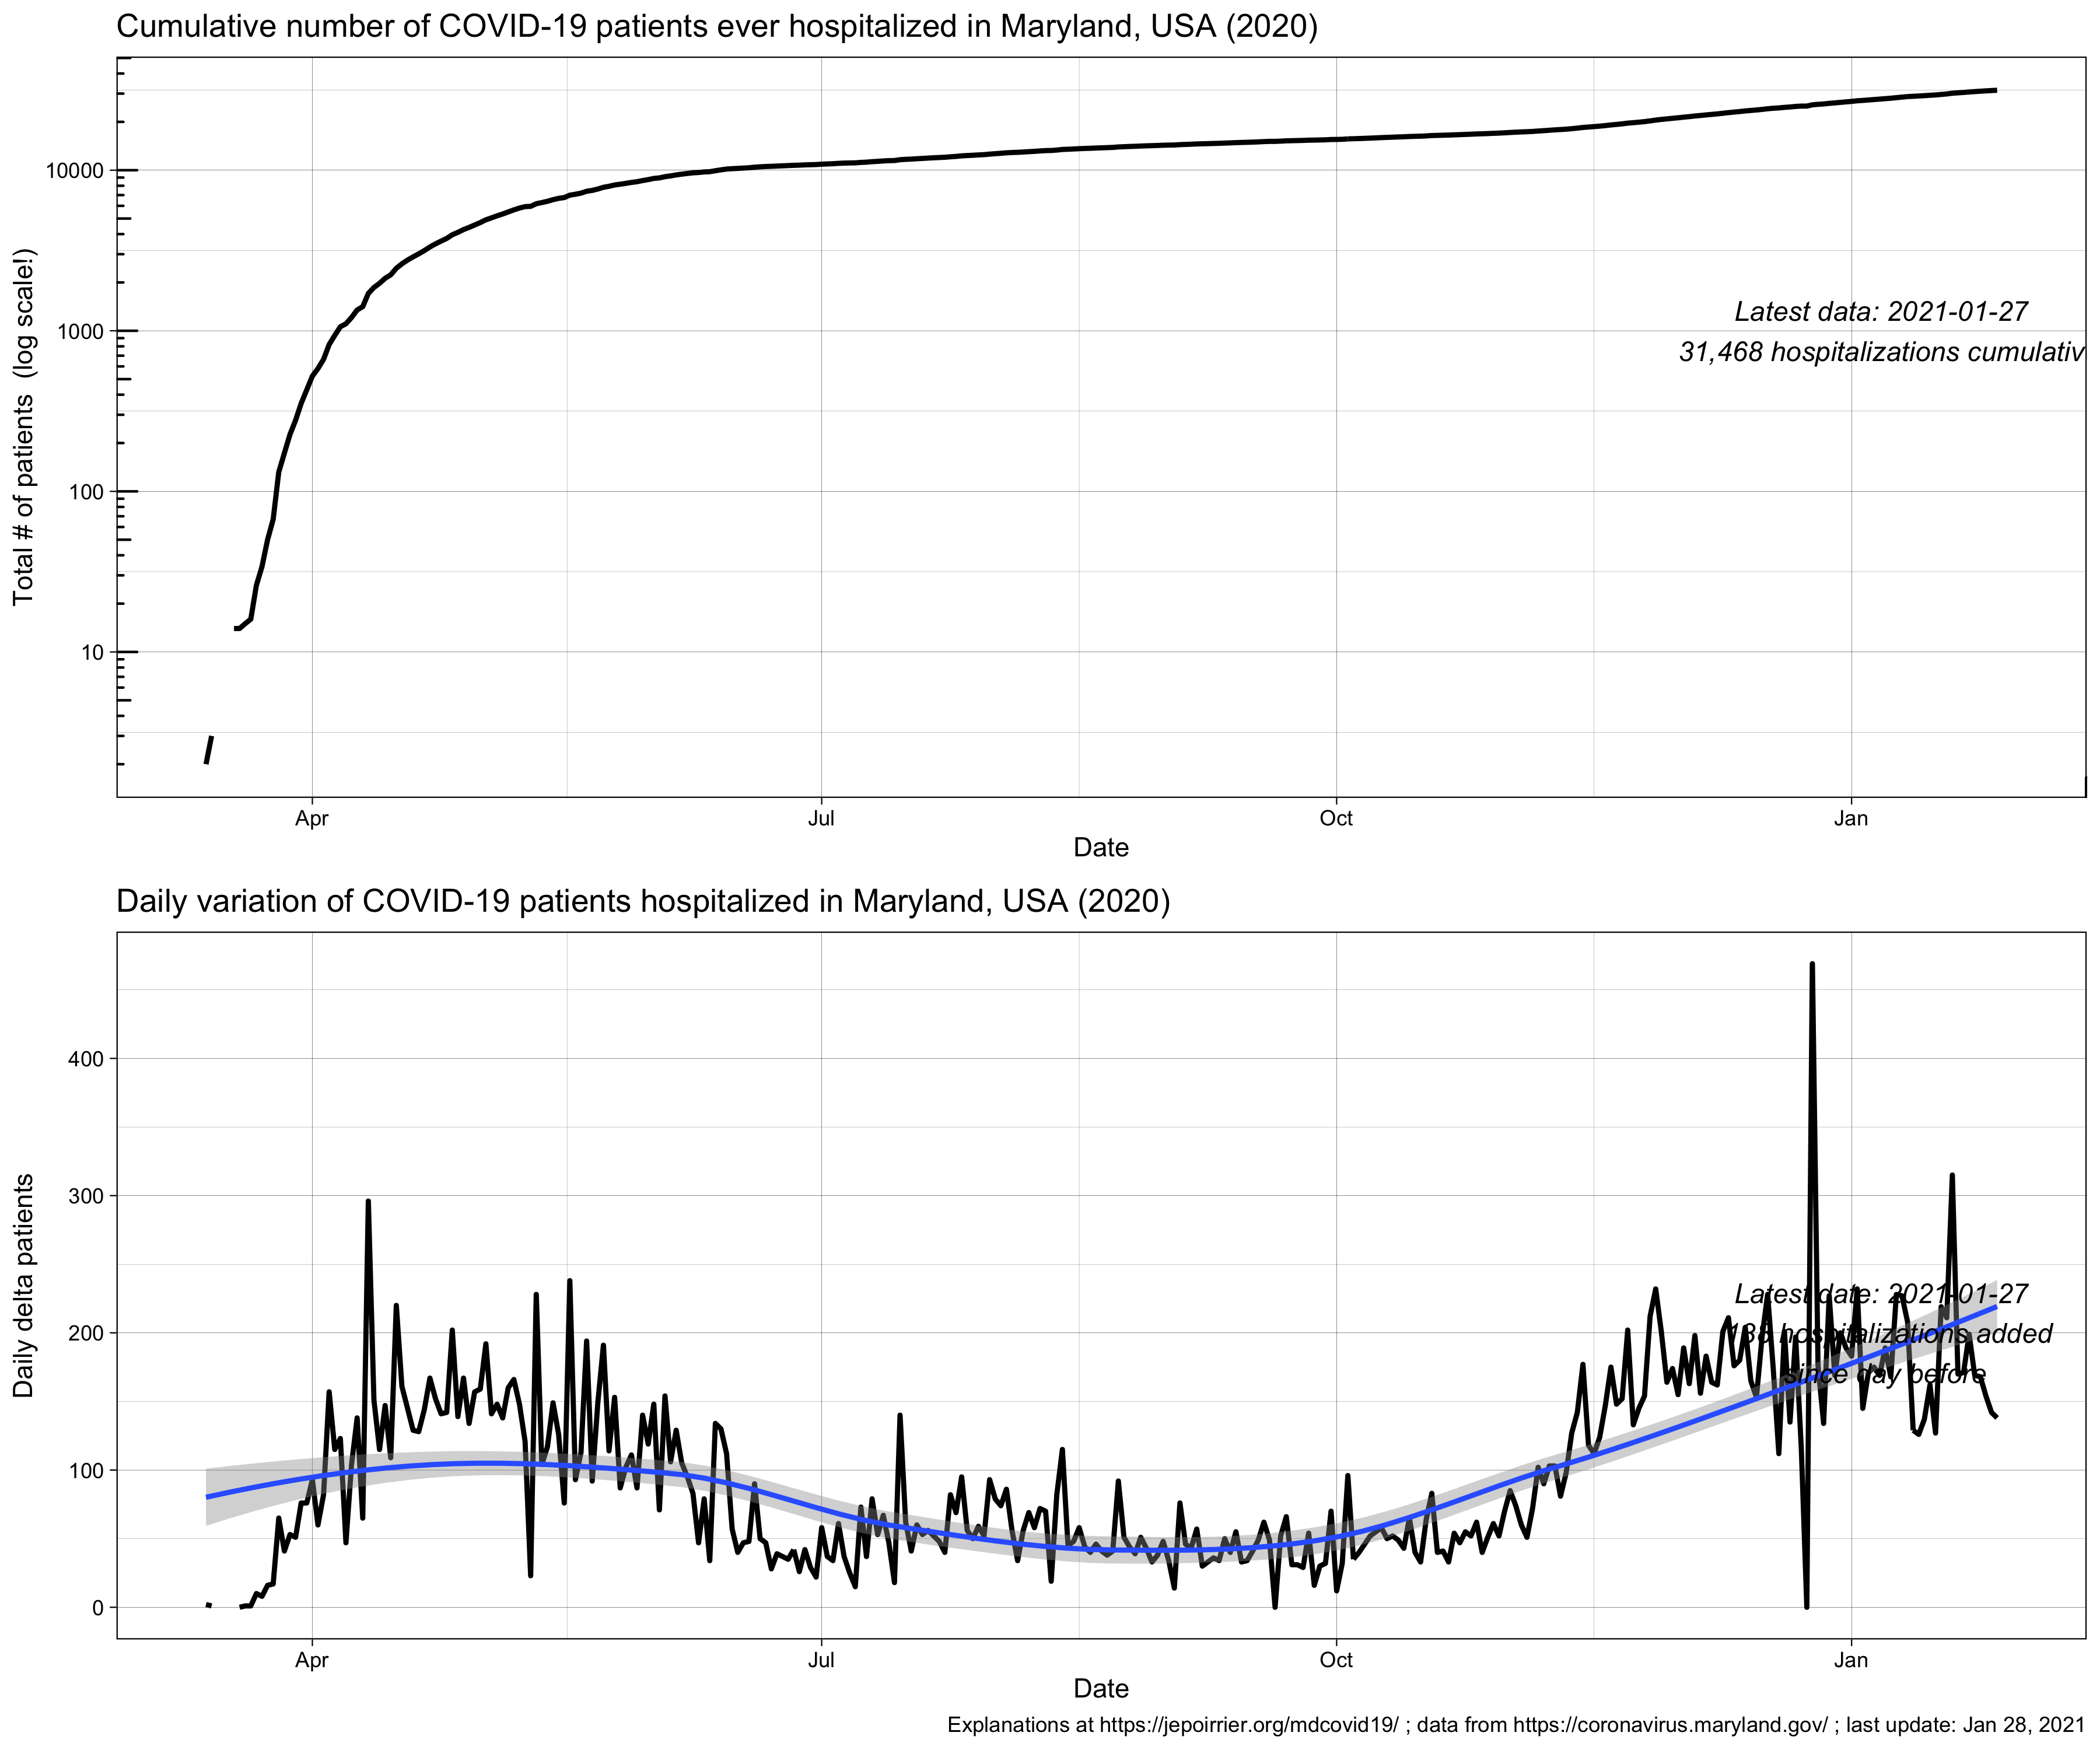
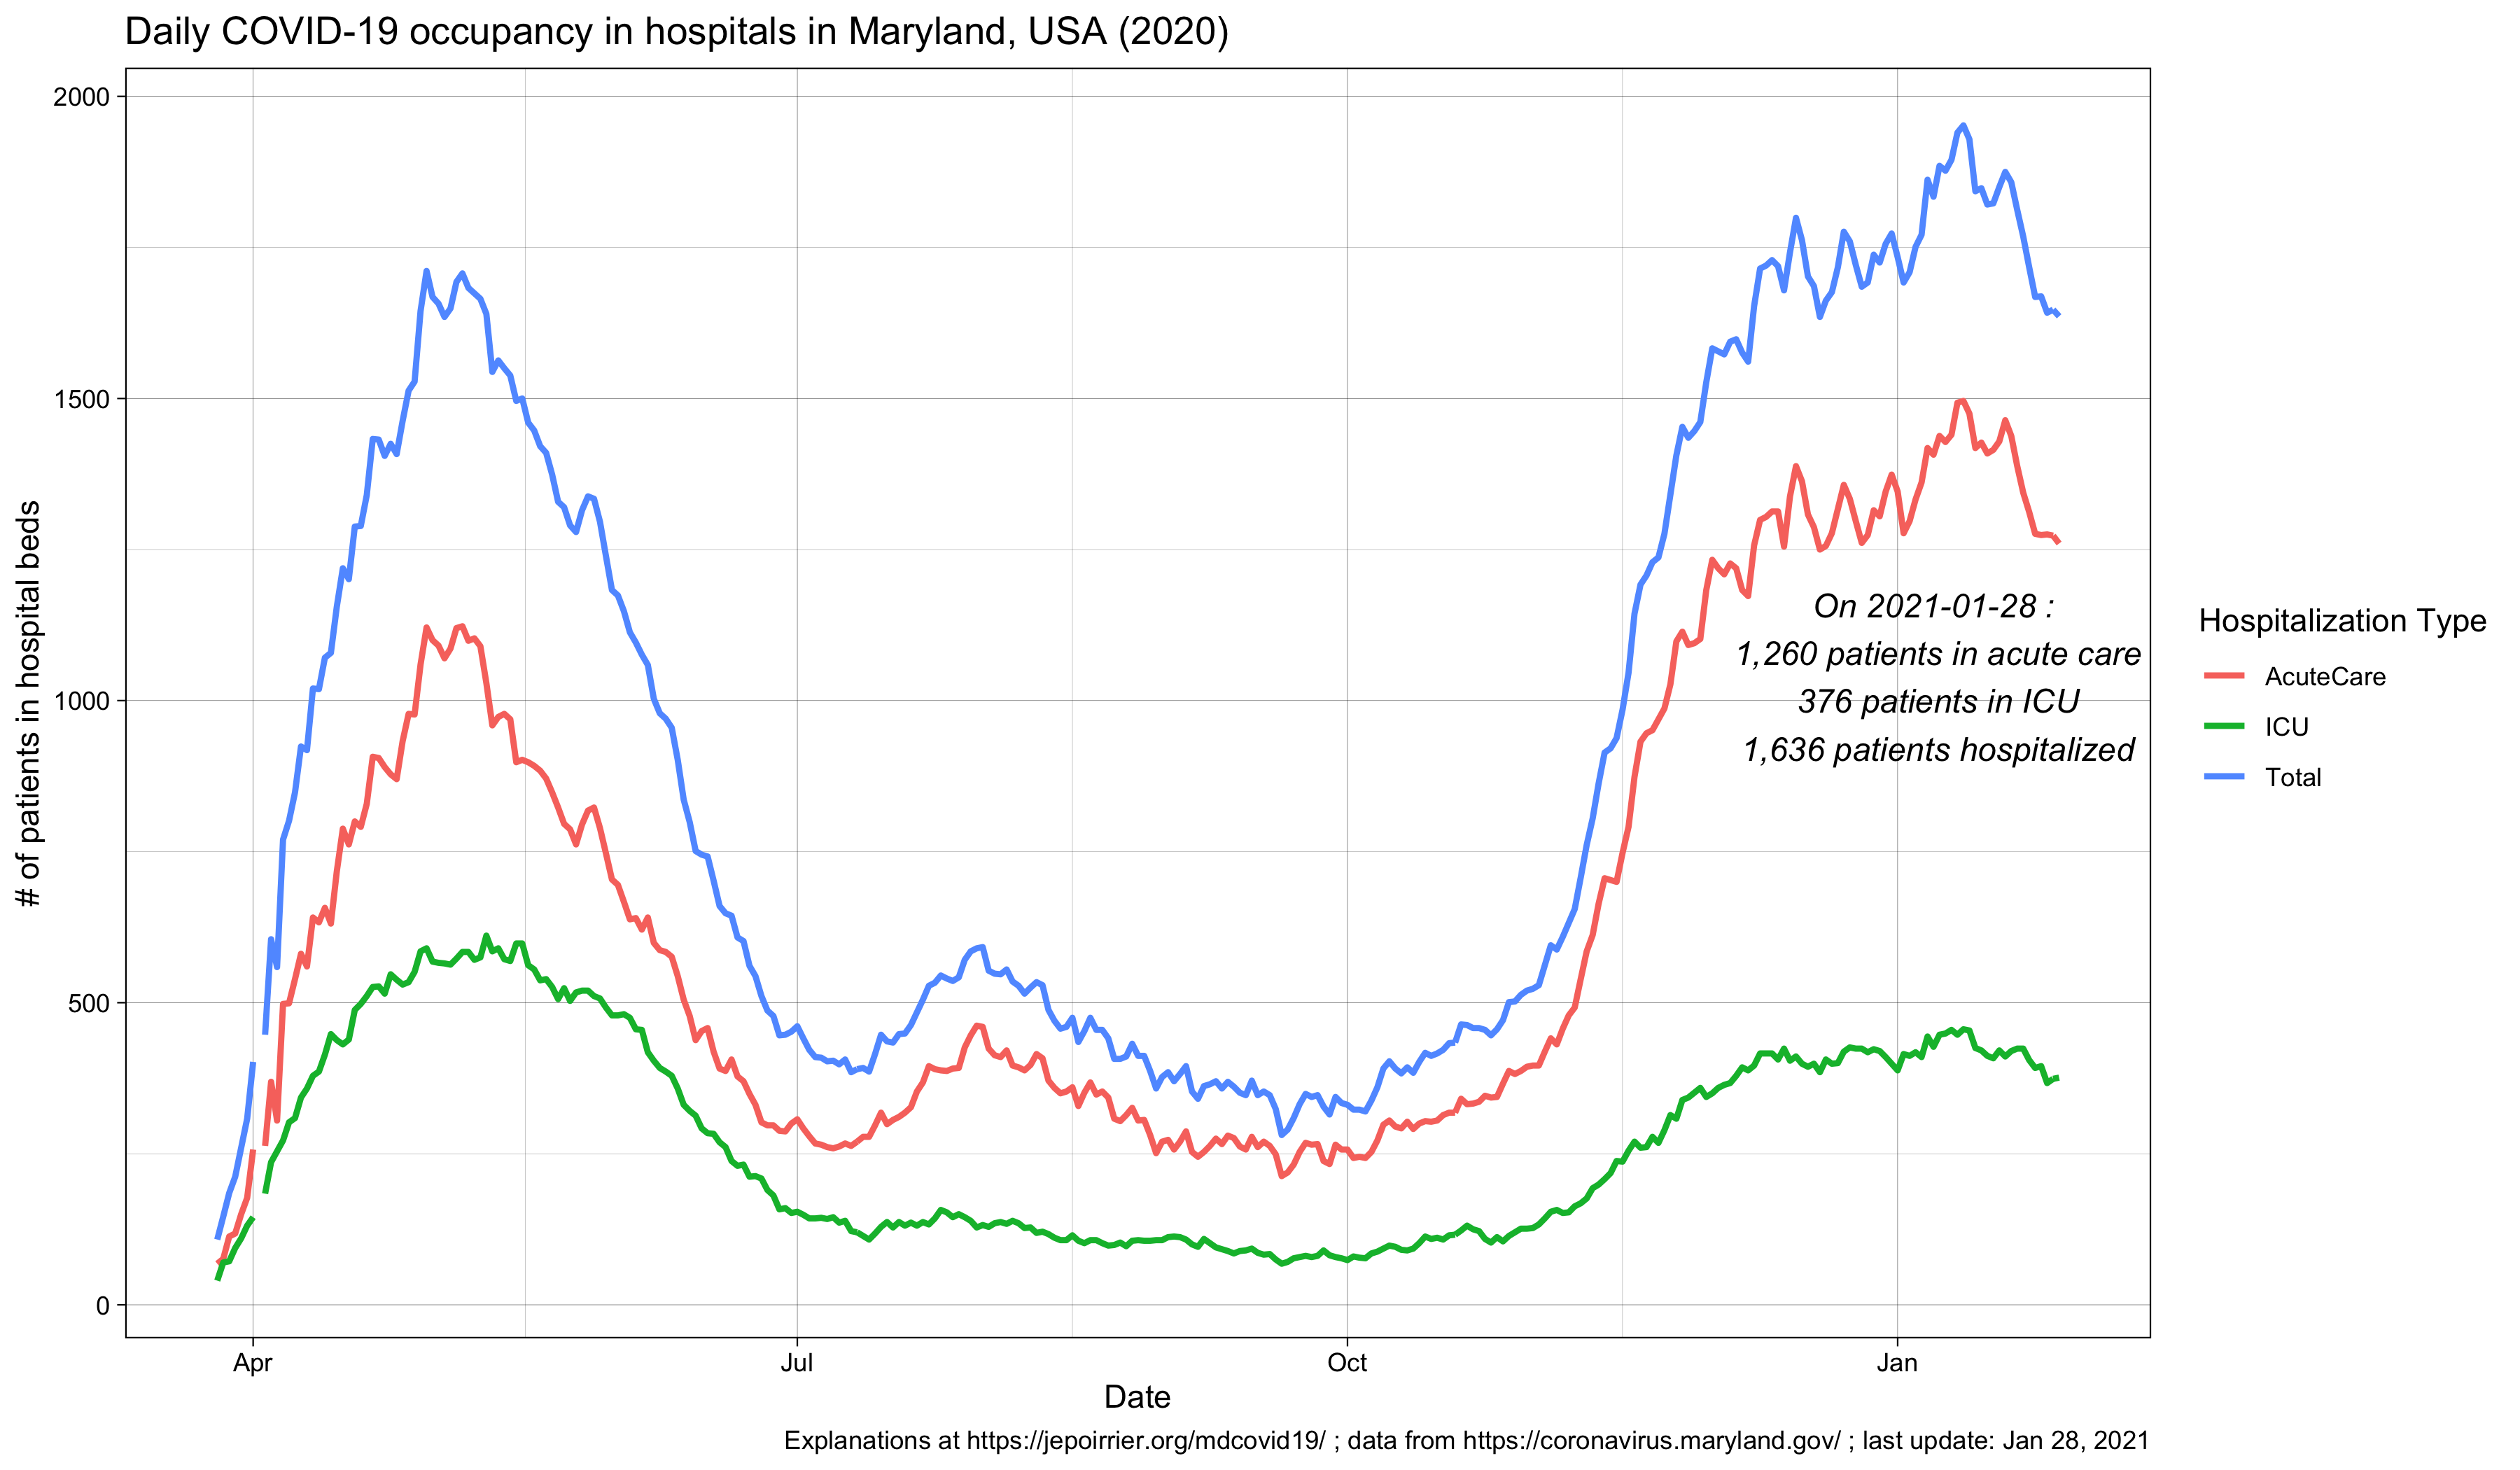
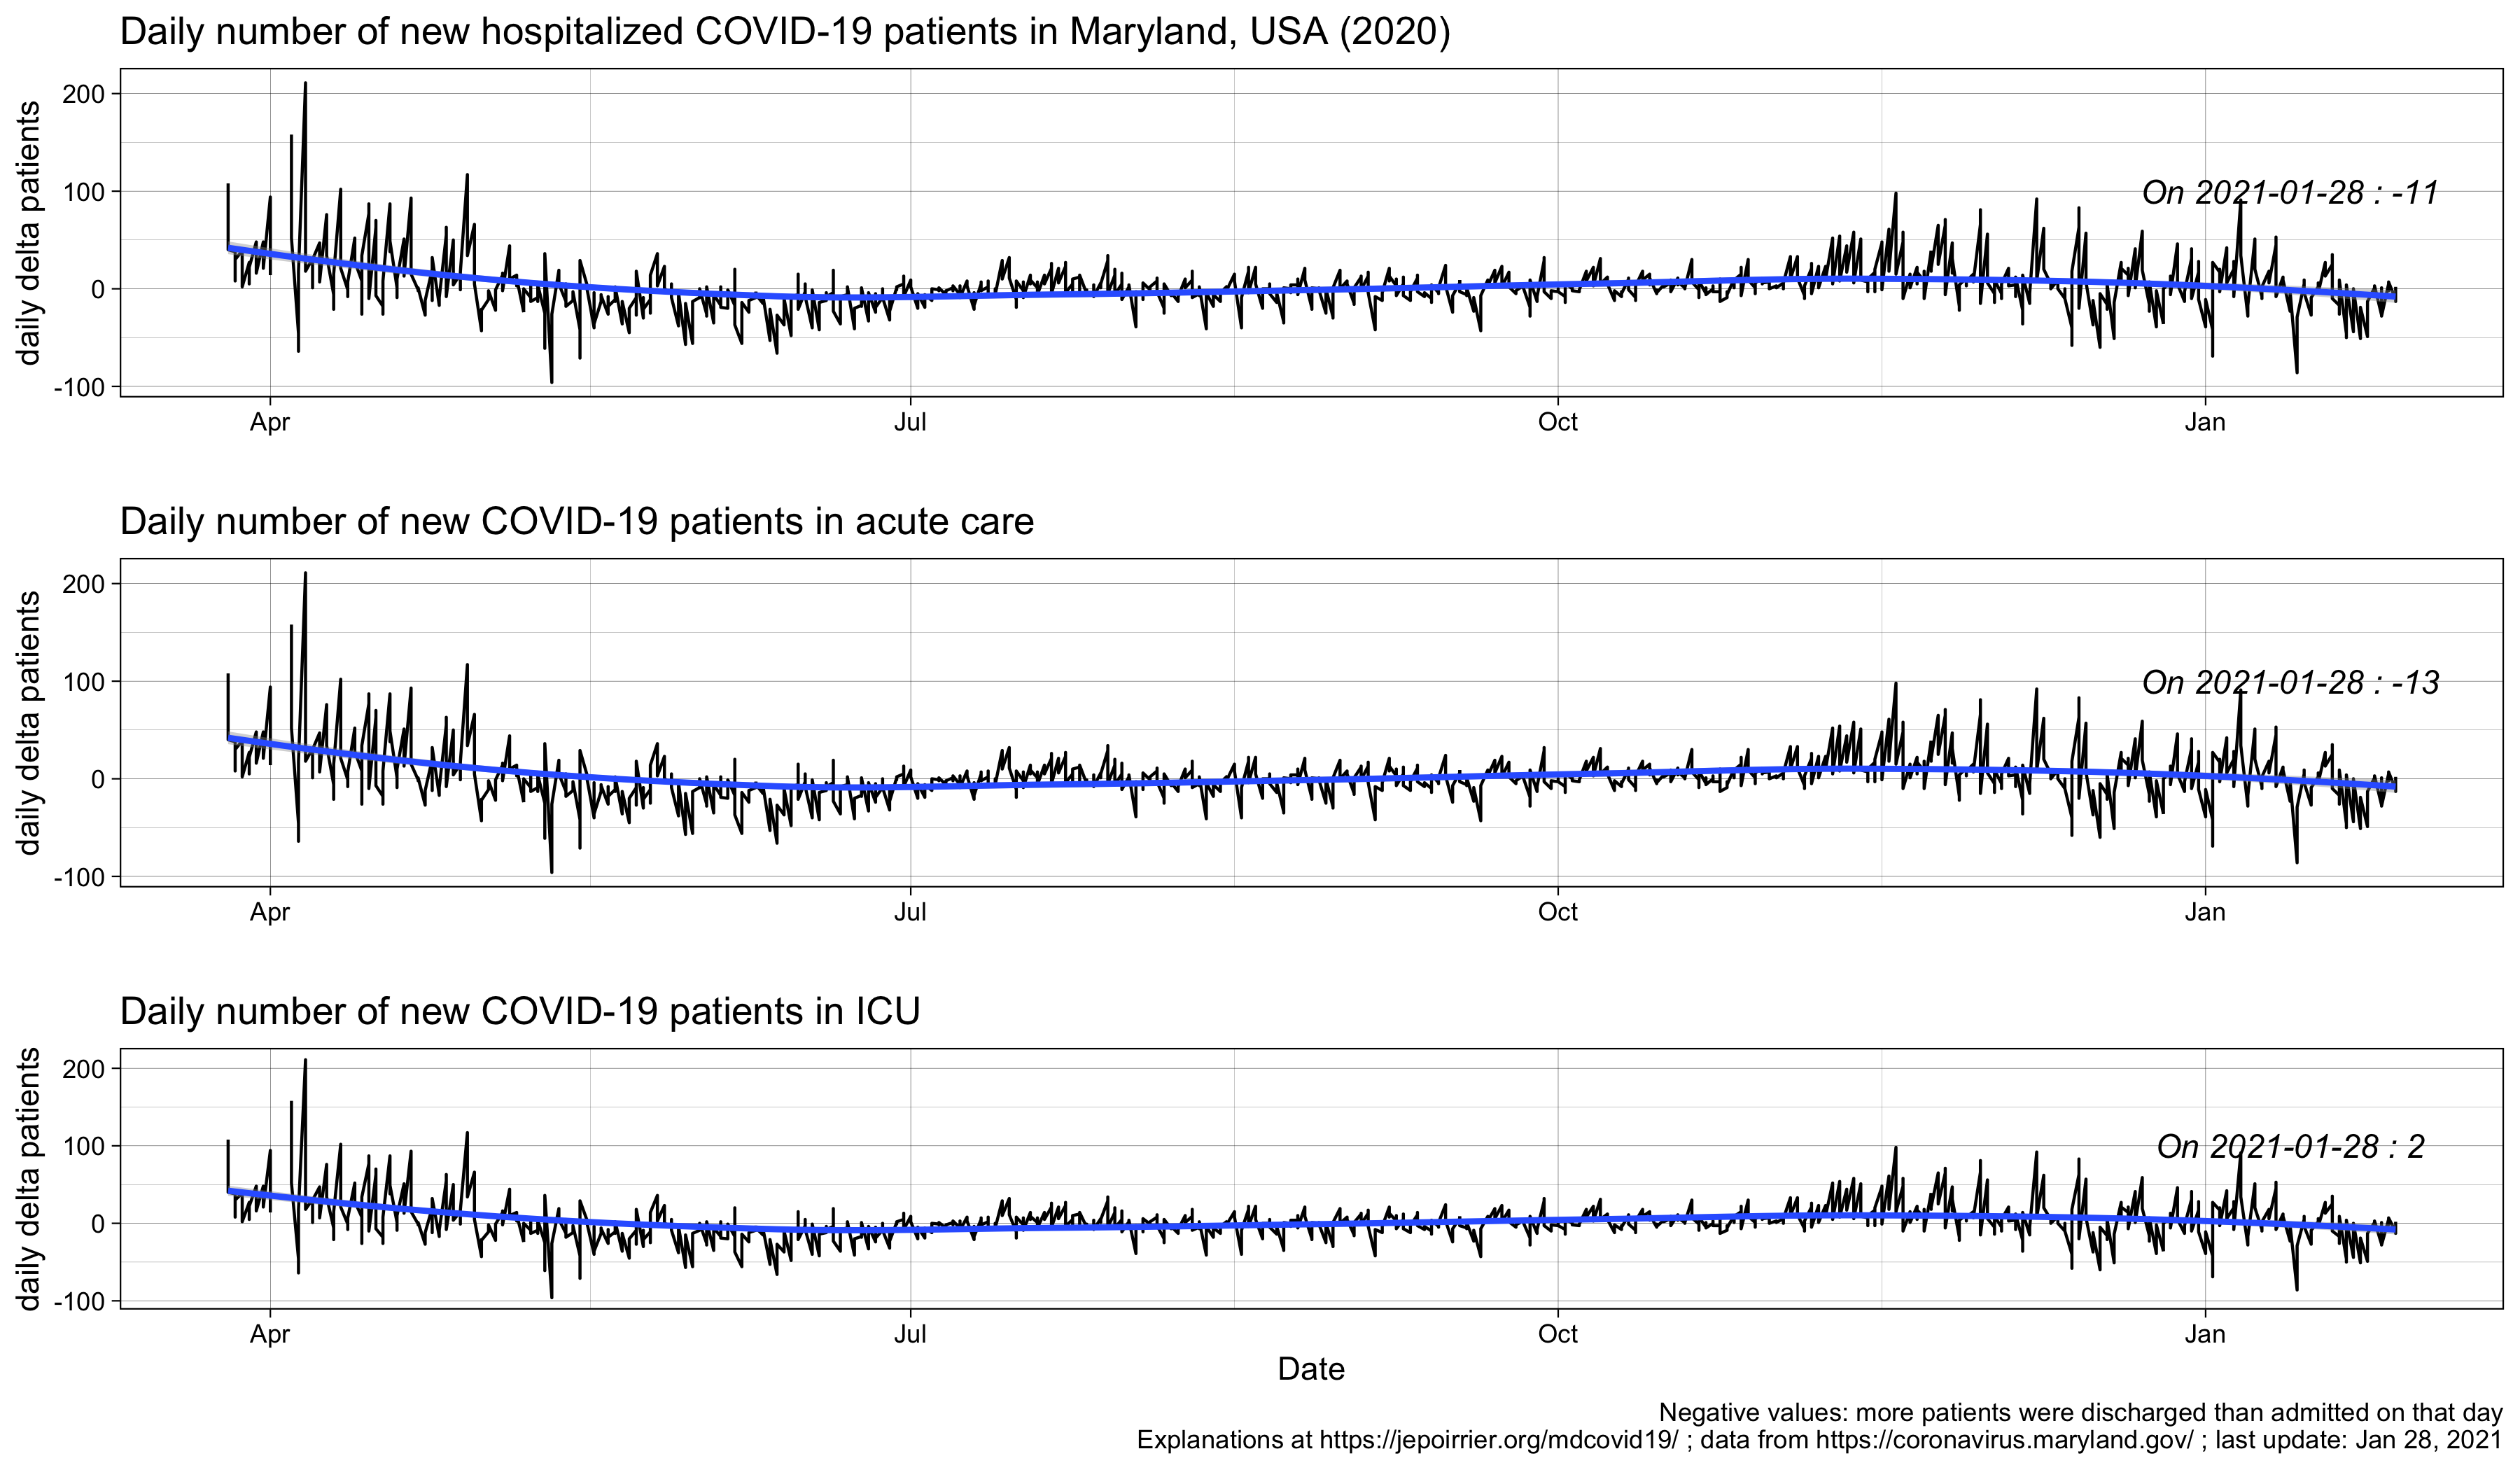
Graphs showing the cumulative and daily evolution of COVID-19 hospitalizations in Maryland. Since there is no data about average length of stay (in Maryland) or cumulative releases from hospital, one can’t calculate the number of patients currently in hospital (but see below).Graph showing the current number of patients in hospital (ICU and Acute Care) on each day. Each number is adding the new admissions and removing the newly released patients. One can’t know just the new admission with this.Daily delta of patients hospitalized for COVID-19 in Maryland. This mixes new admissions and new releases. In general, if the number is negative, it’s a good sign: there are more releases than admissions.
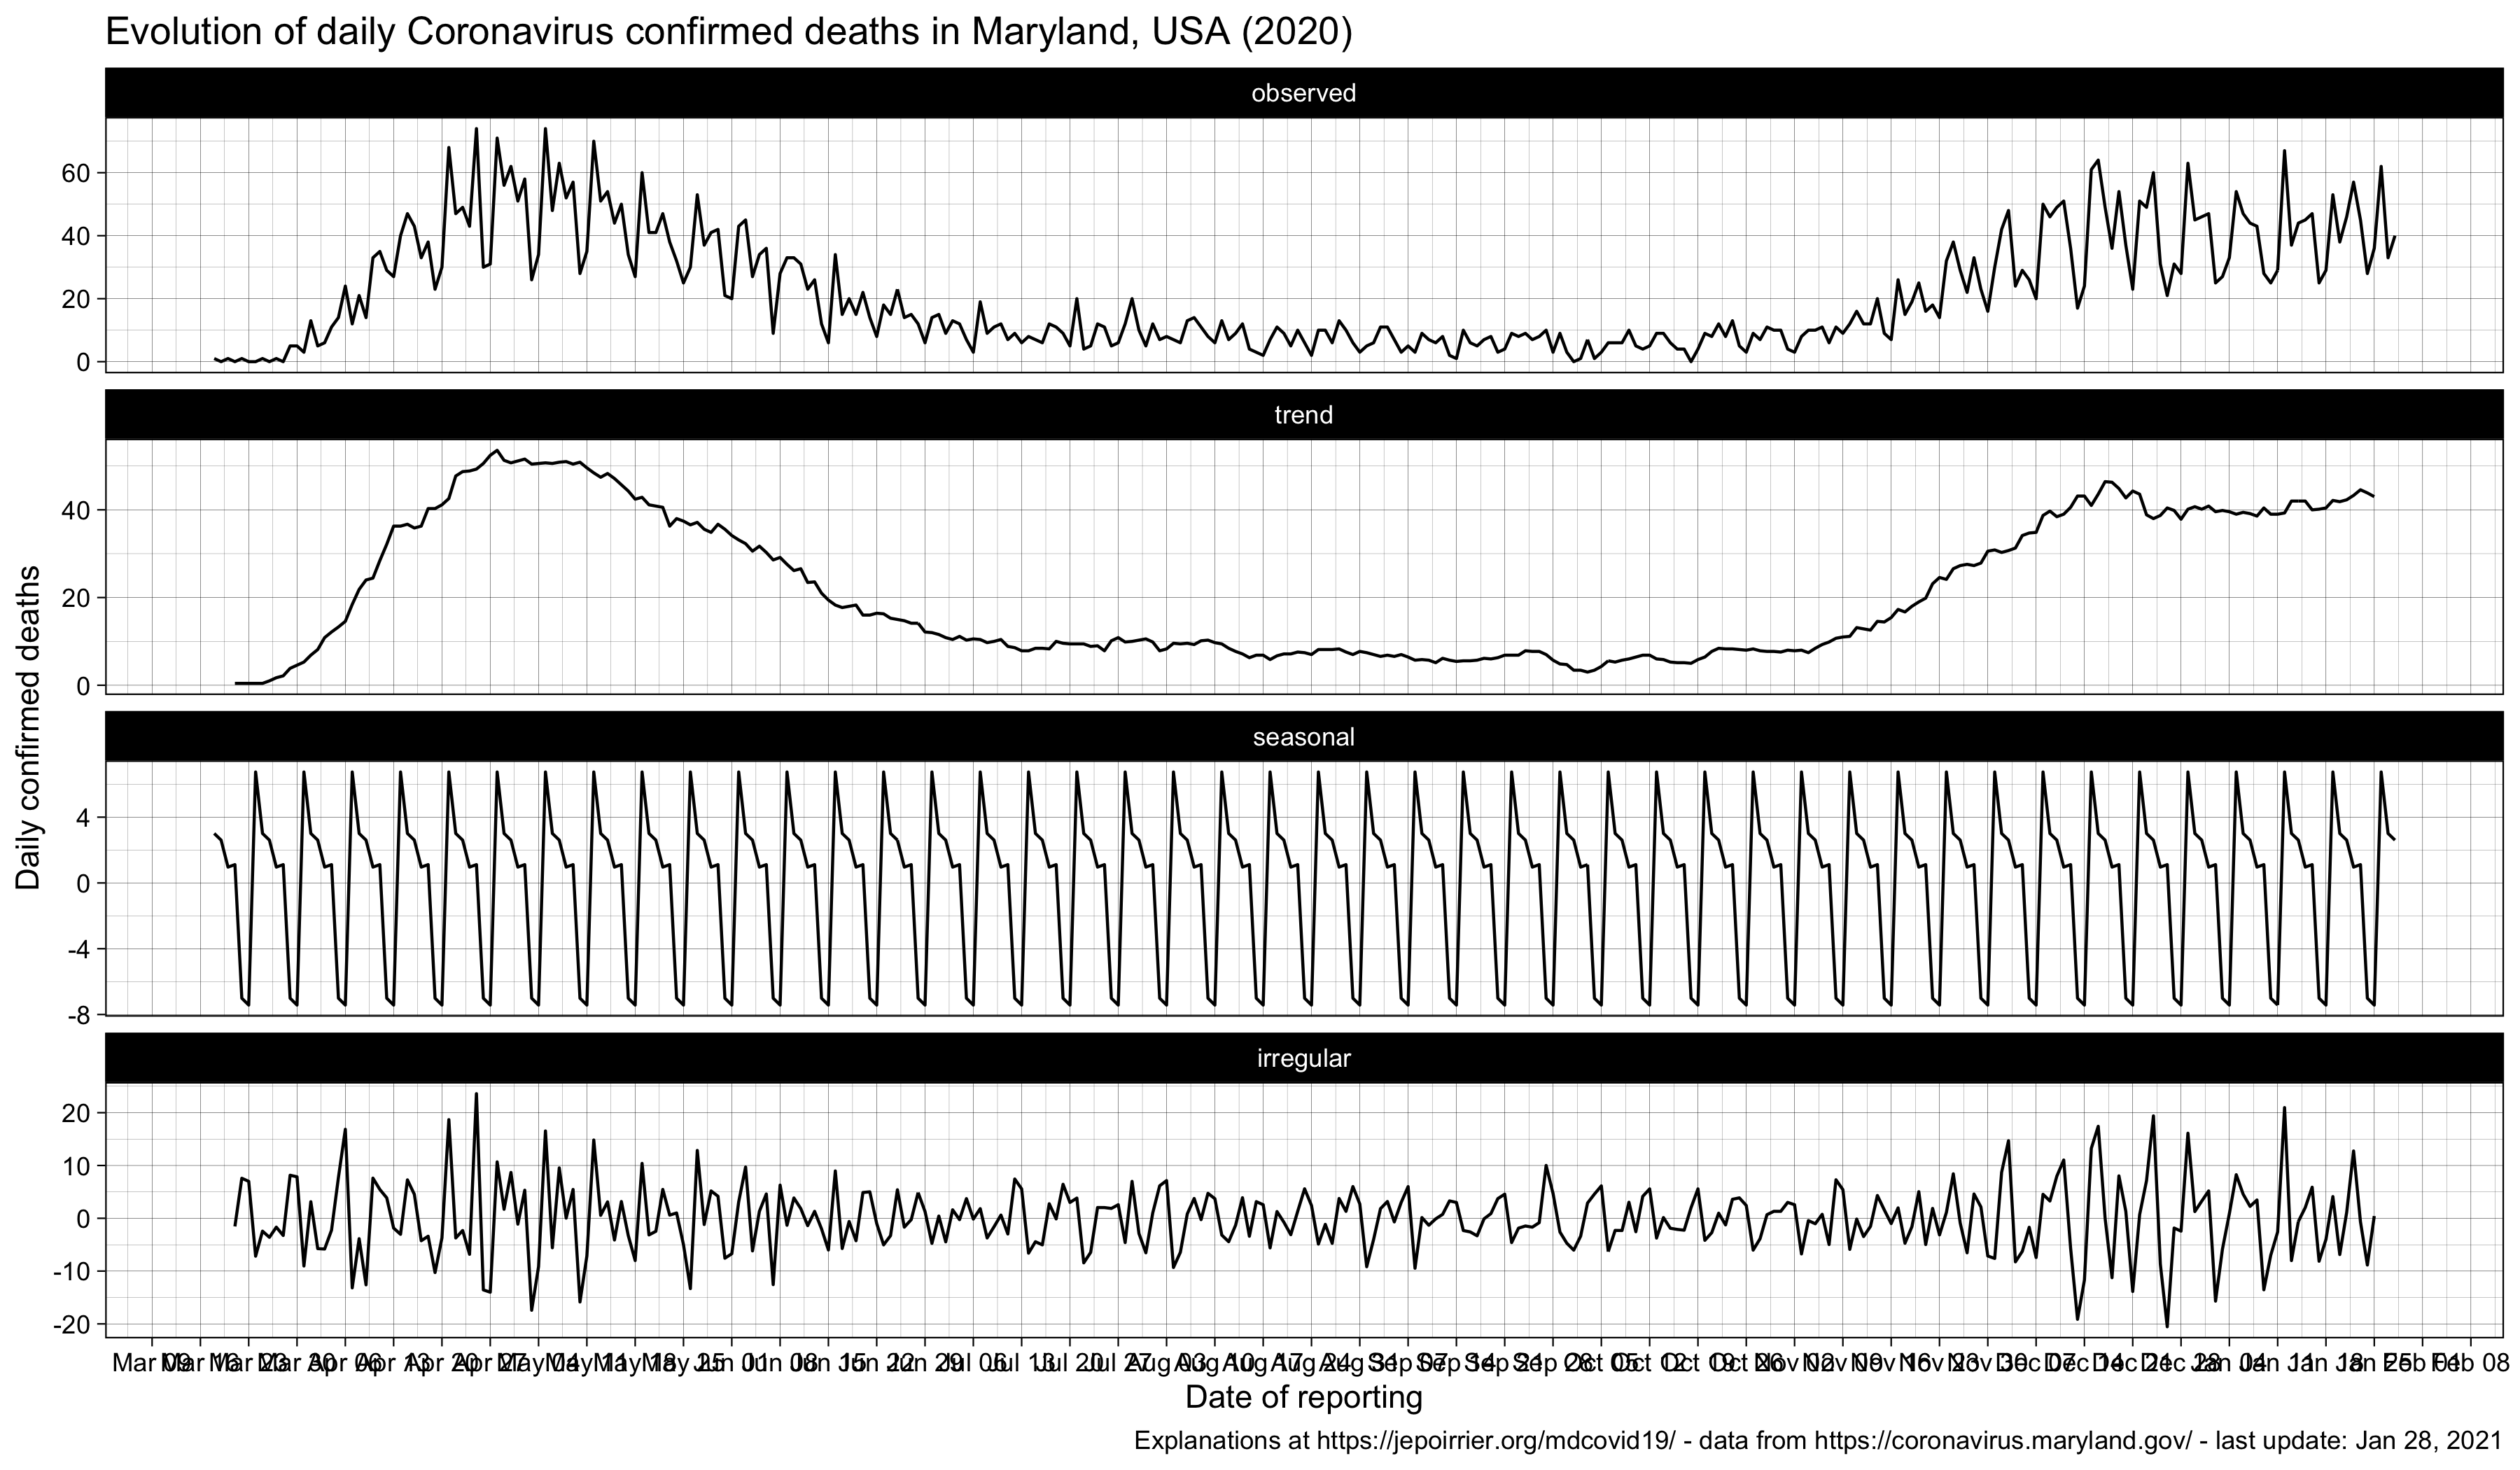
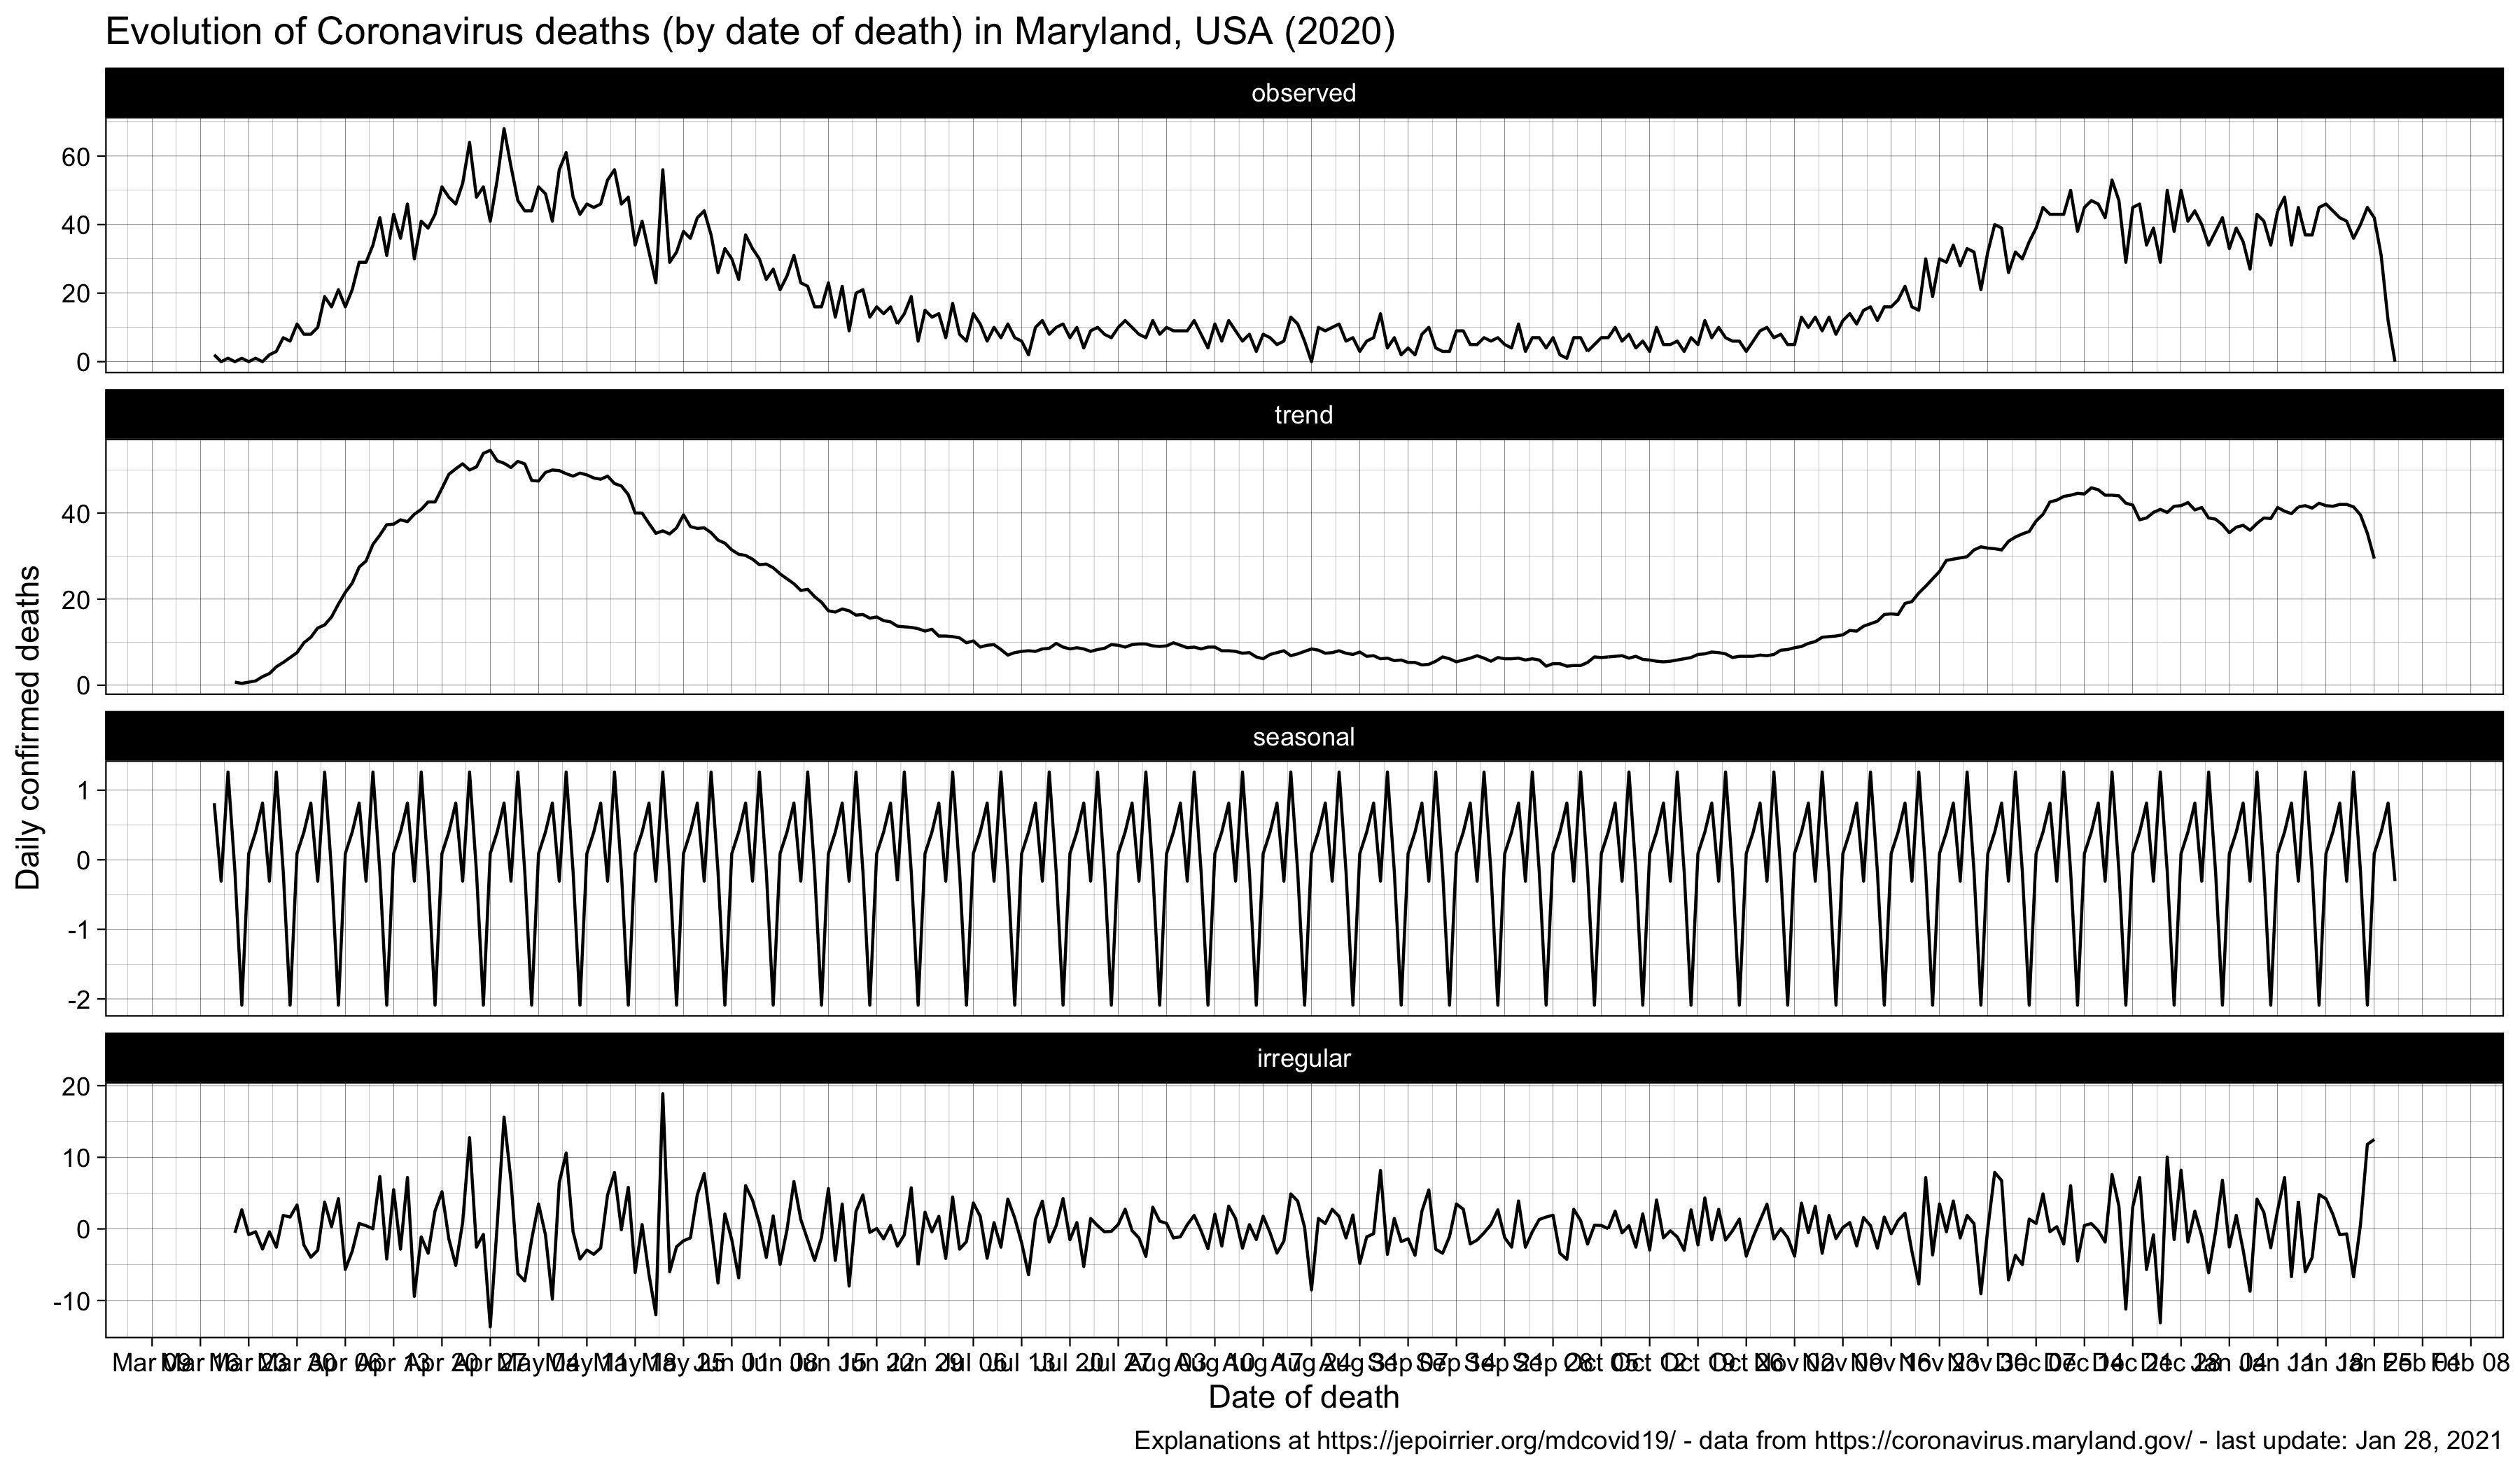
Deaths
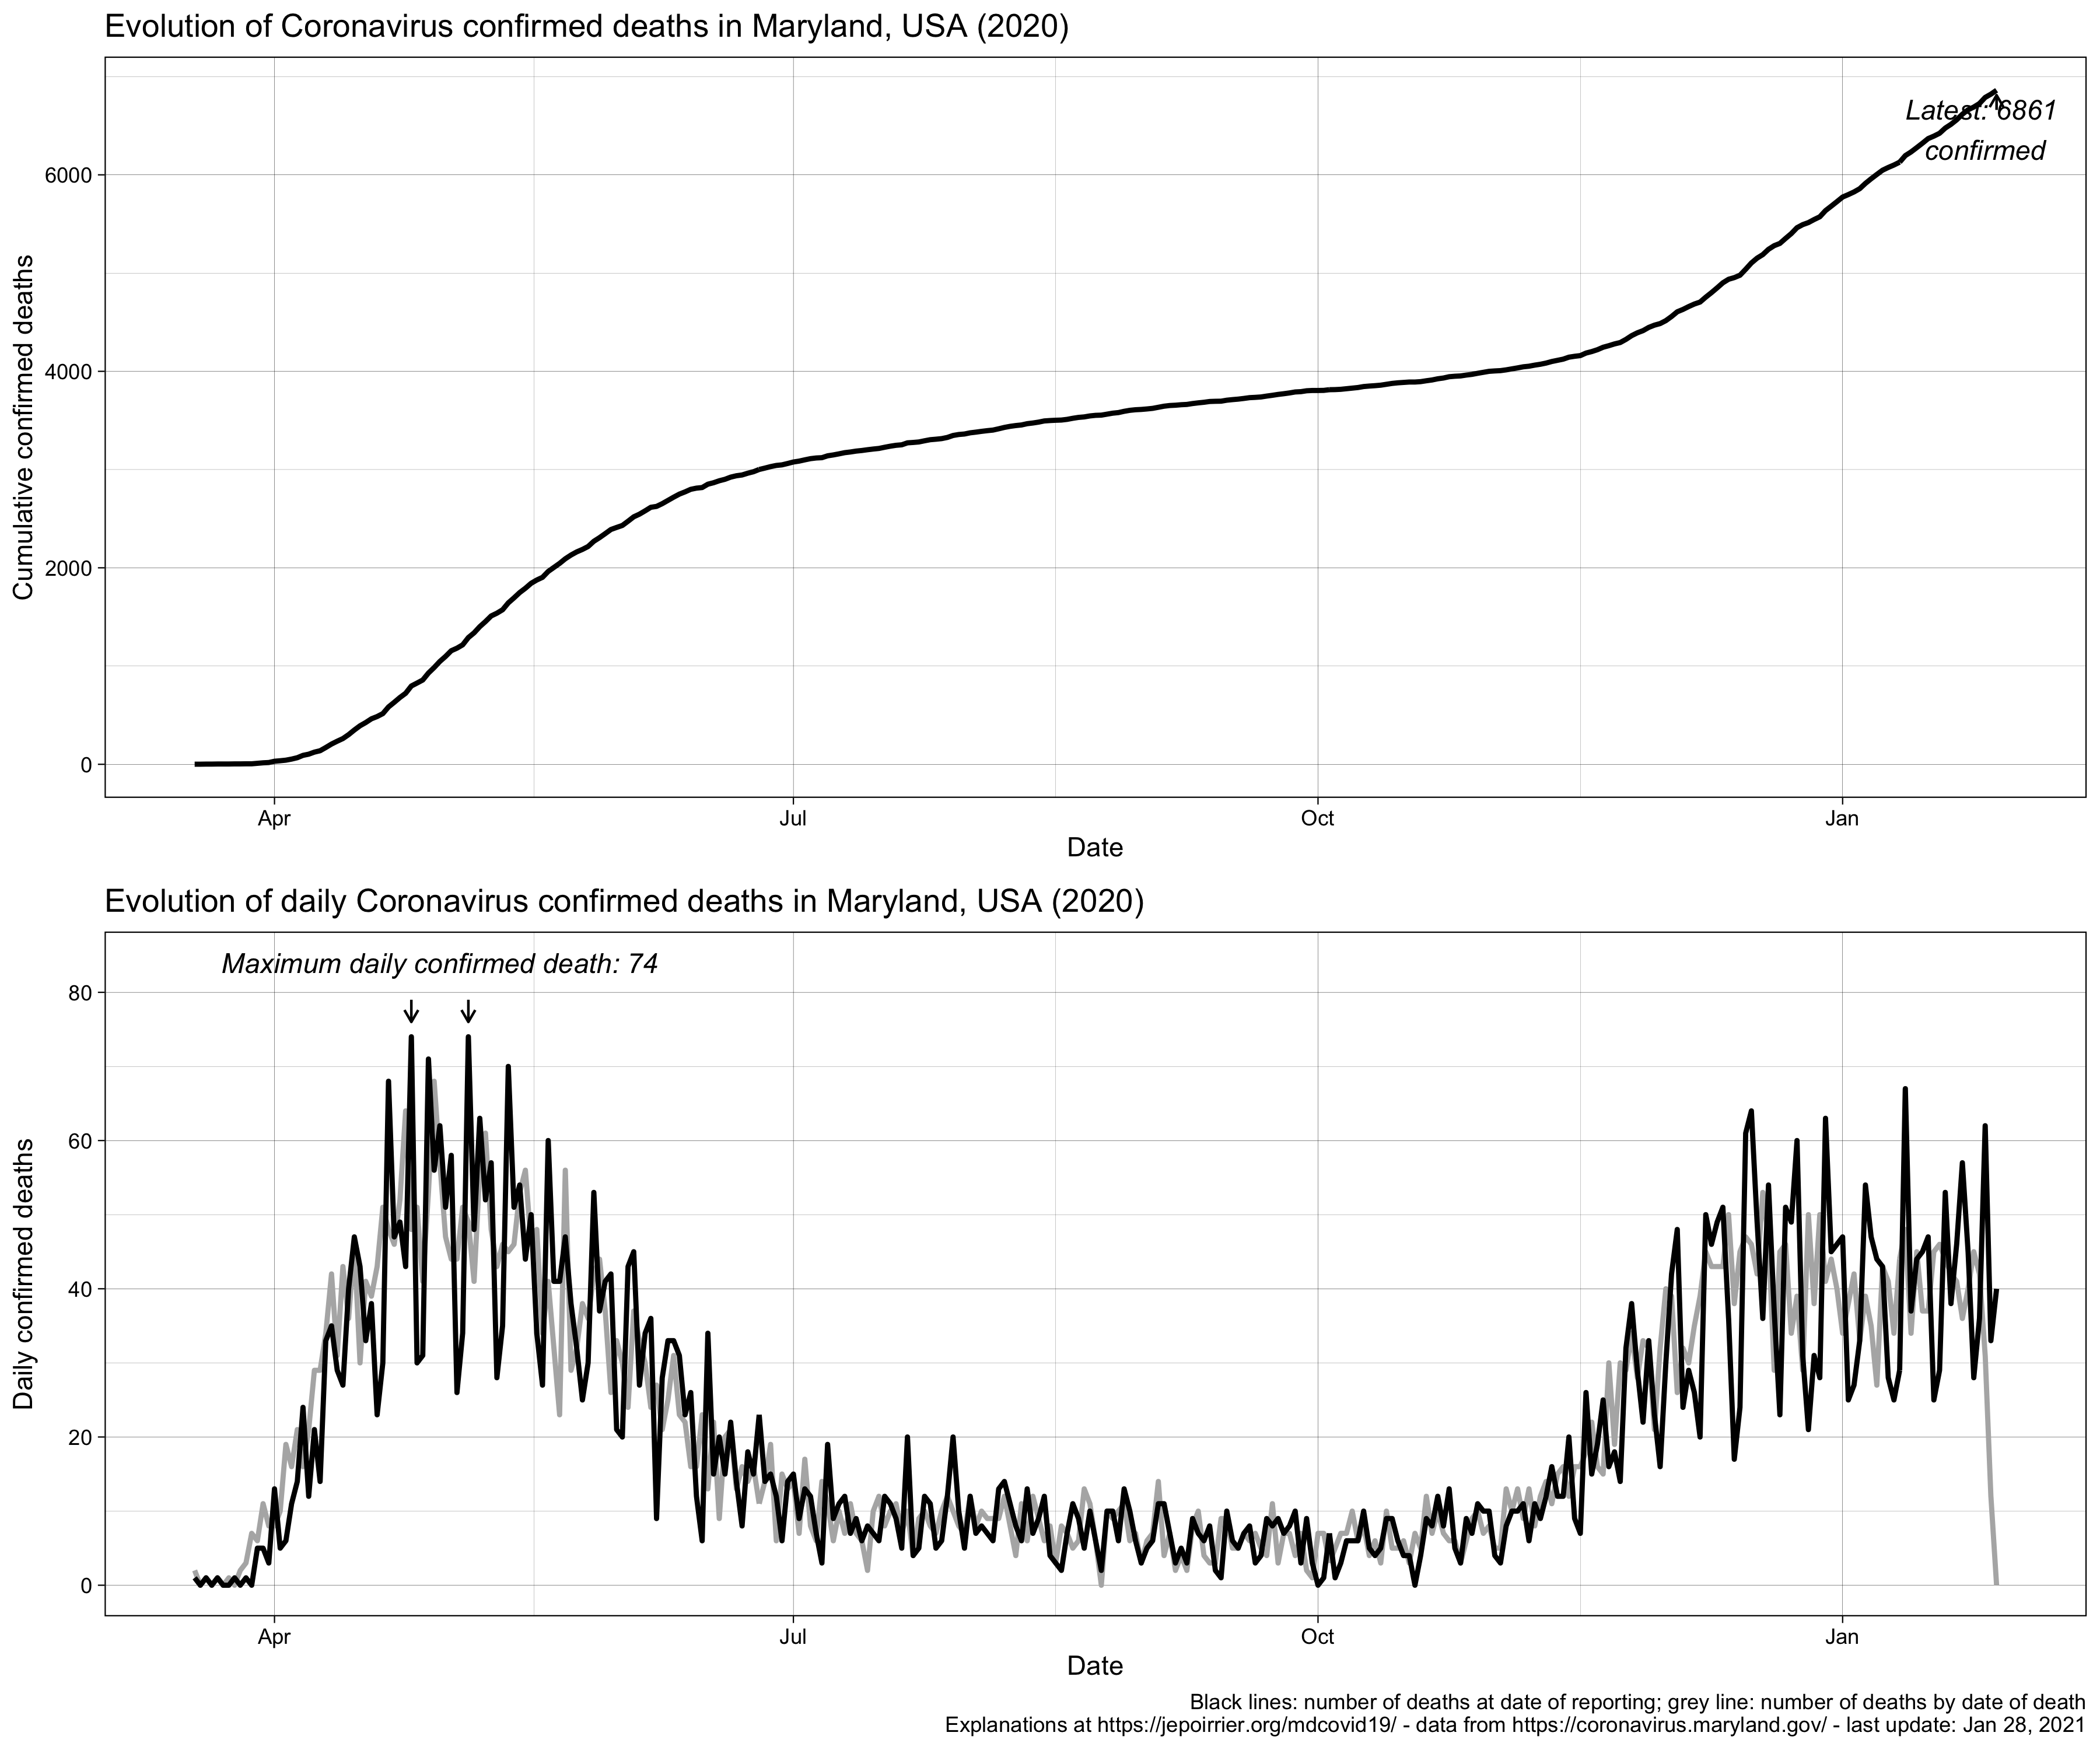
Graphs showing the cumulative and daily evolution of COVID-19 deaths in Maryland. The 2 lines at the bottom correspond to the 2 reporting systems for deaths. Trends seem to be similar.Graphs showing the temporal decomposition of death (by date of report). It separates the trend from the (small) weekly pattern (see ‘seasonal’ vs ‘pattern’).Graphs showing the temporal decomposition of death (by date of death). It separates the trend from the (small) weekly pattern (see ‘seasonal’ vs ‘pattern’).
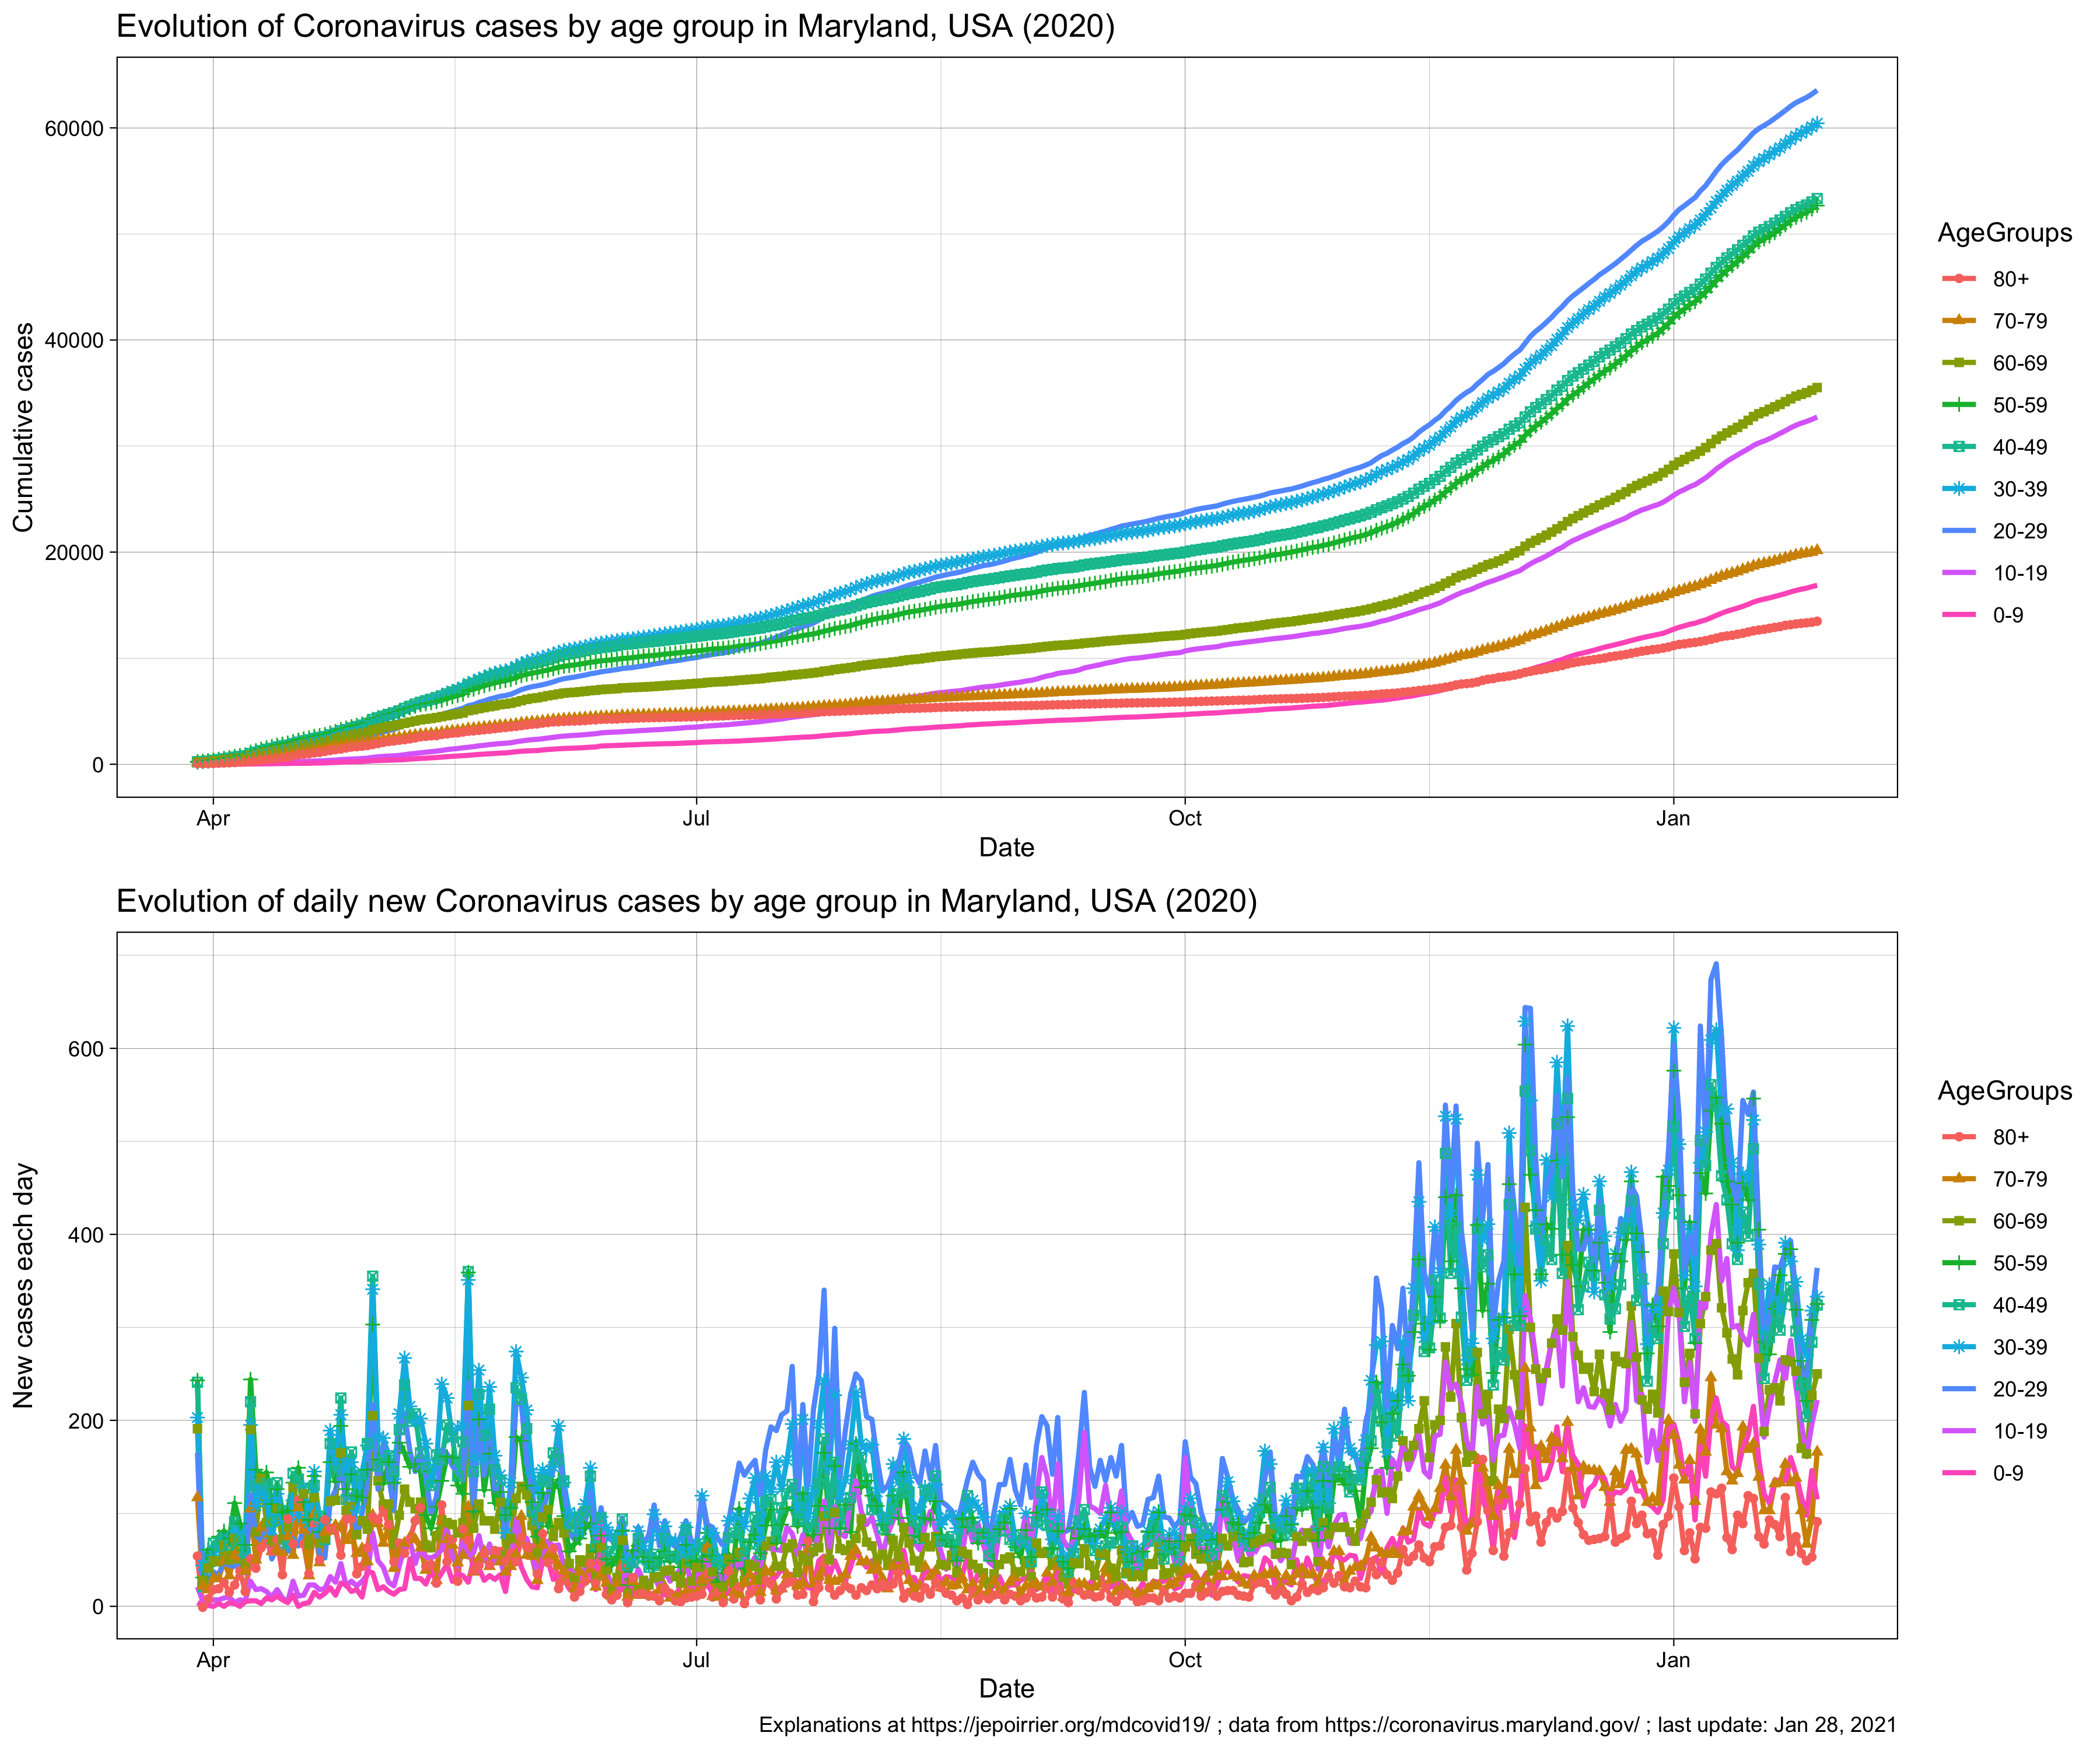
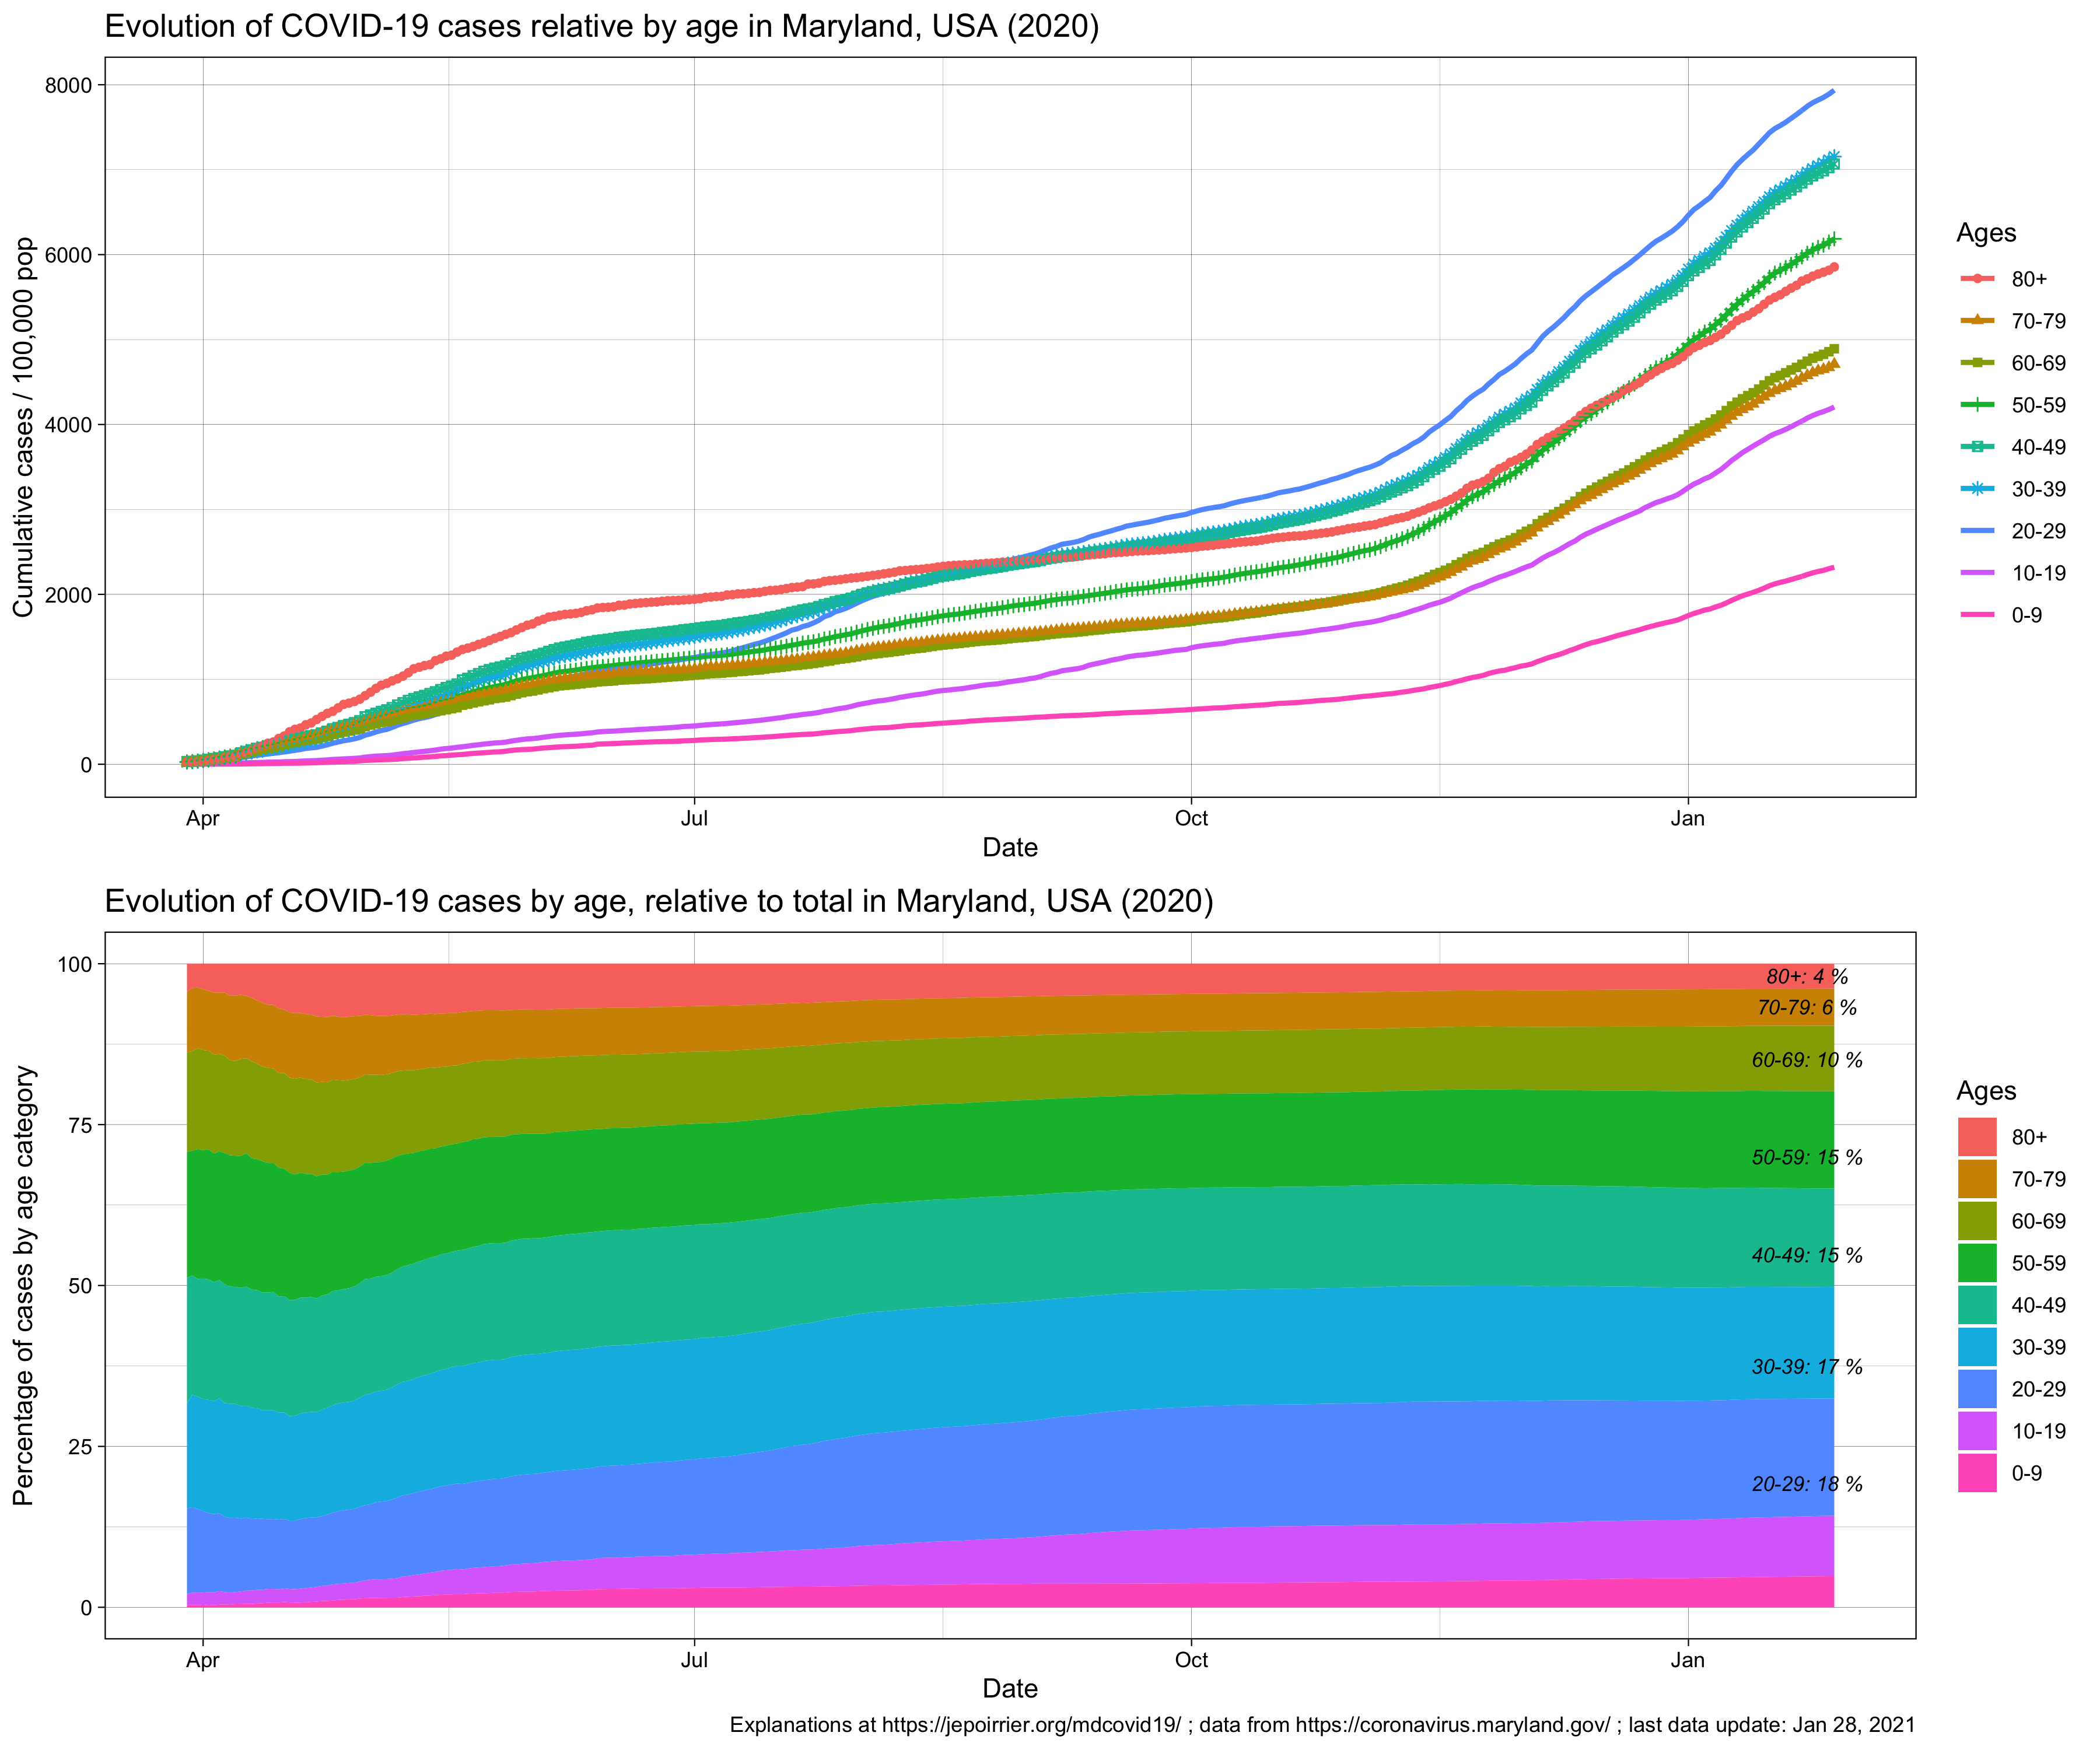
Age
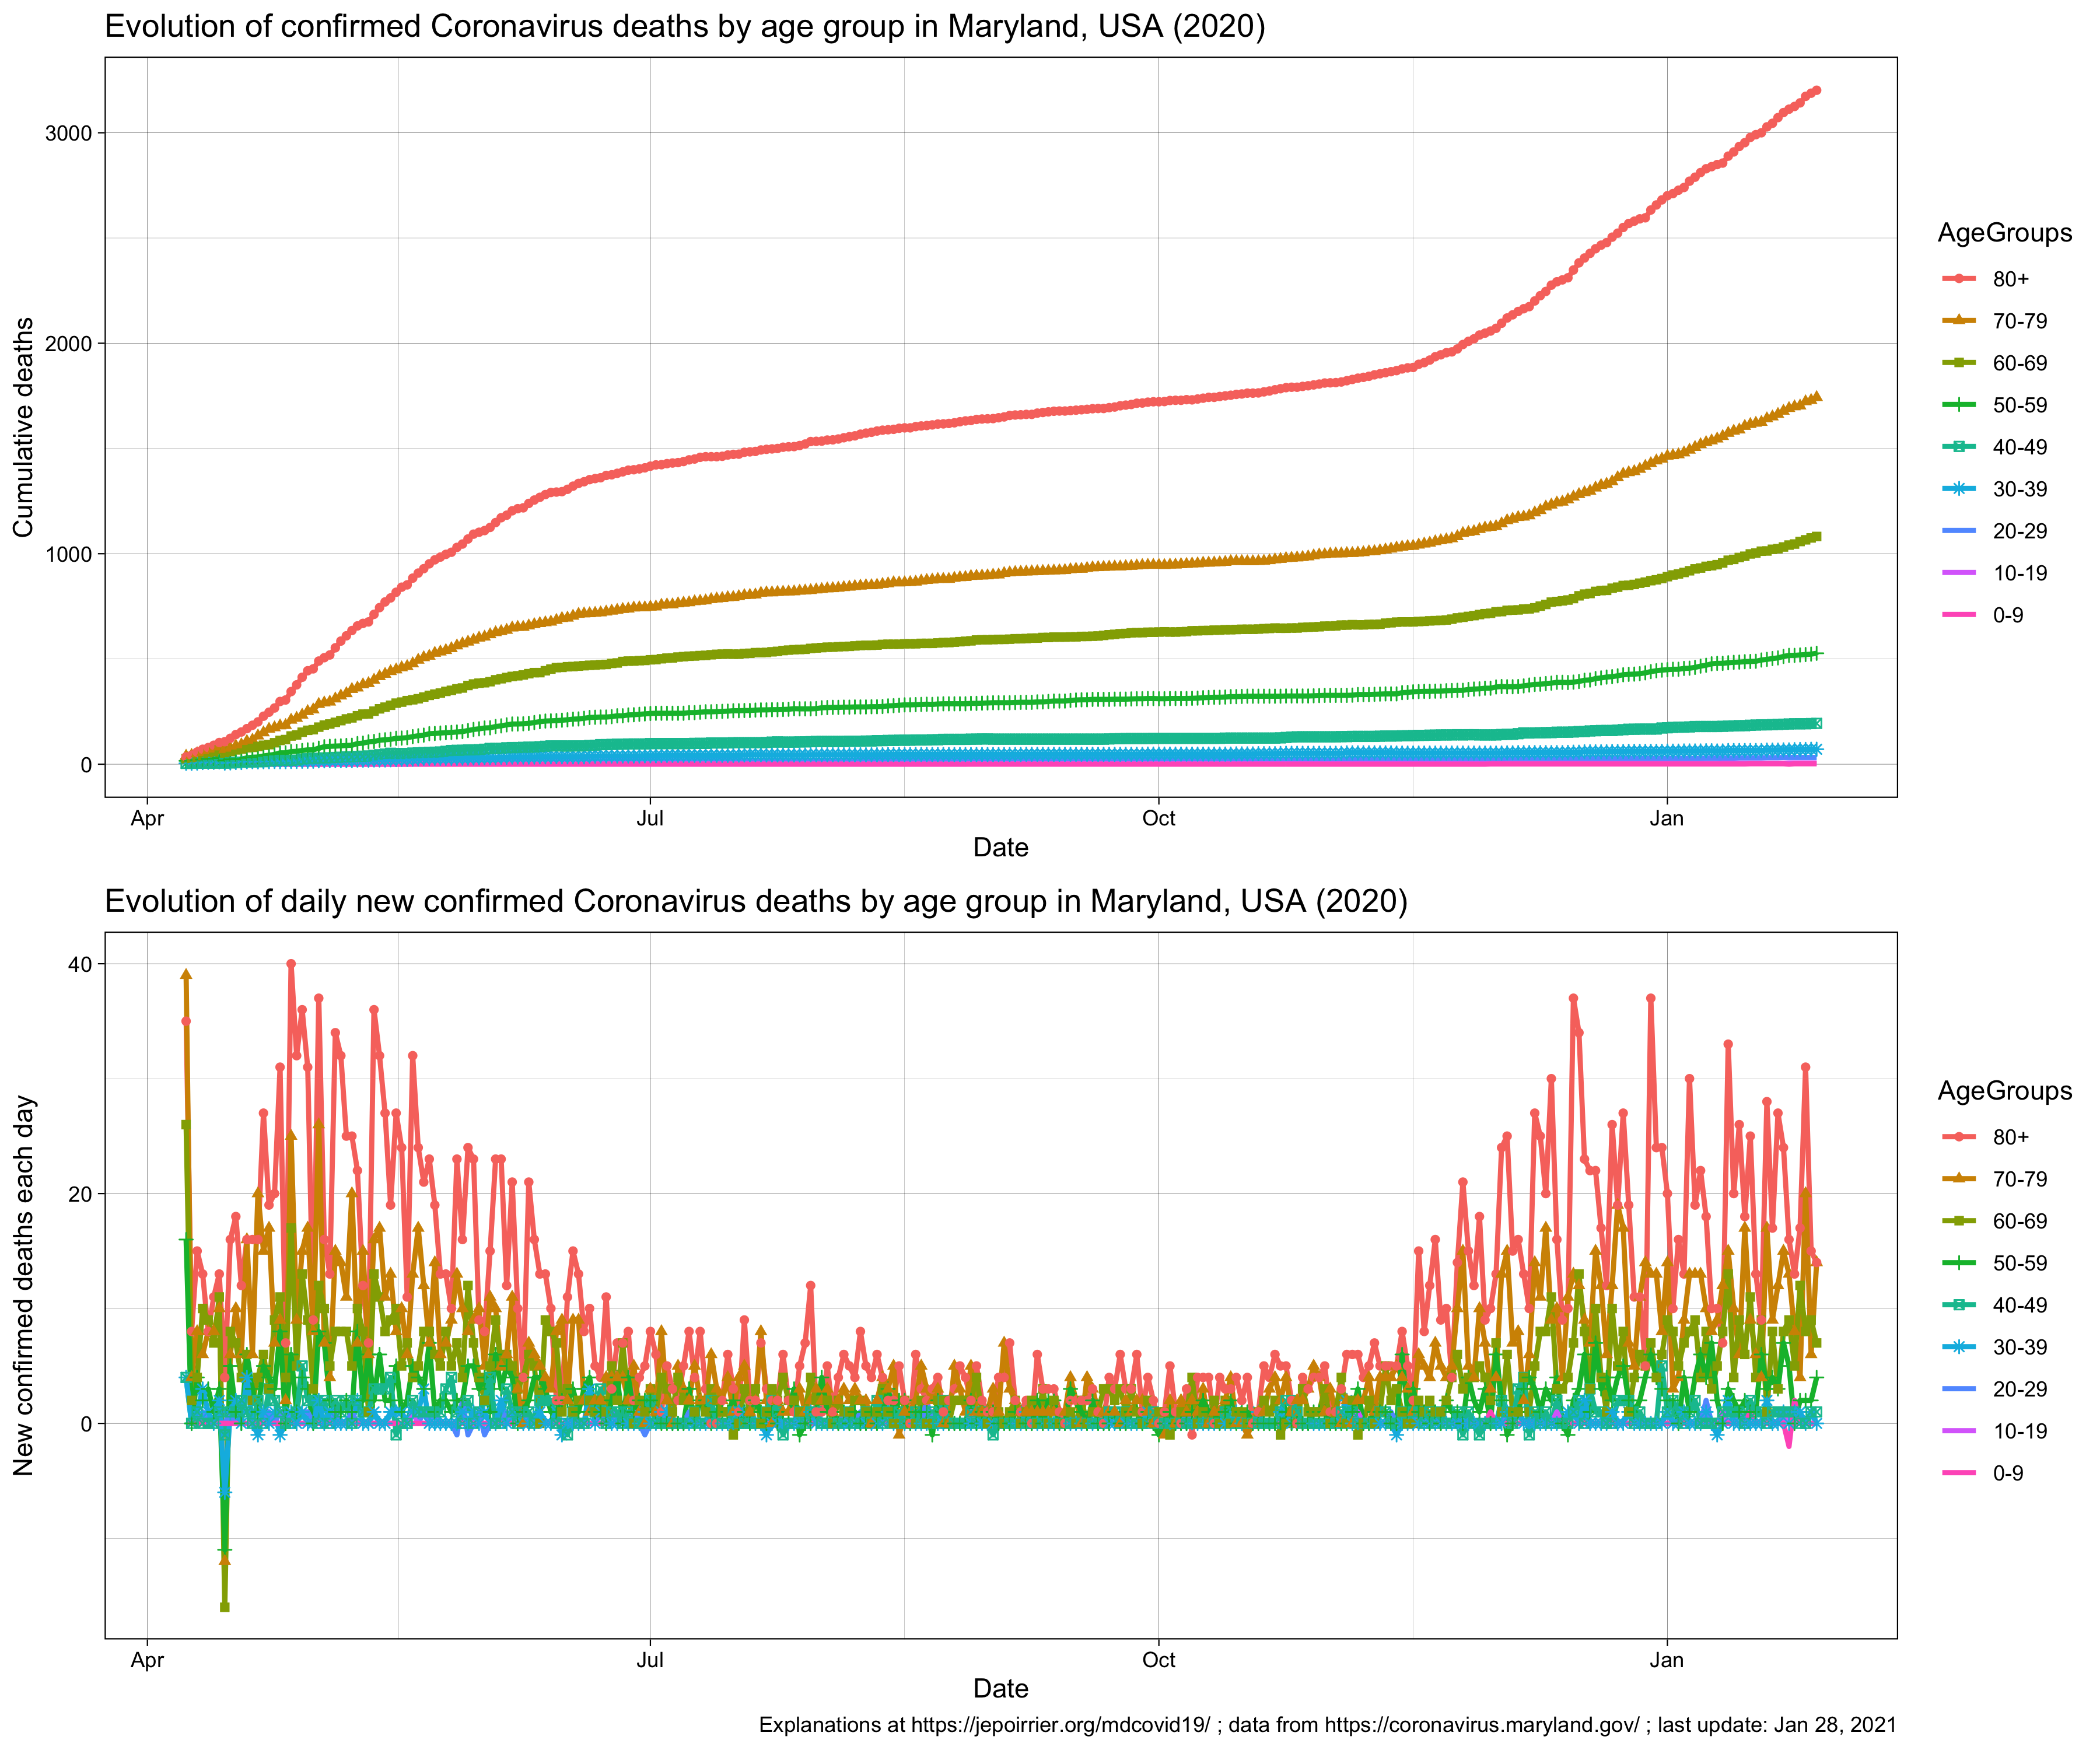
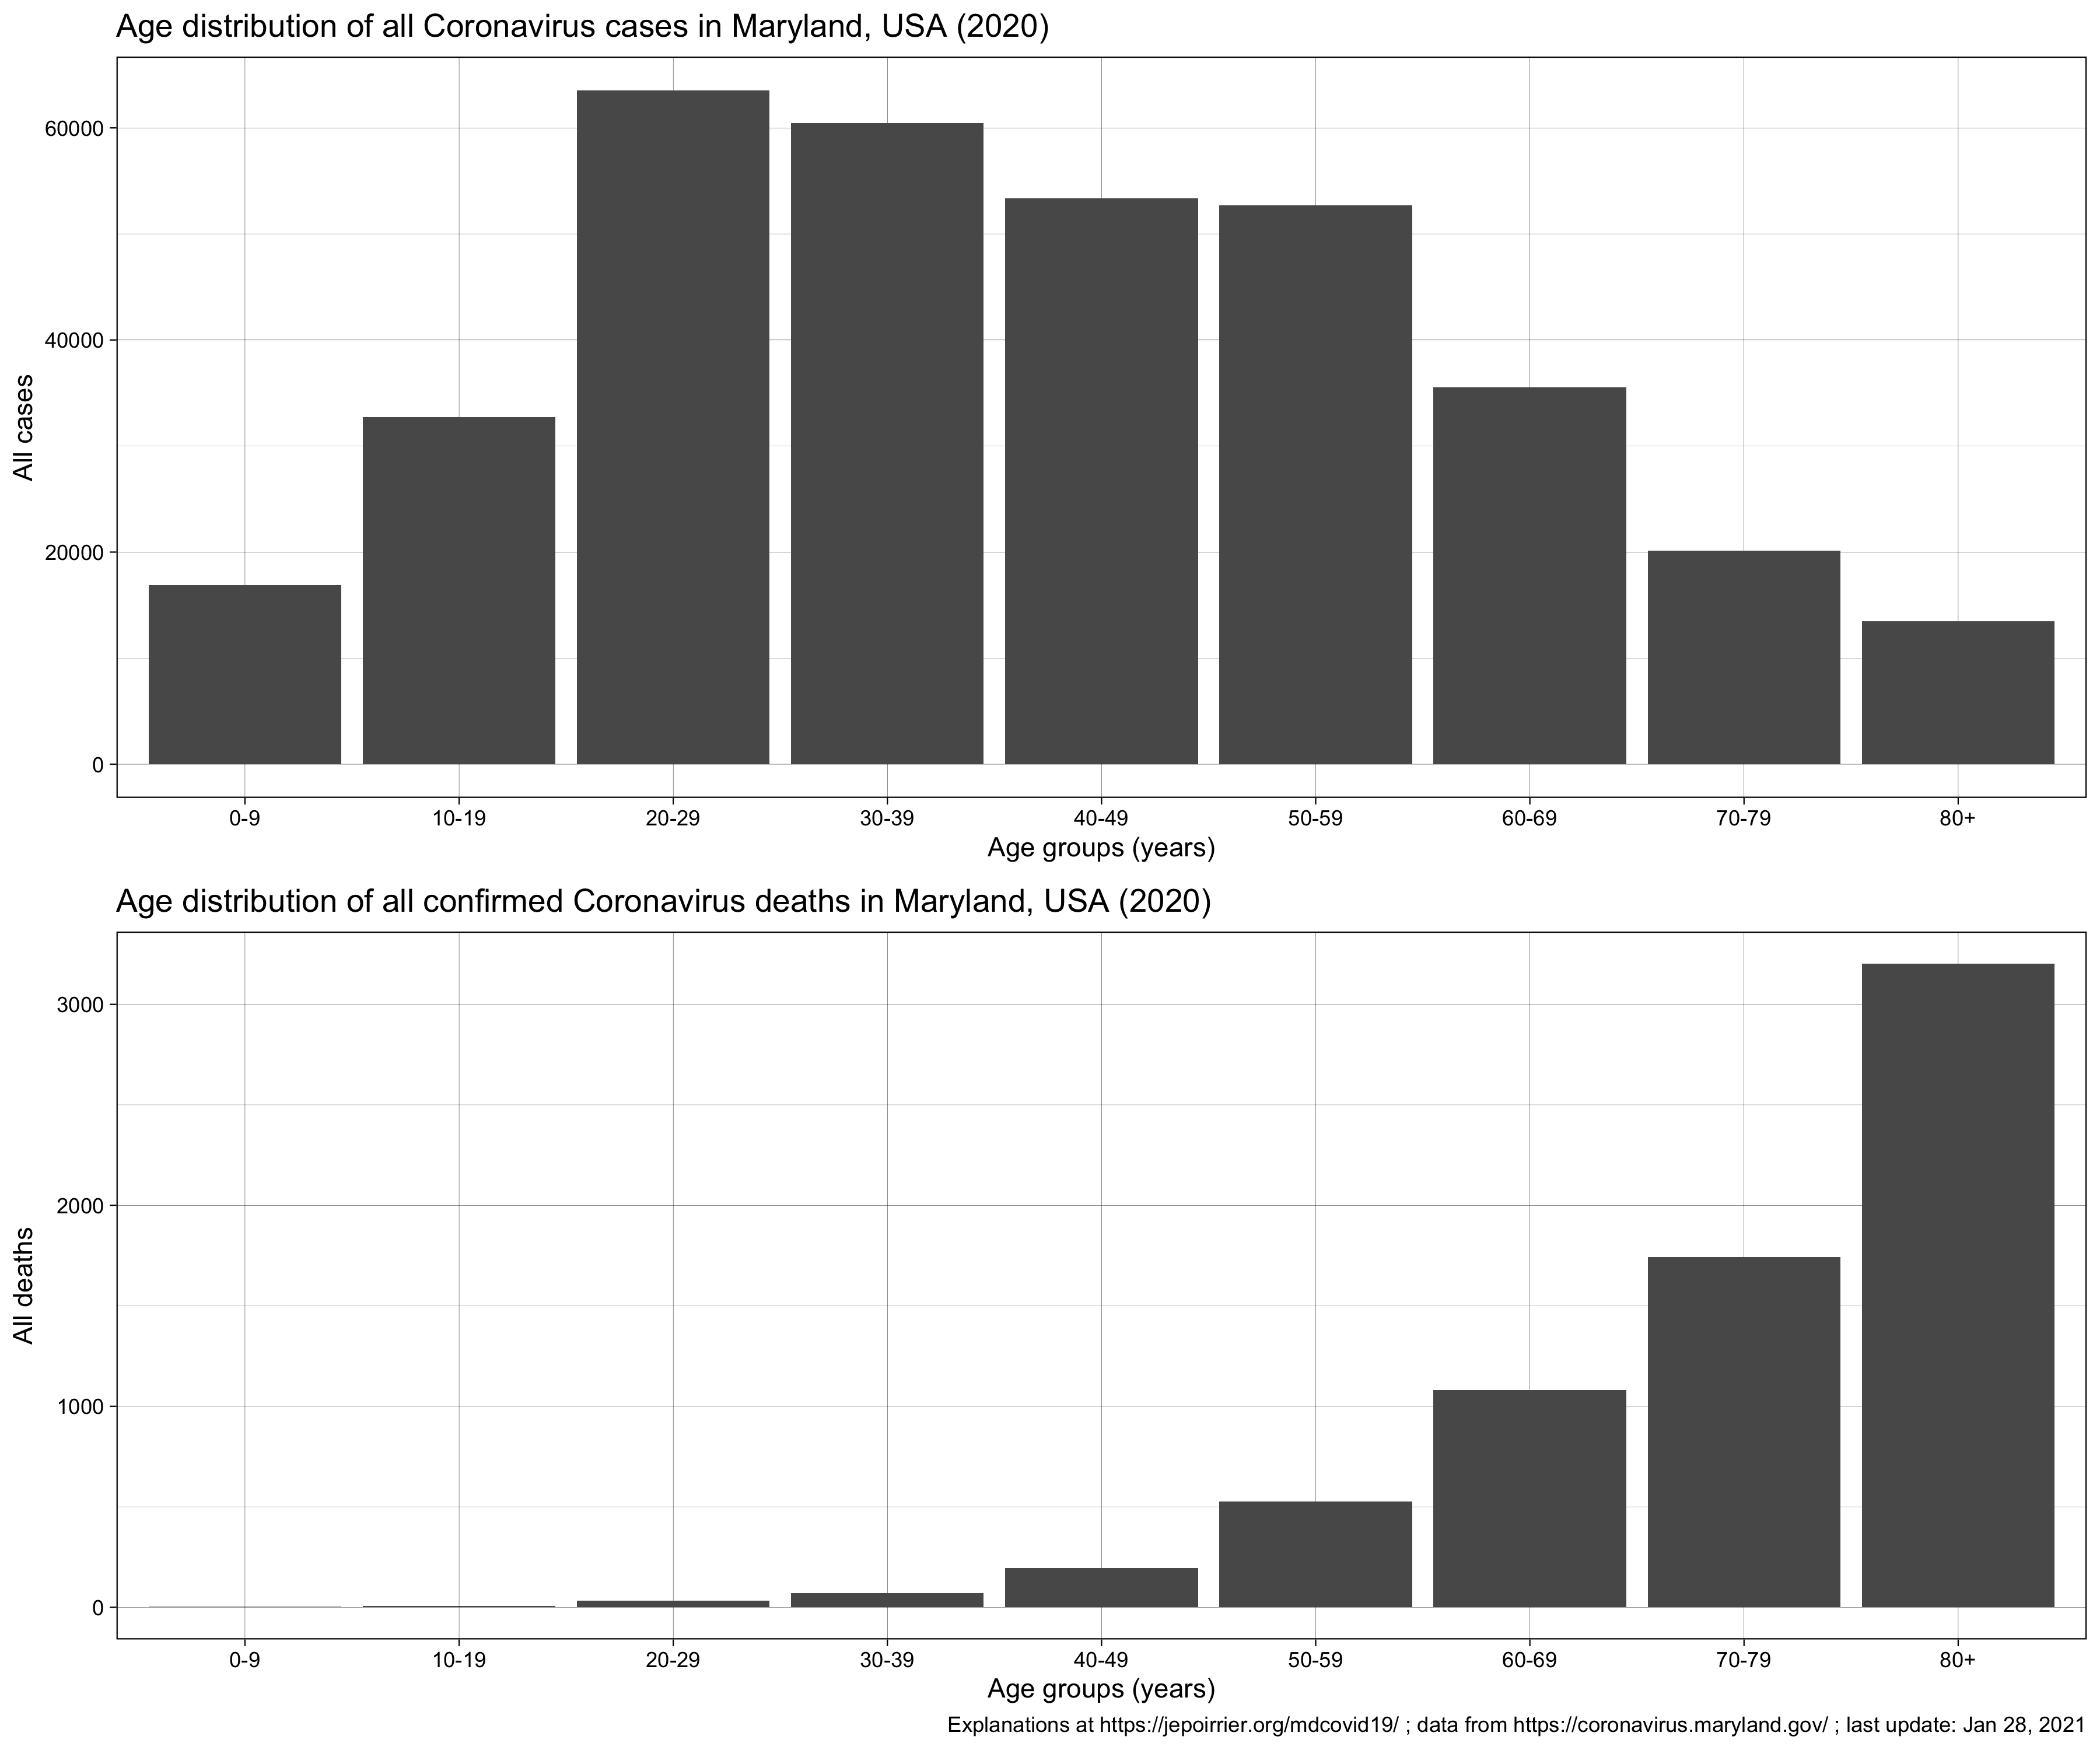
Graphs showing the cumulative and daily evolution of COVID-19 cases by age in Maryland (crude numbers). I wrote about the age implications for cases in July 2020.Top graph shows the cumulative evolution of COVID-19 cases by age relative to each population in Maryland. The bottom graph shows the proportion of each age group in the total number of cases.Graphs showing the cumulative and daily evolution of COVID-19 deaths by age in Maryland (crude numbers). I wrote about the age implications for deaths in July 2020.Top graph shows the cumulative evolution of COVID-19 deaths by age relative to each population in Maryland. The bottom graph shows the proportion of each age group in the total number of deaths.Latest snapshot (count) of all cases and deaths due to COVID-19 by age group in Maryland
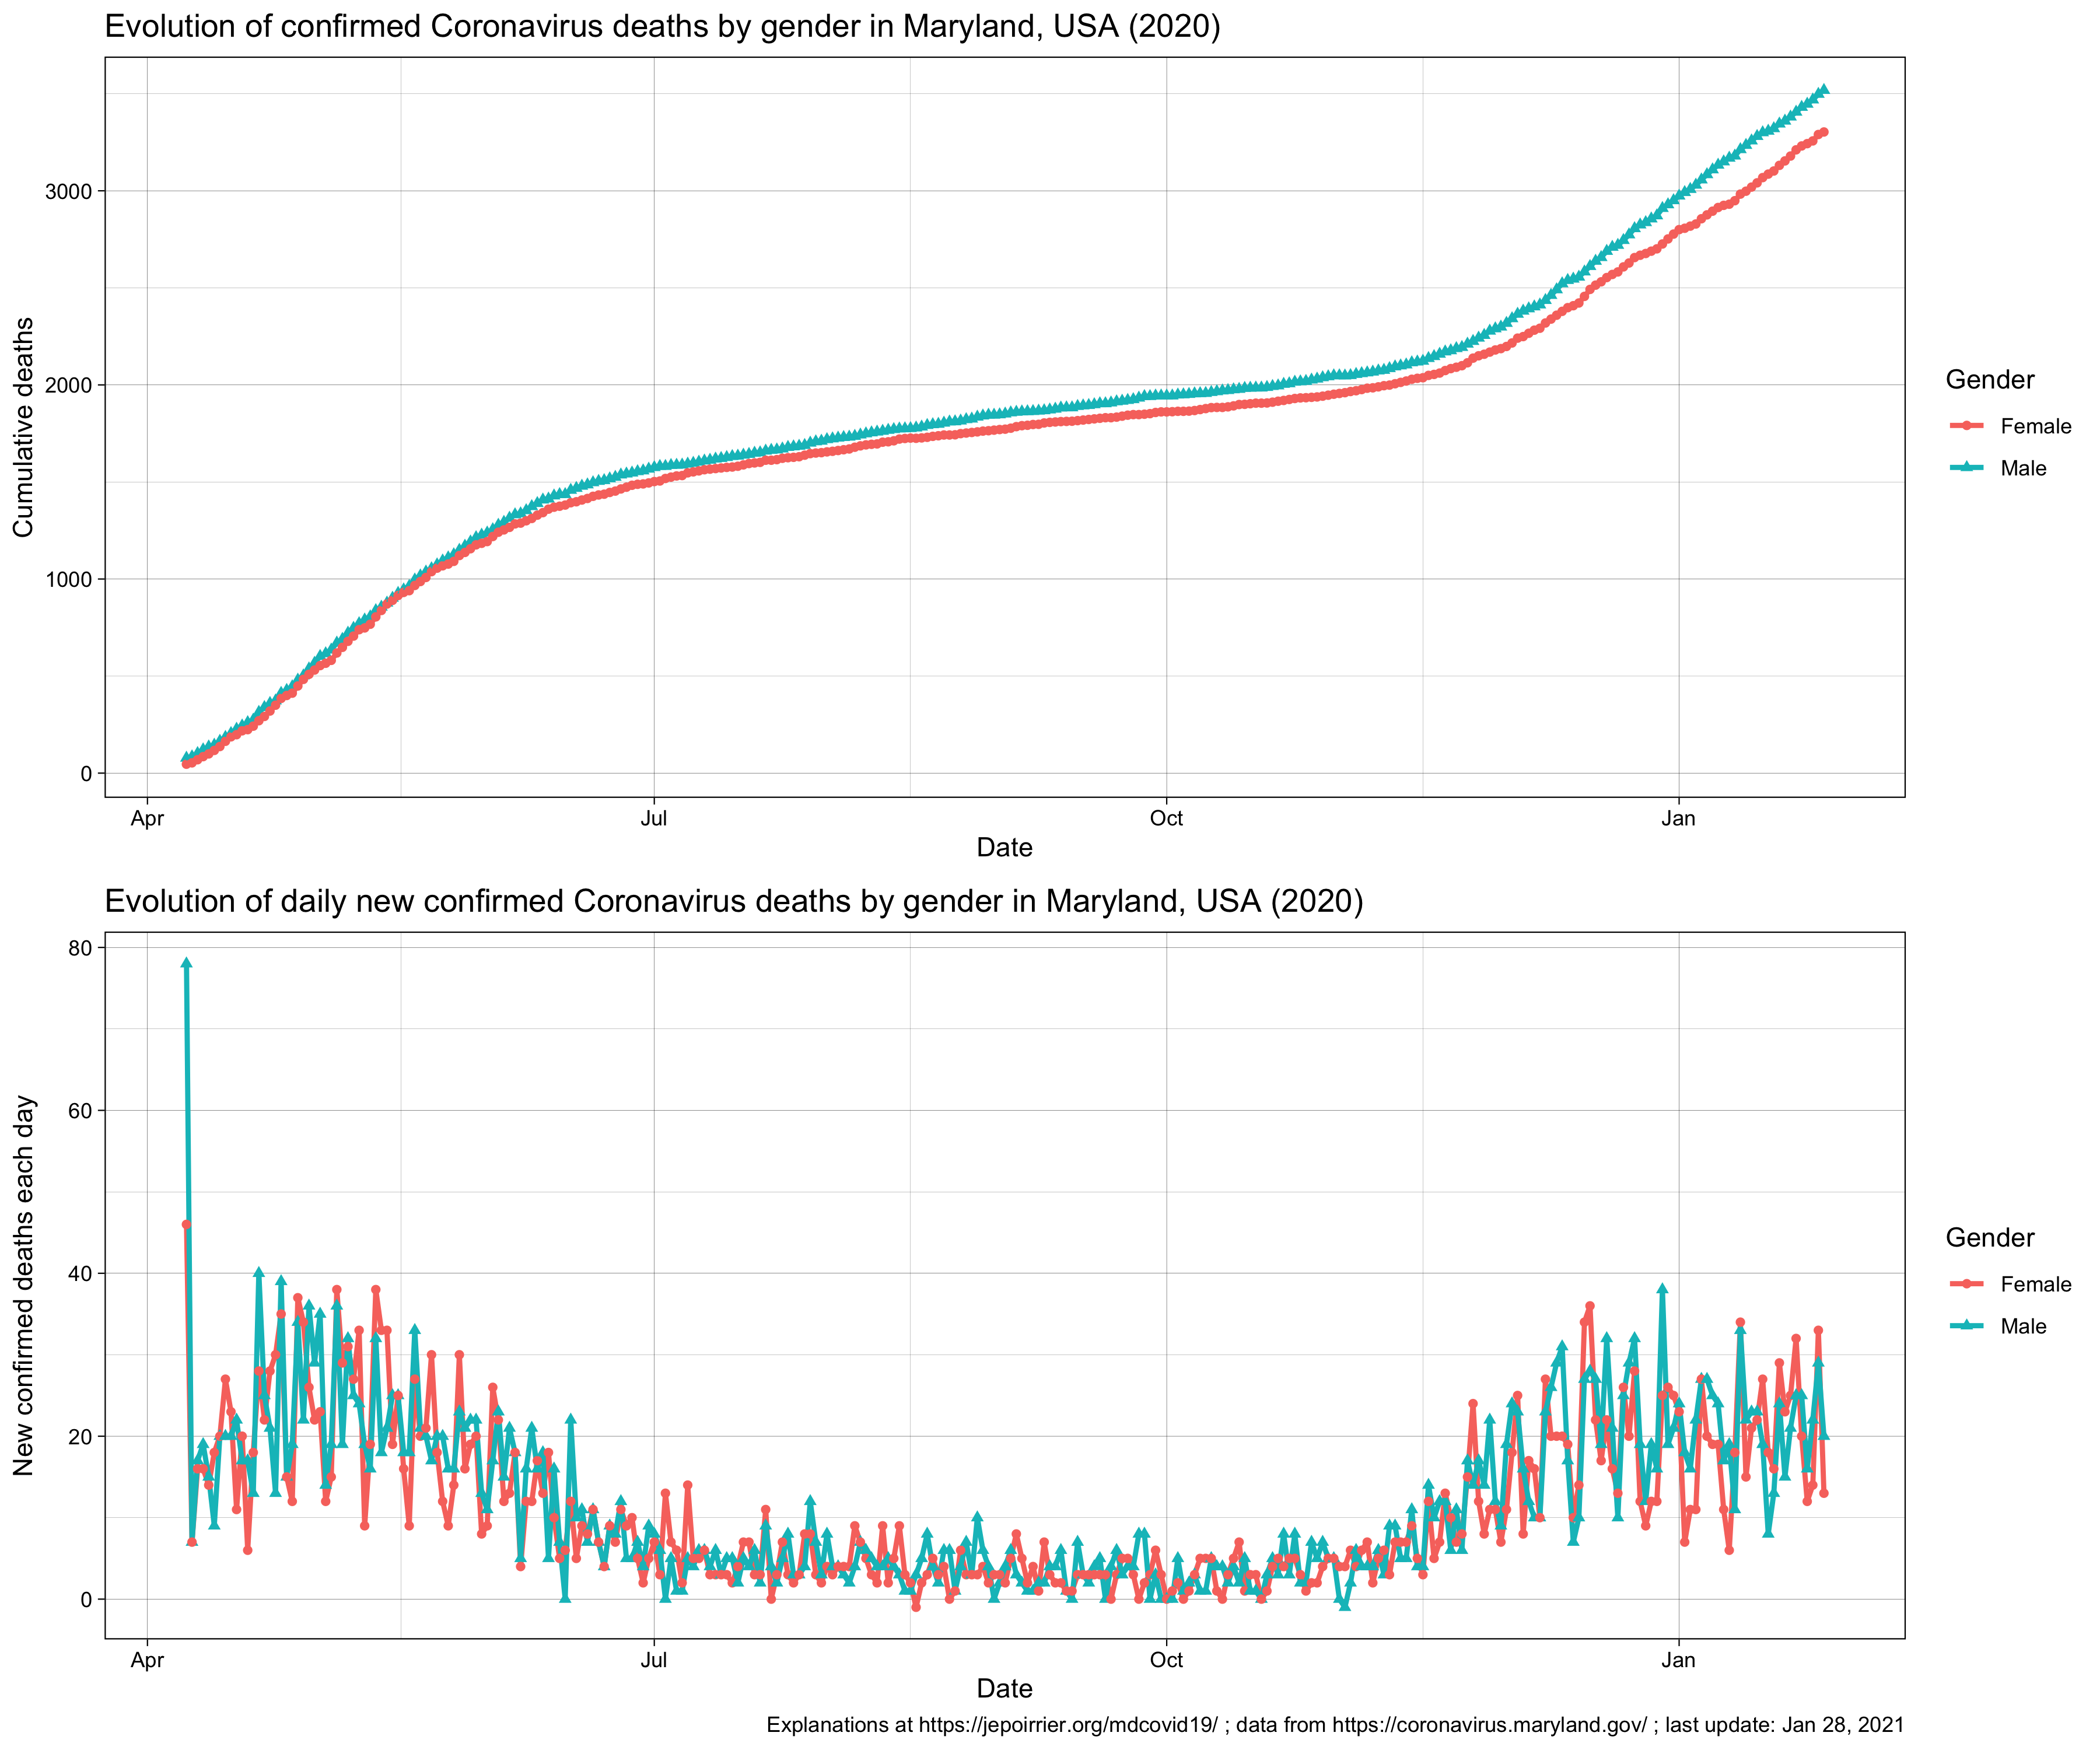
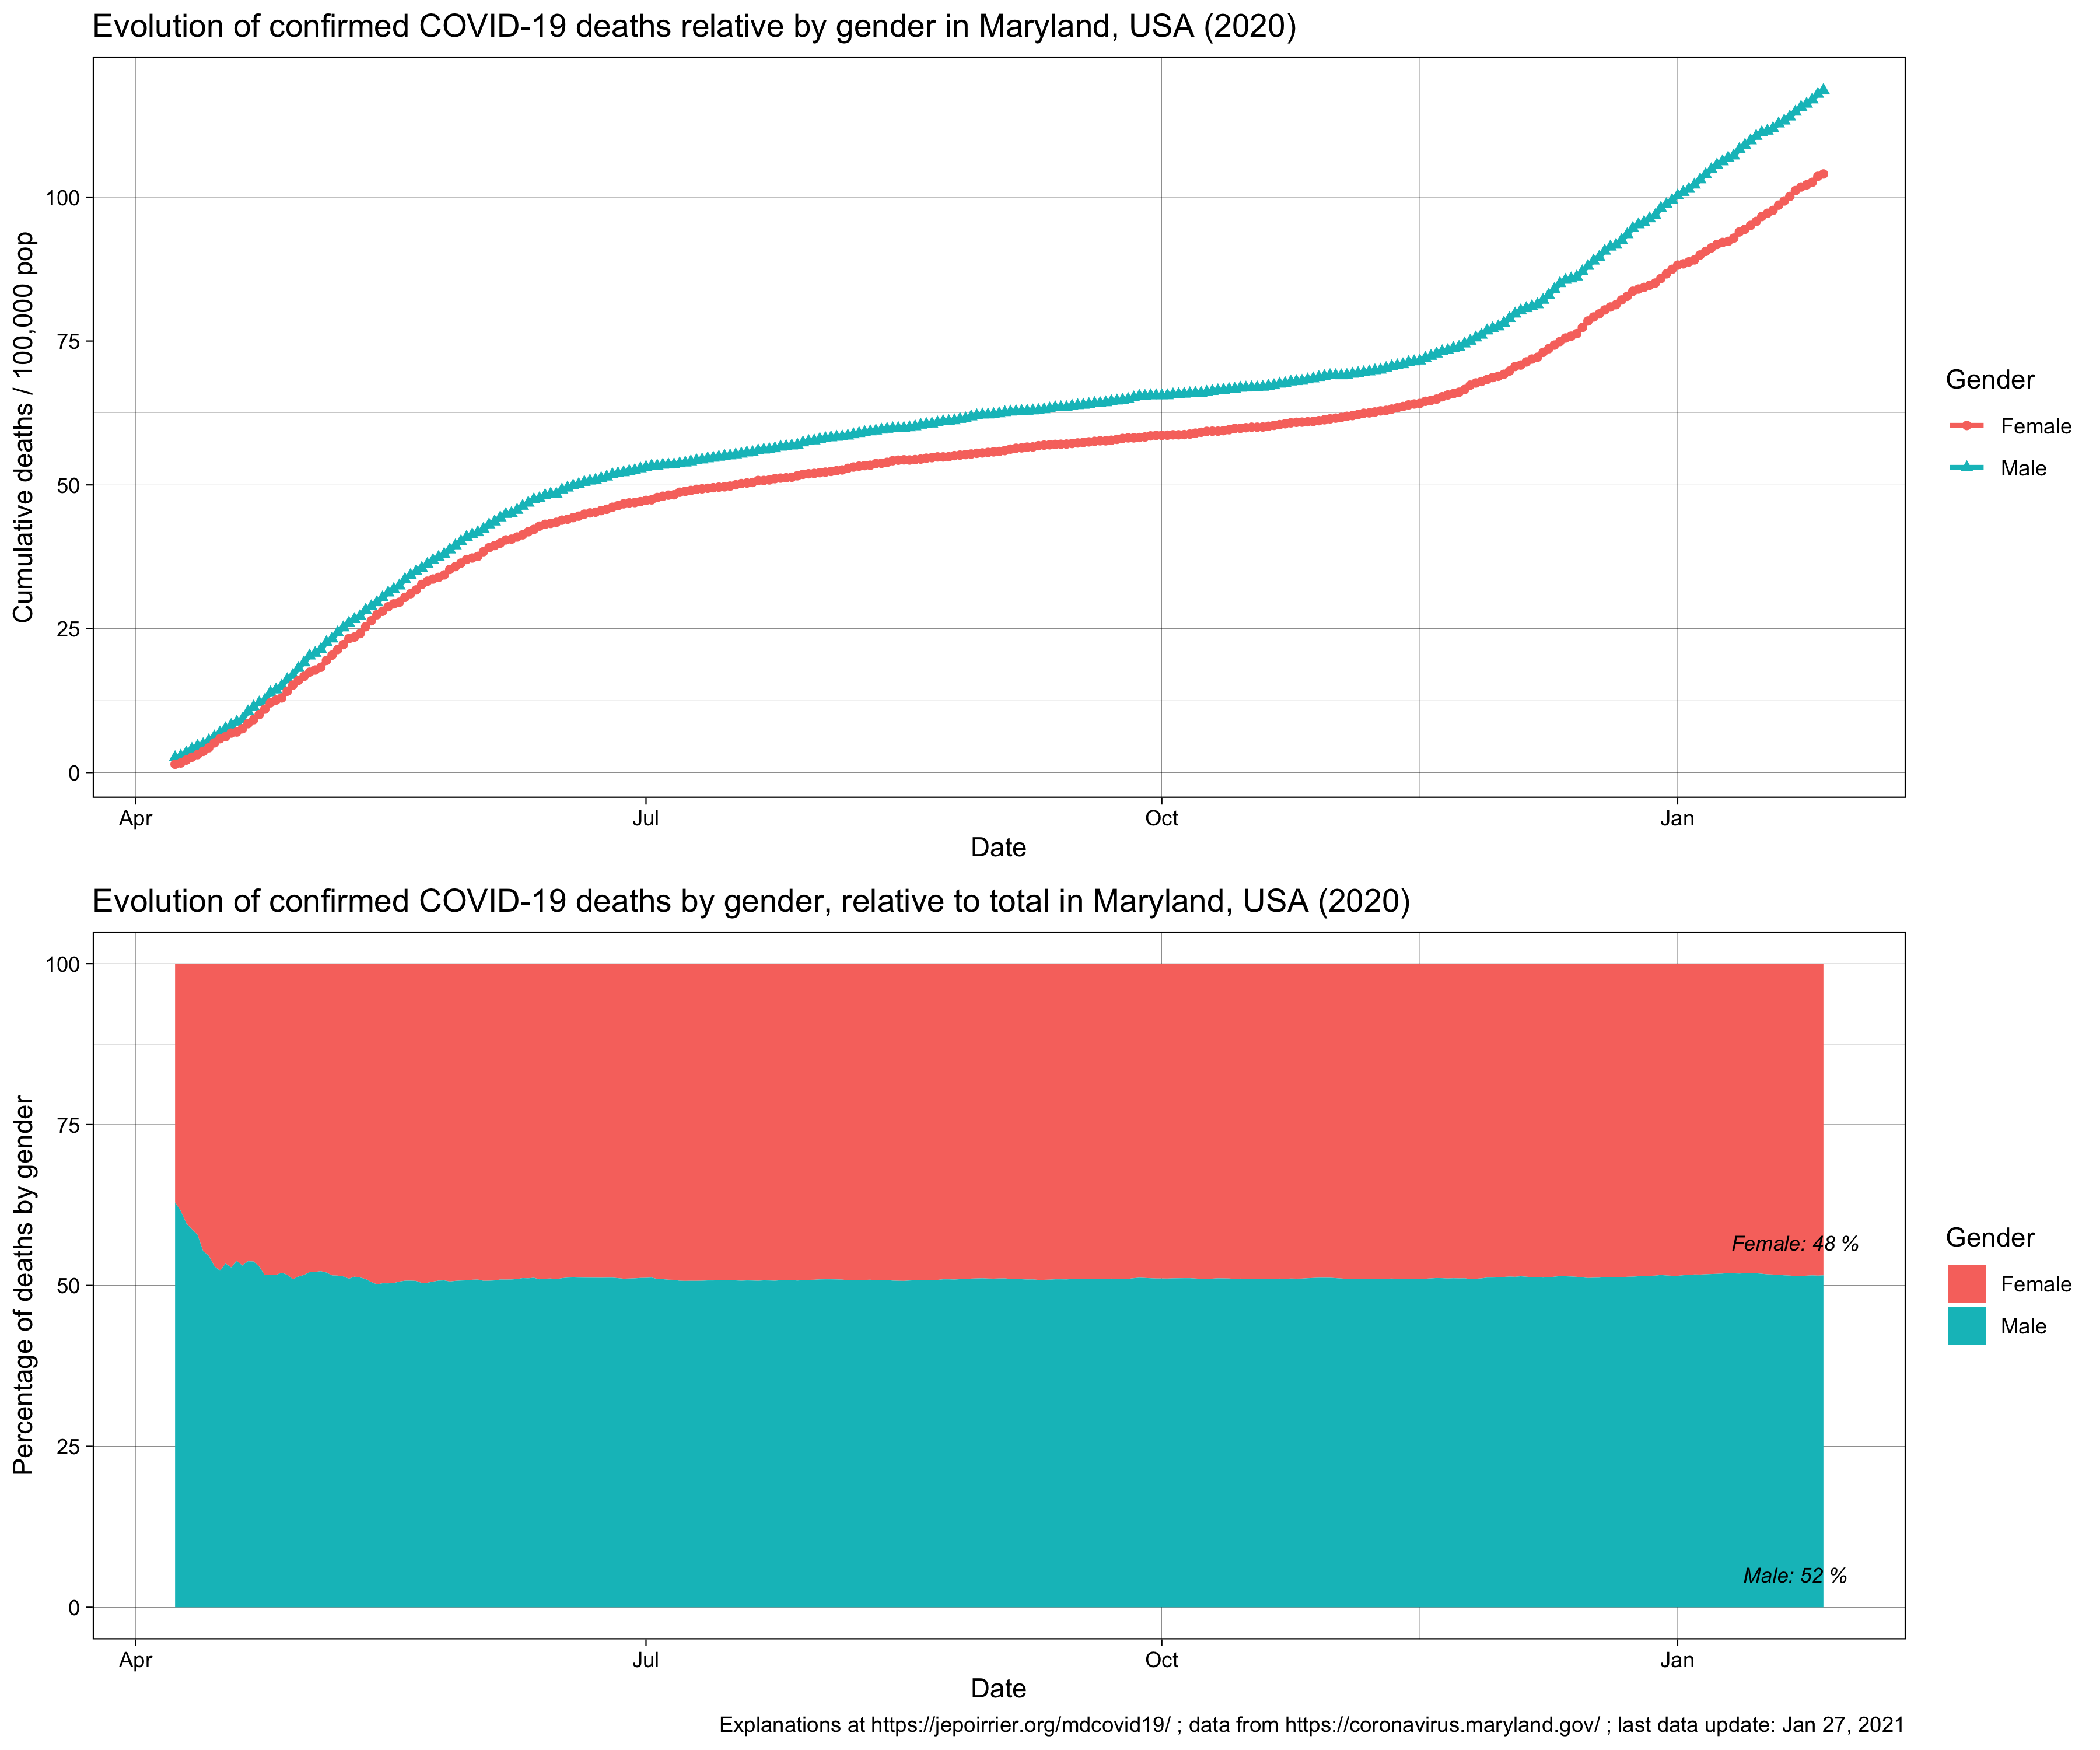
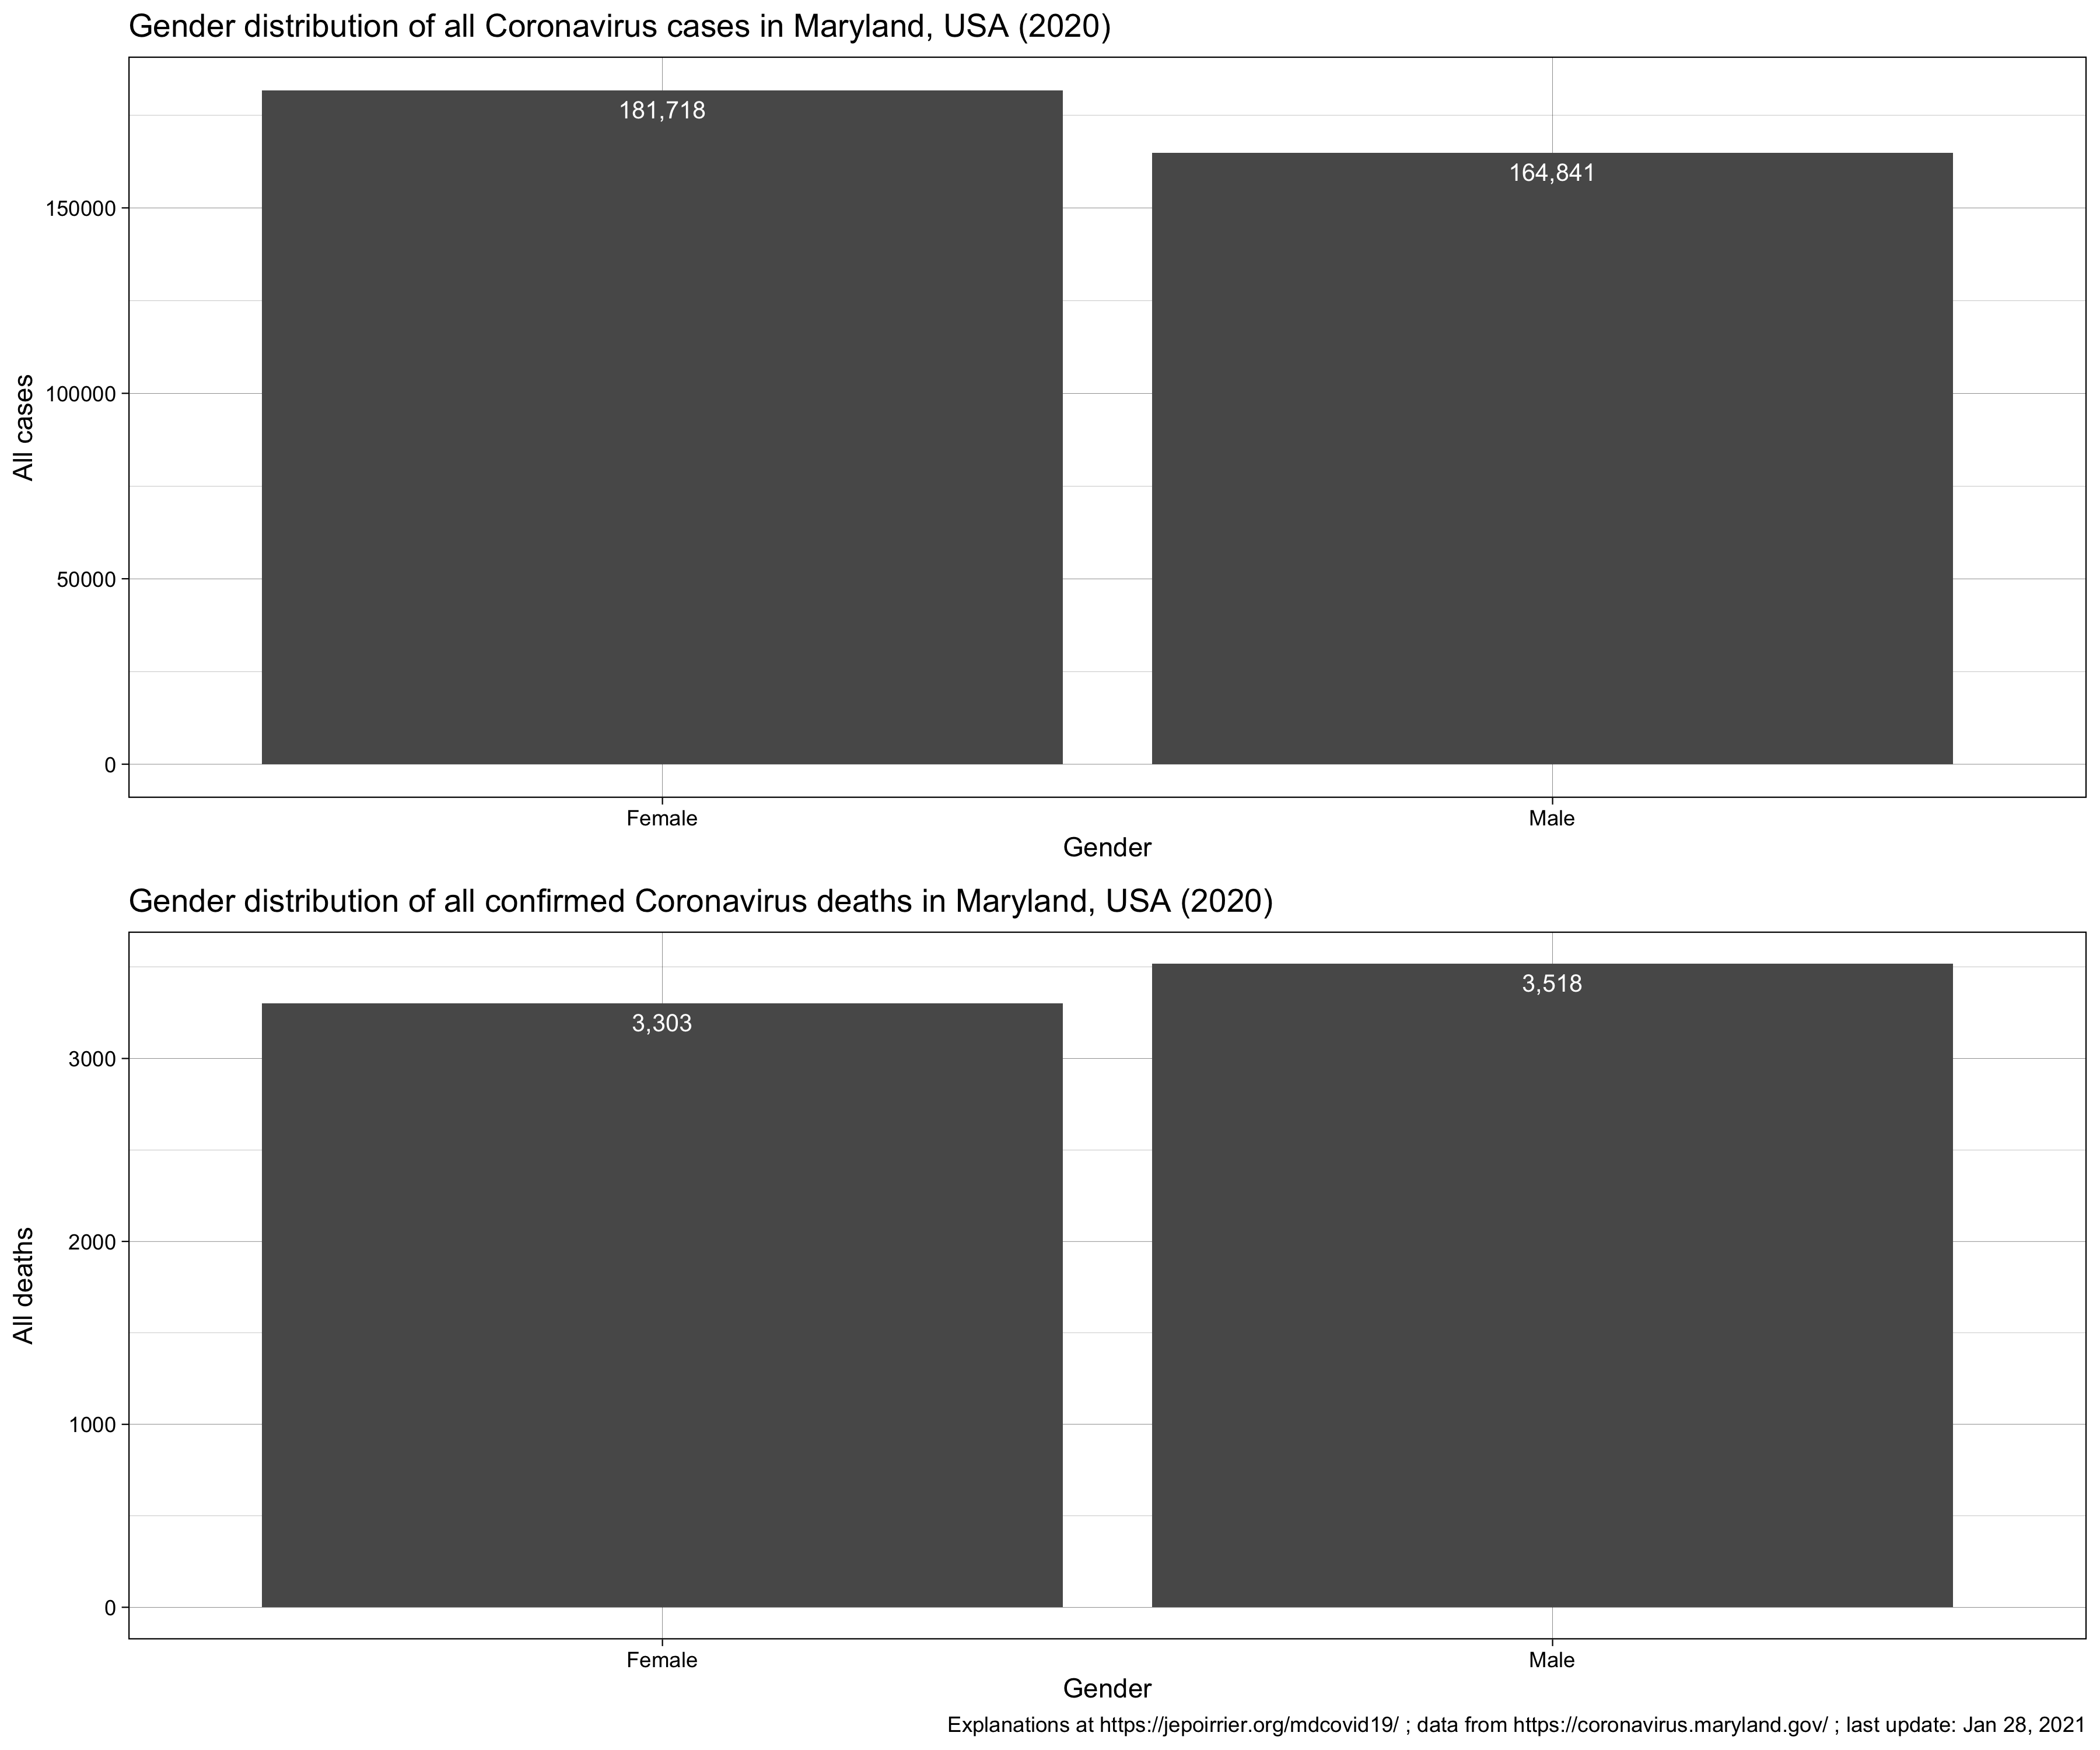
Gender
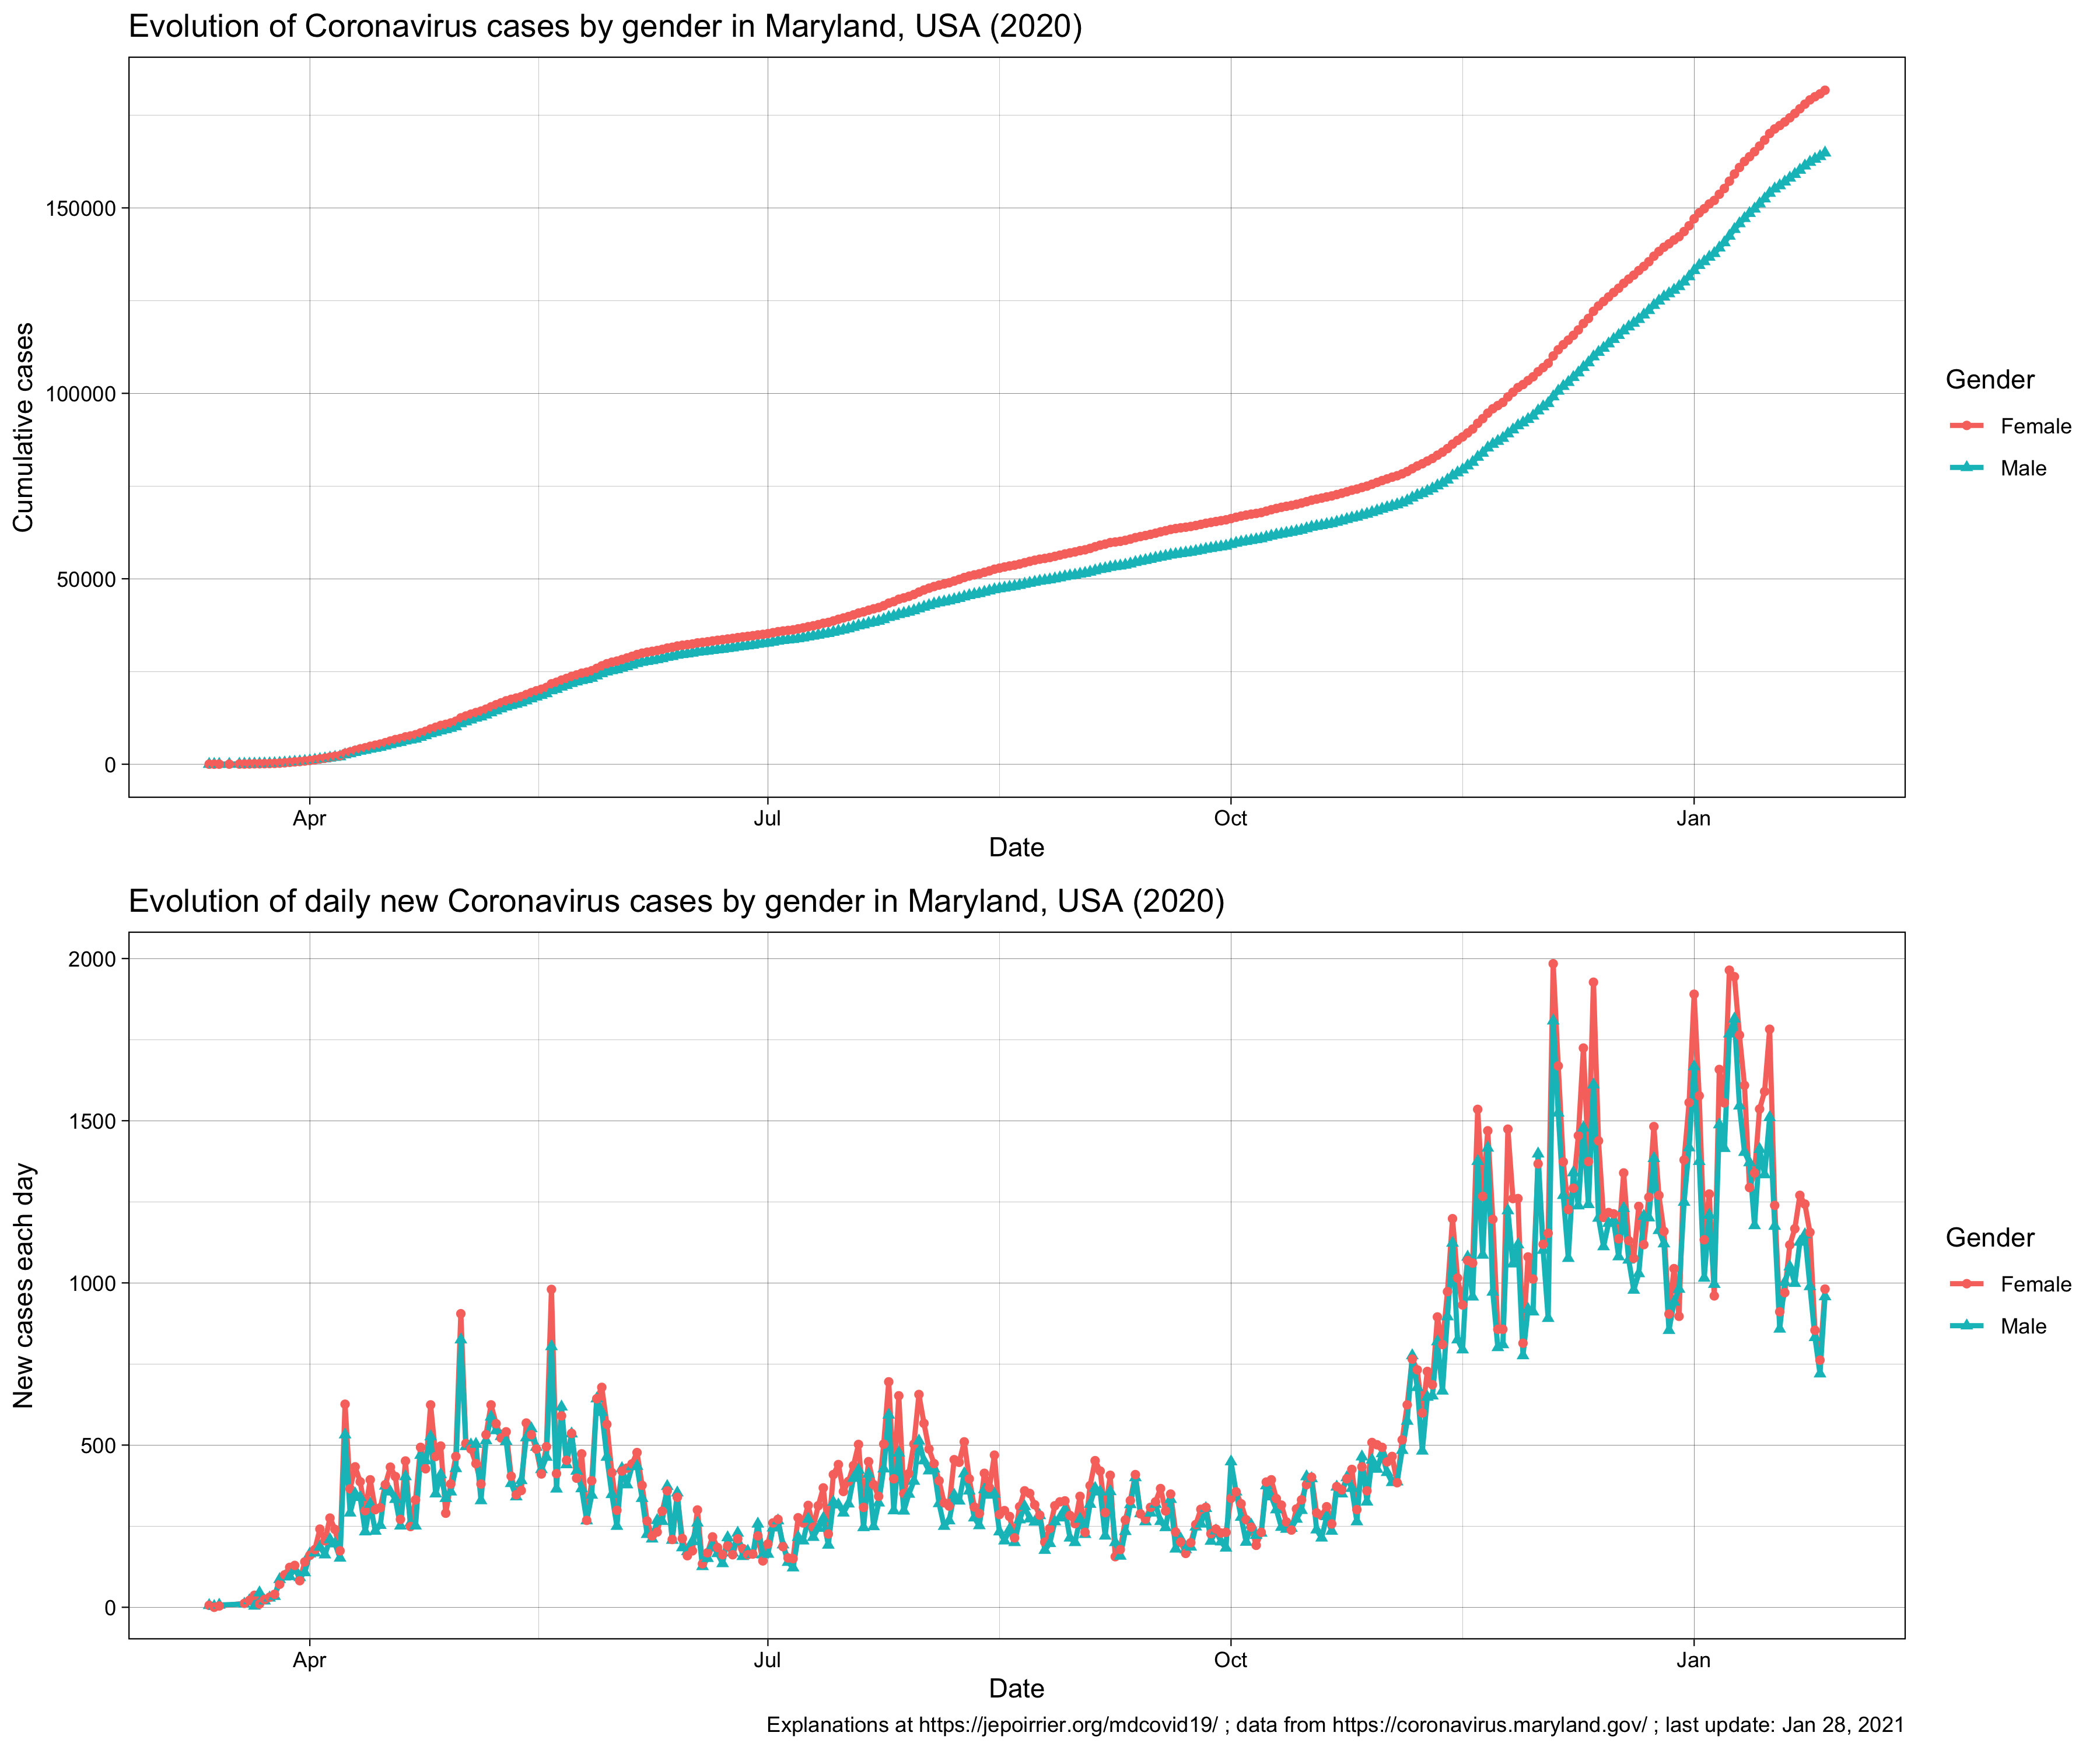
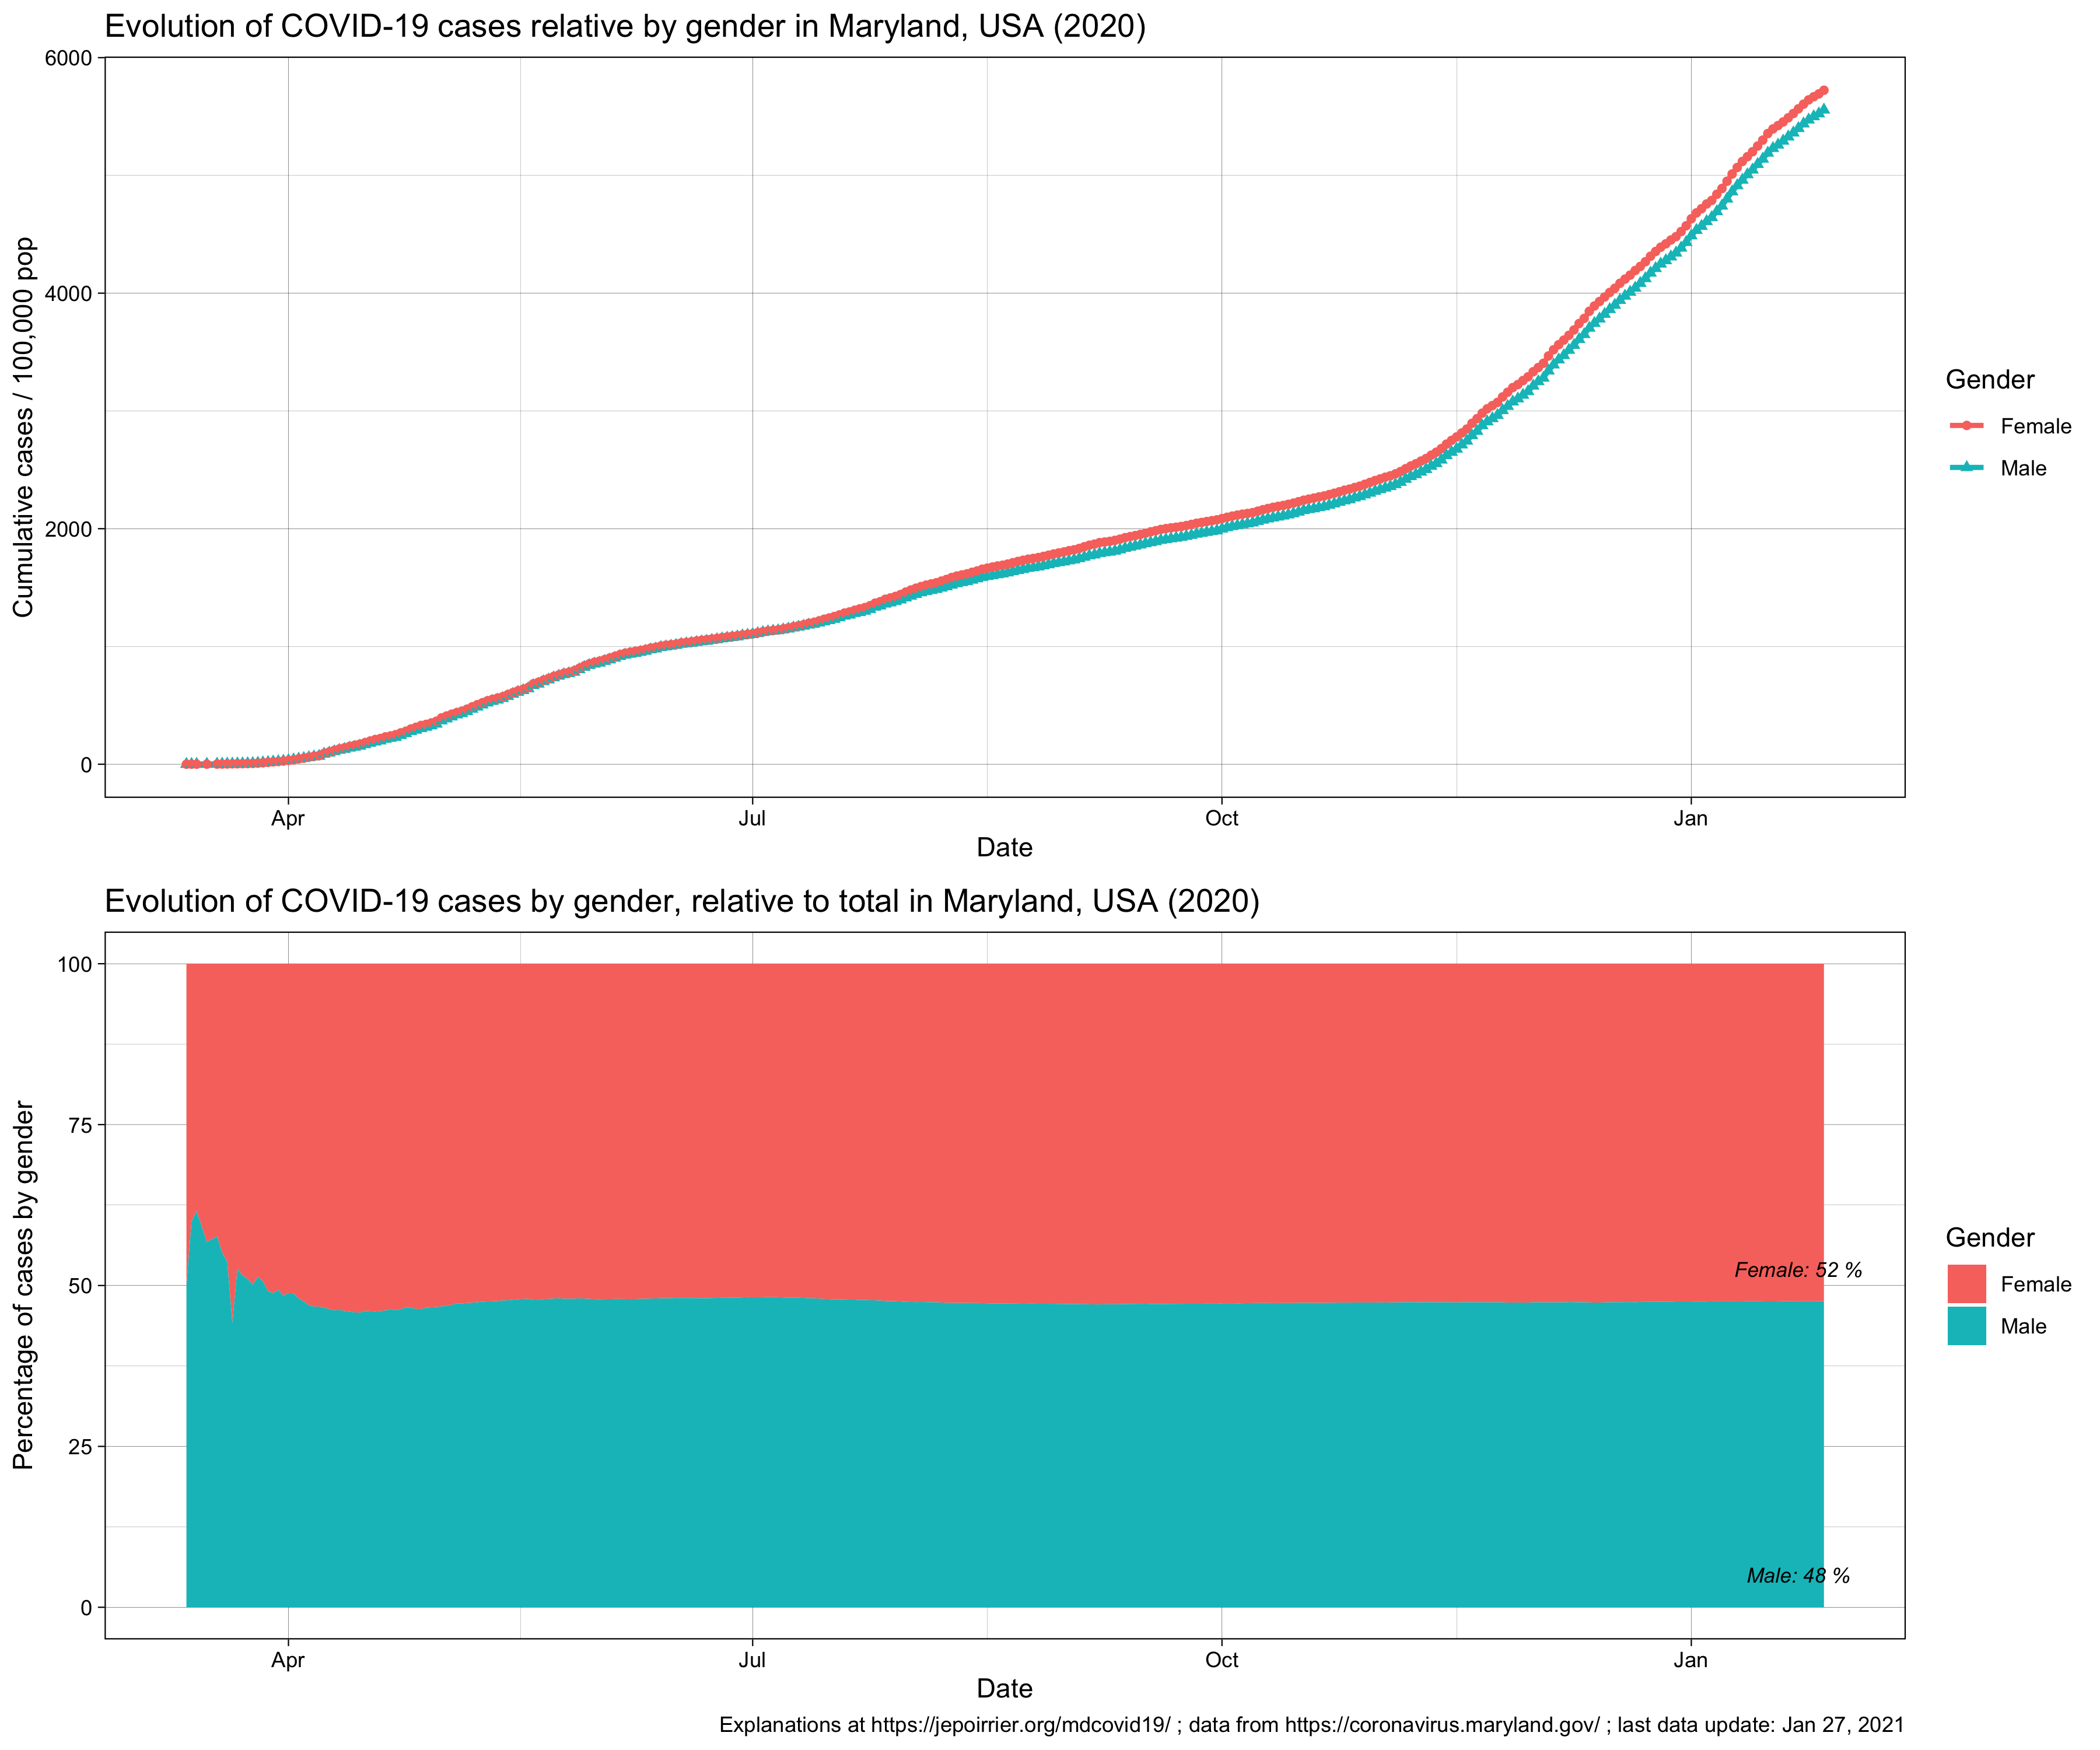
I wrote about the gender of COVID-19 cases and deaths in Maryland earlier.Top graph shows the cumulative evolution of COVID-19 cases by gender relative to each population in Maryland. The bottom graph shows the proportion of each gender group in the total number of cases.Top graph shows the cumulative evolution of COVID-19 deaths by gender relative to each population in Maryland. The bottom graph shows the proportion of each gender group in the total number of deaths.Latest snapshot (count) of all cases and deaths due to COVID-19 by gender in Maryland
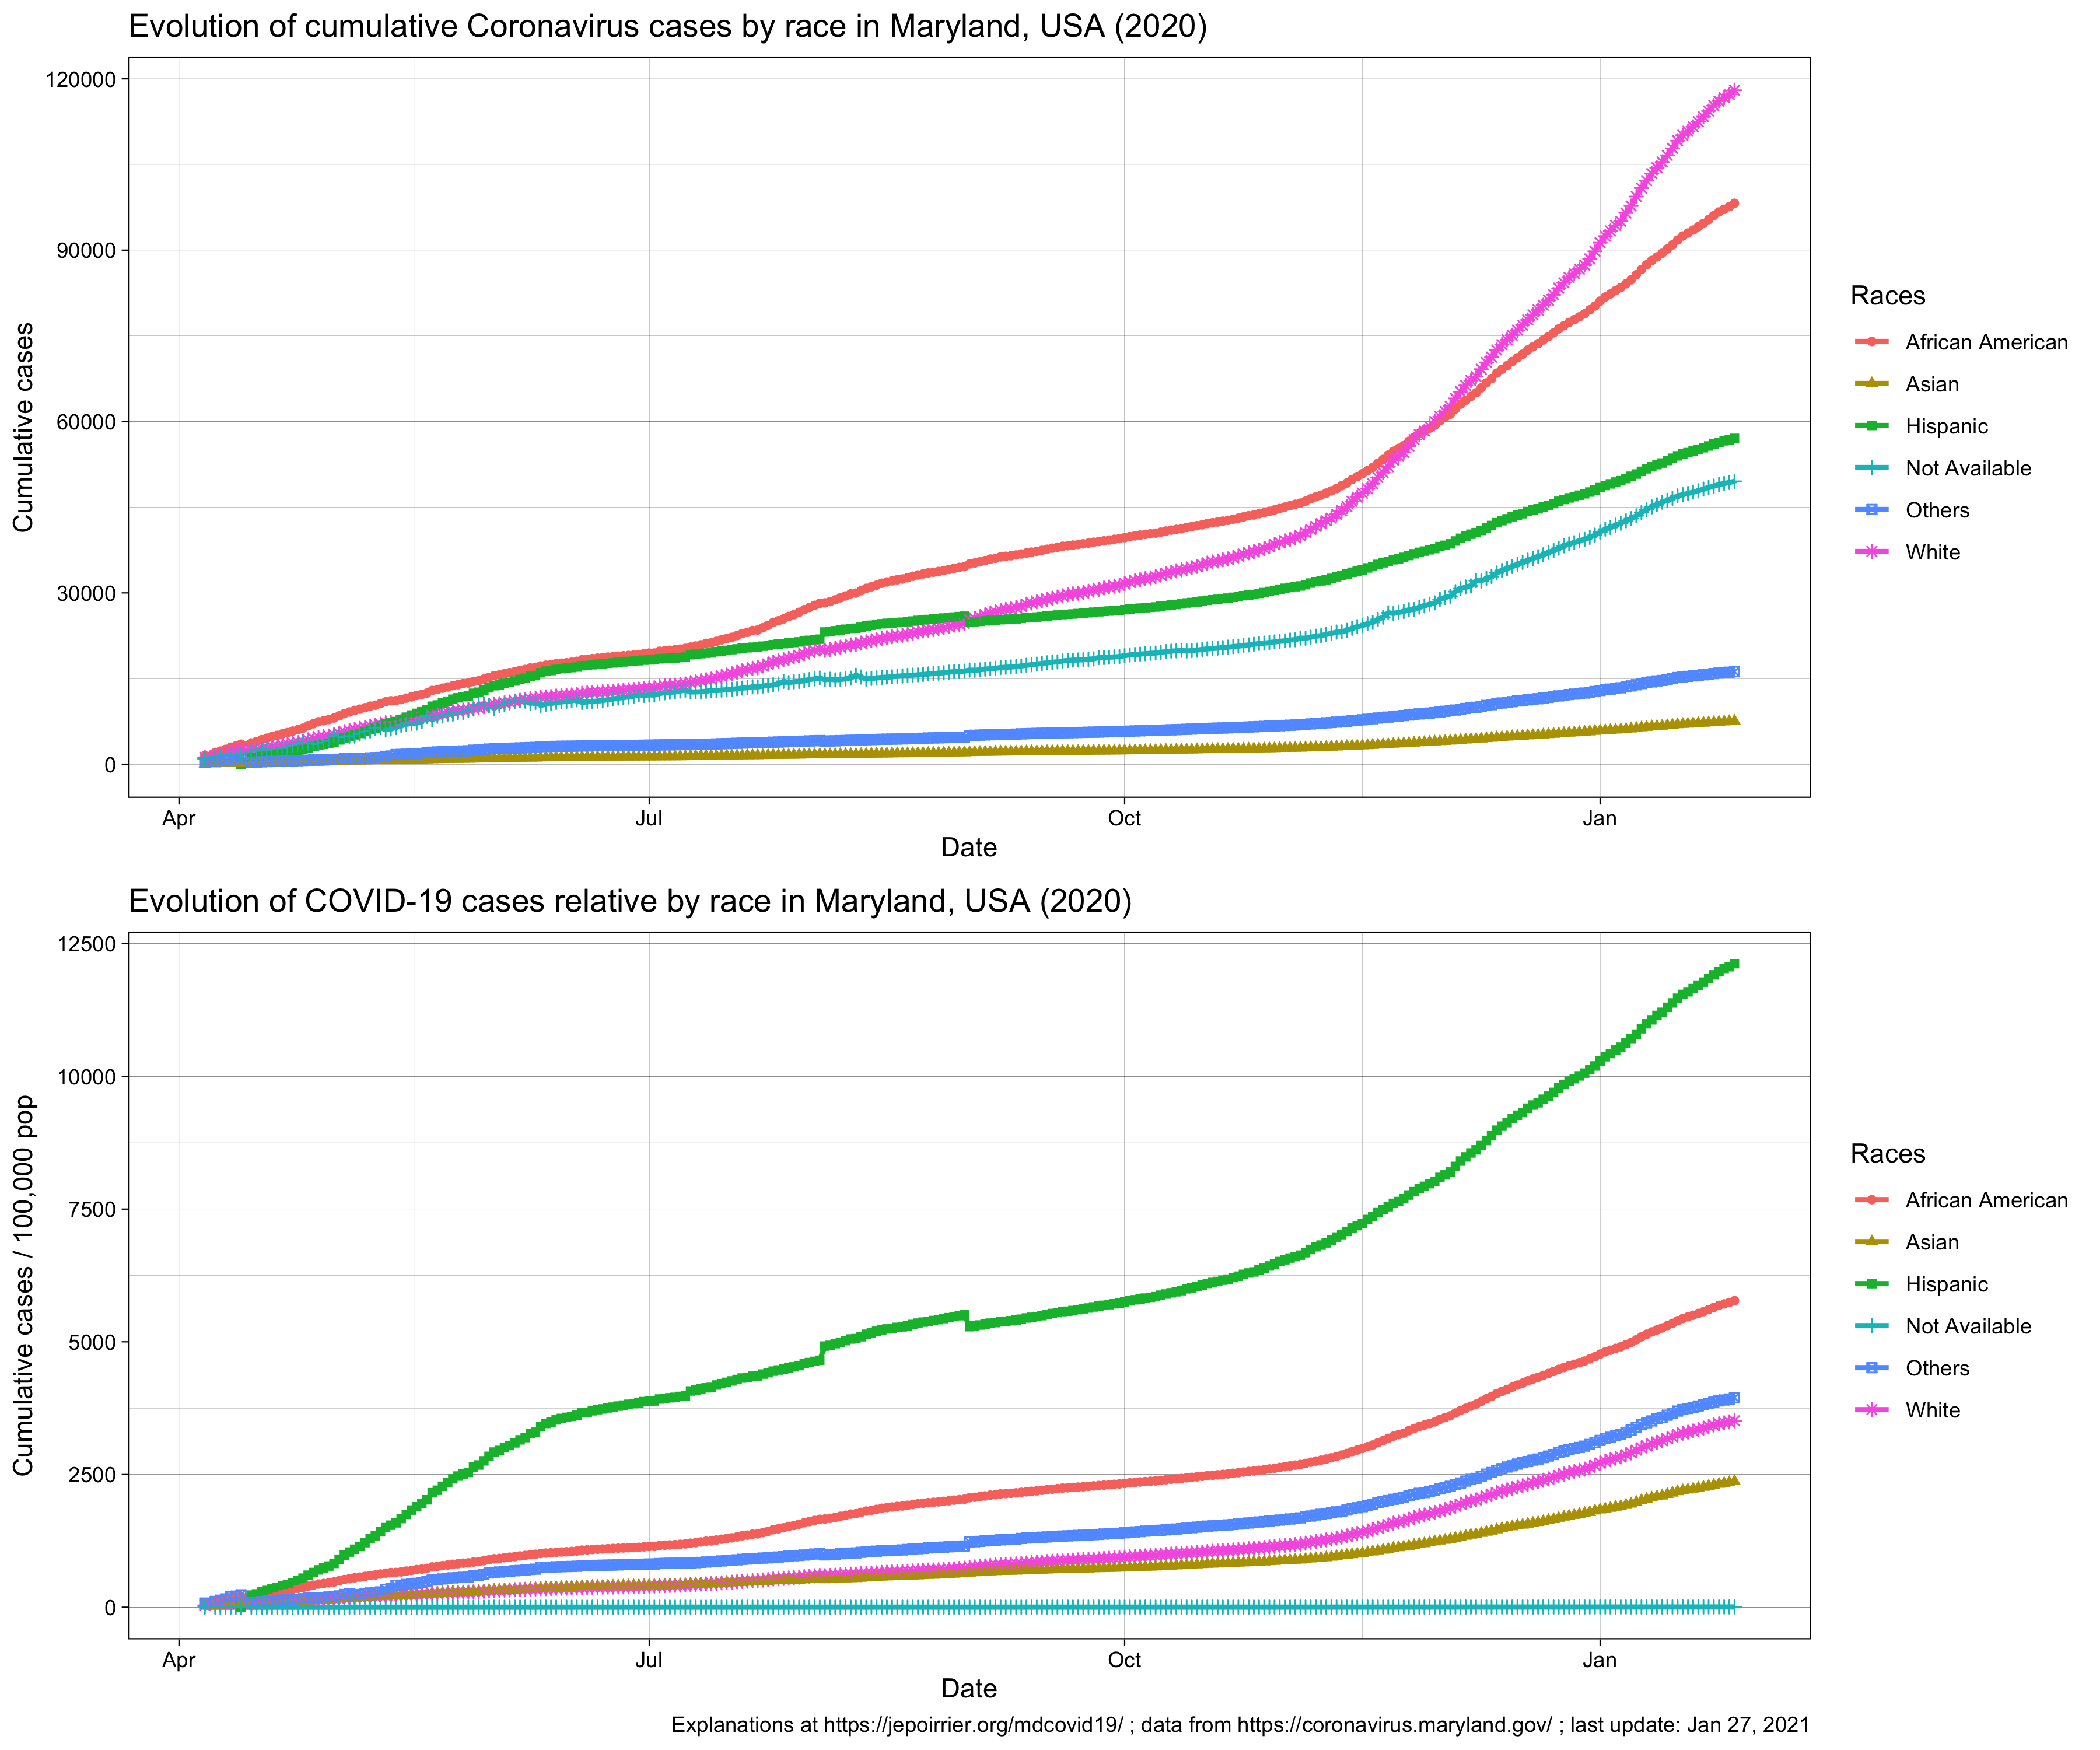
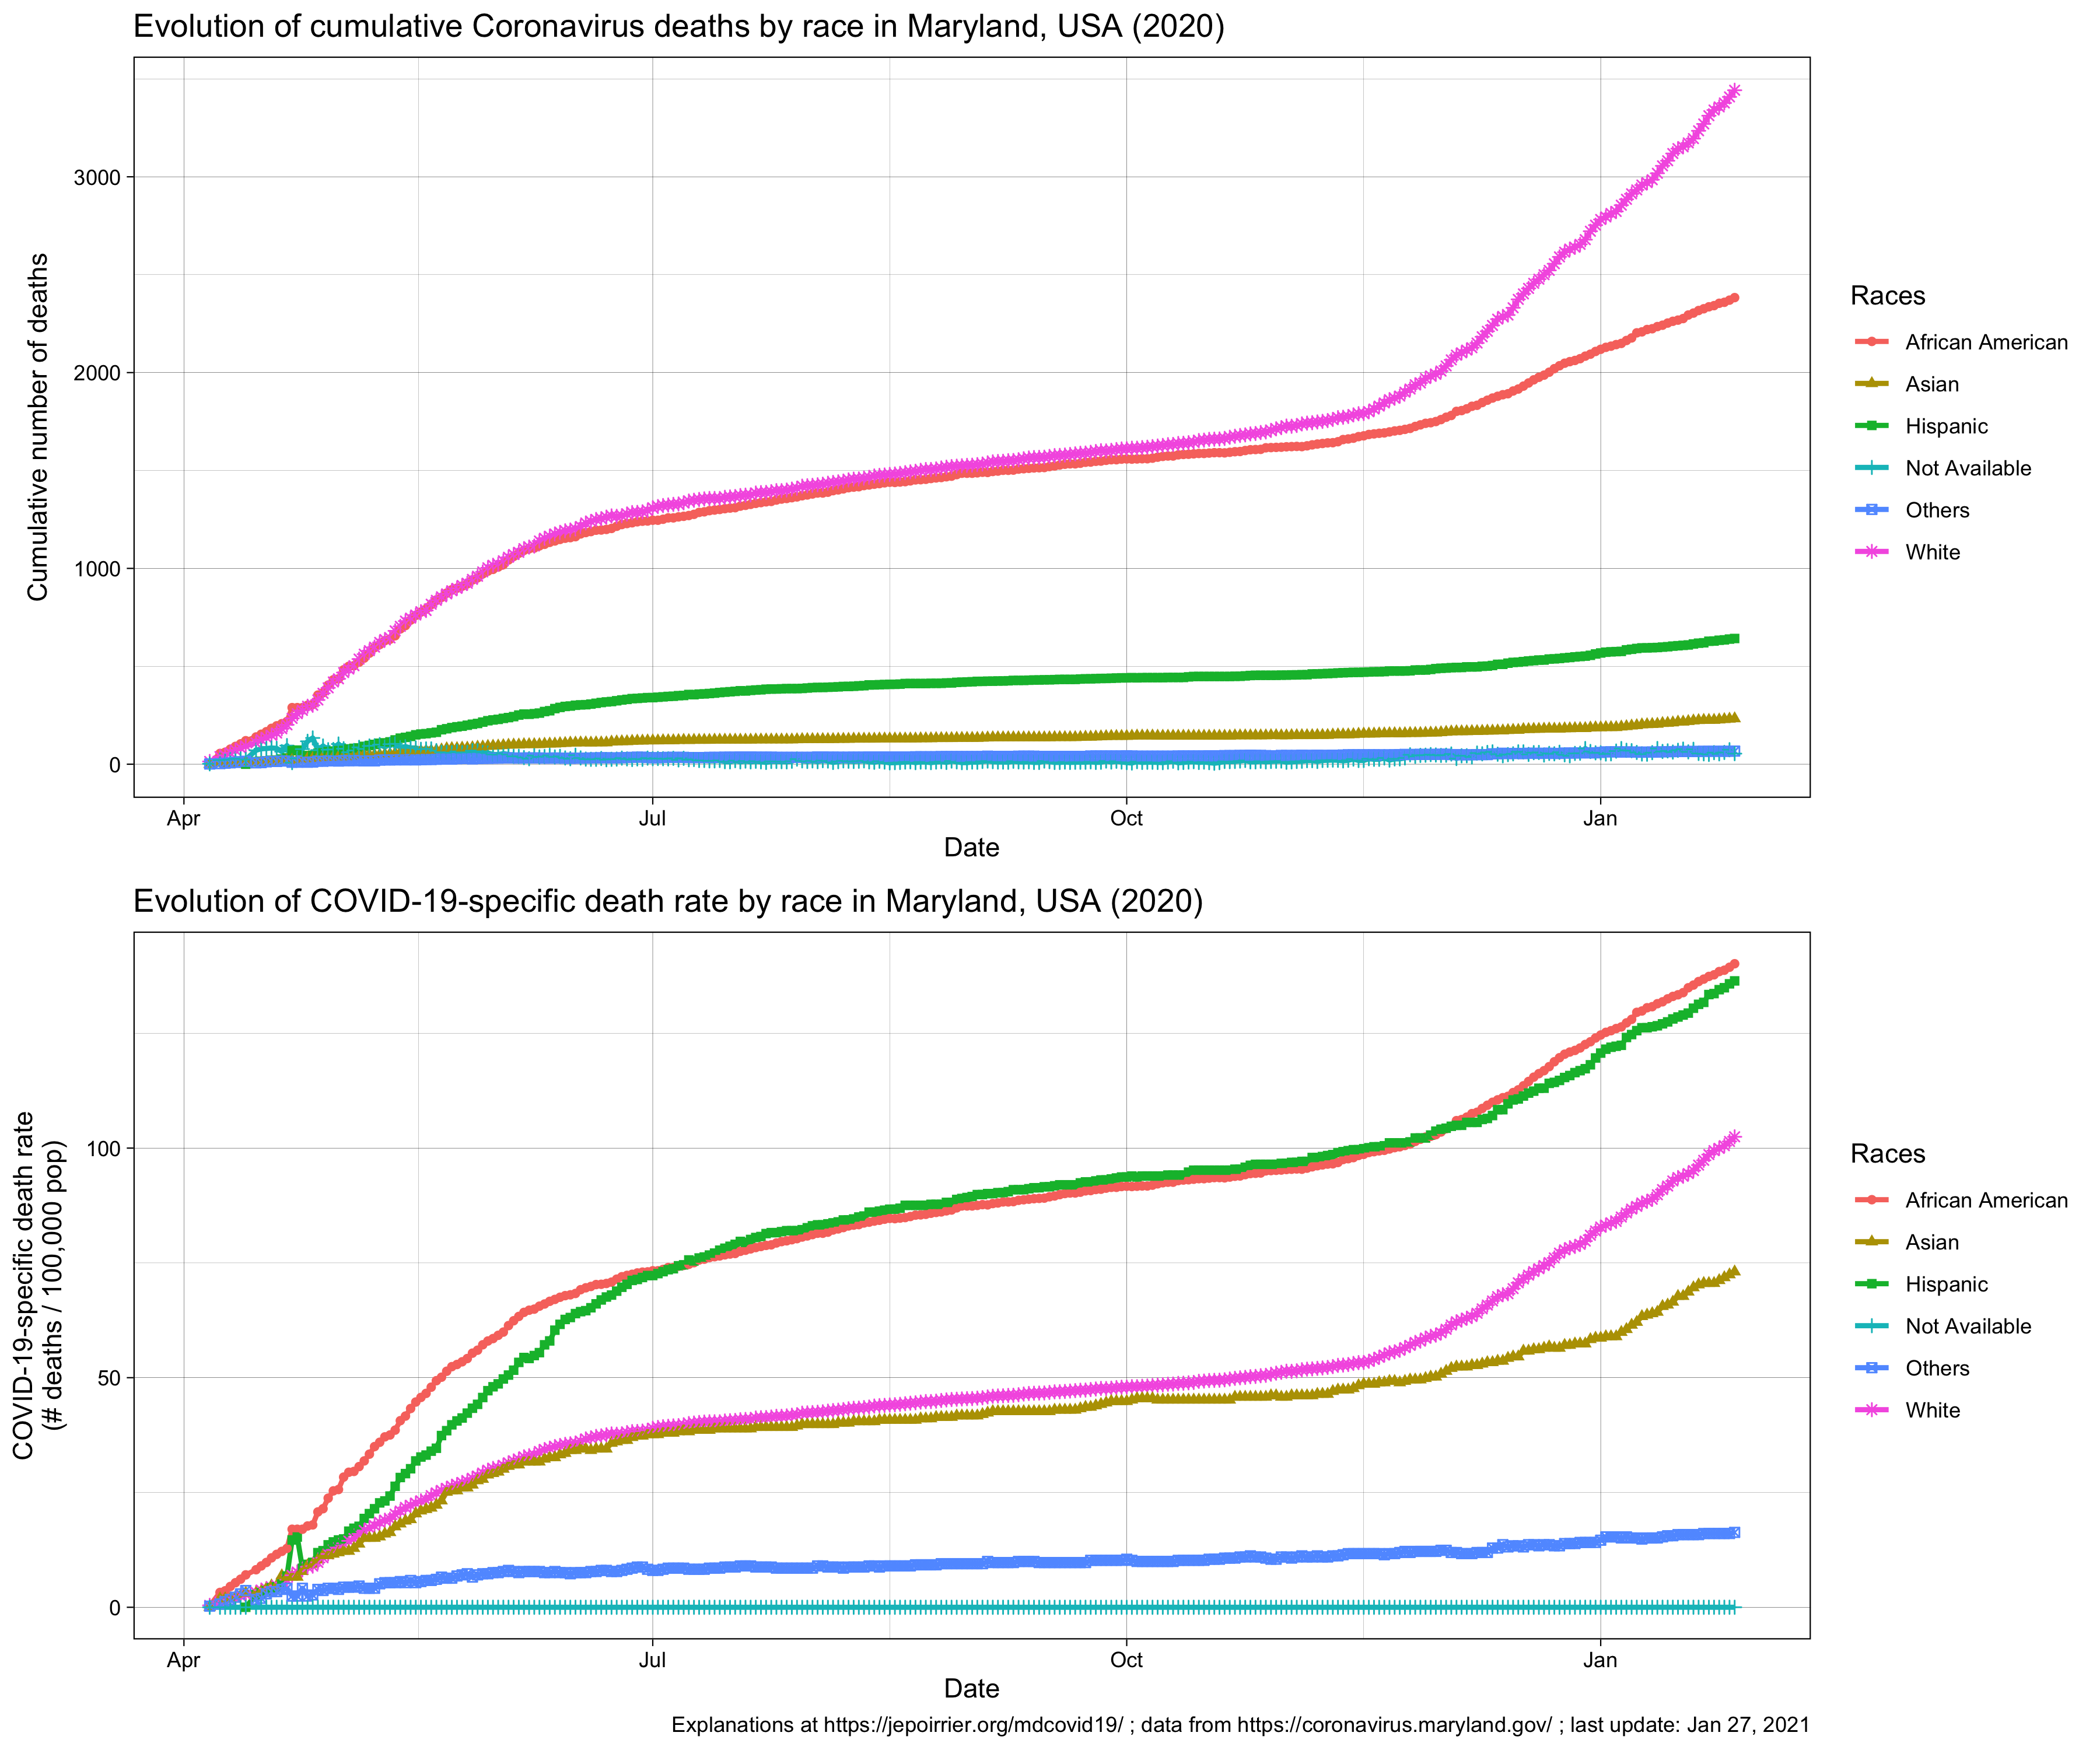
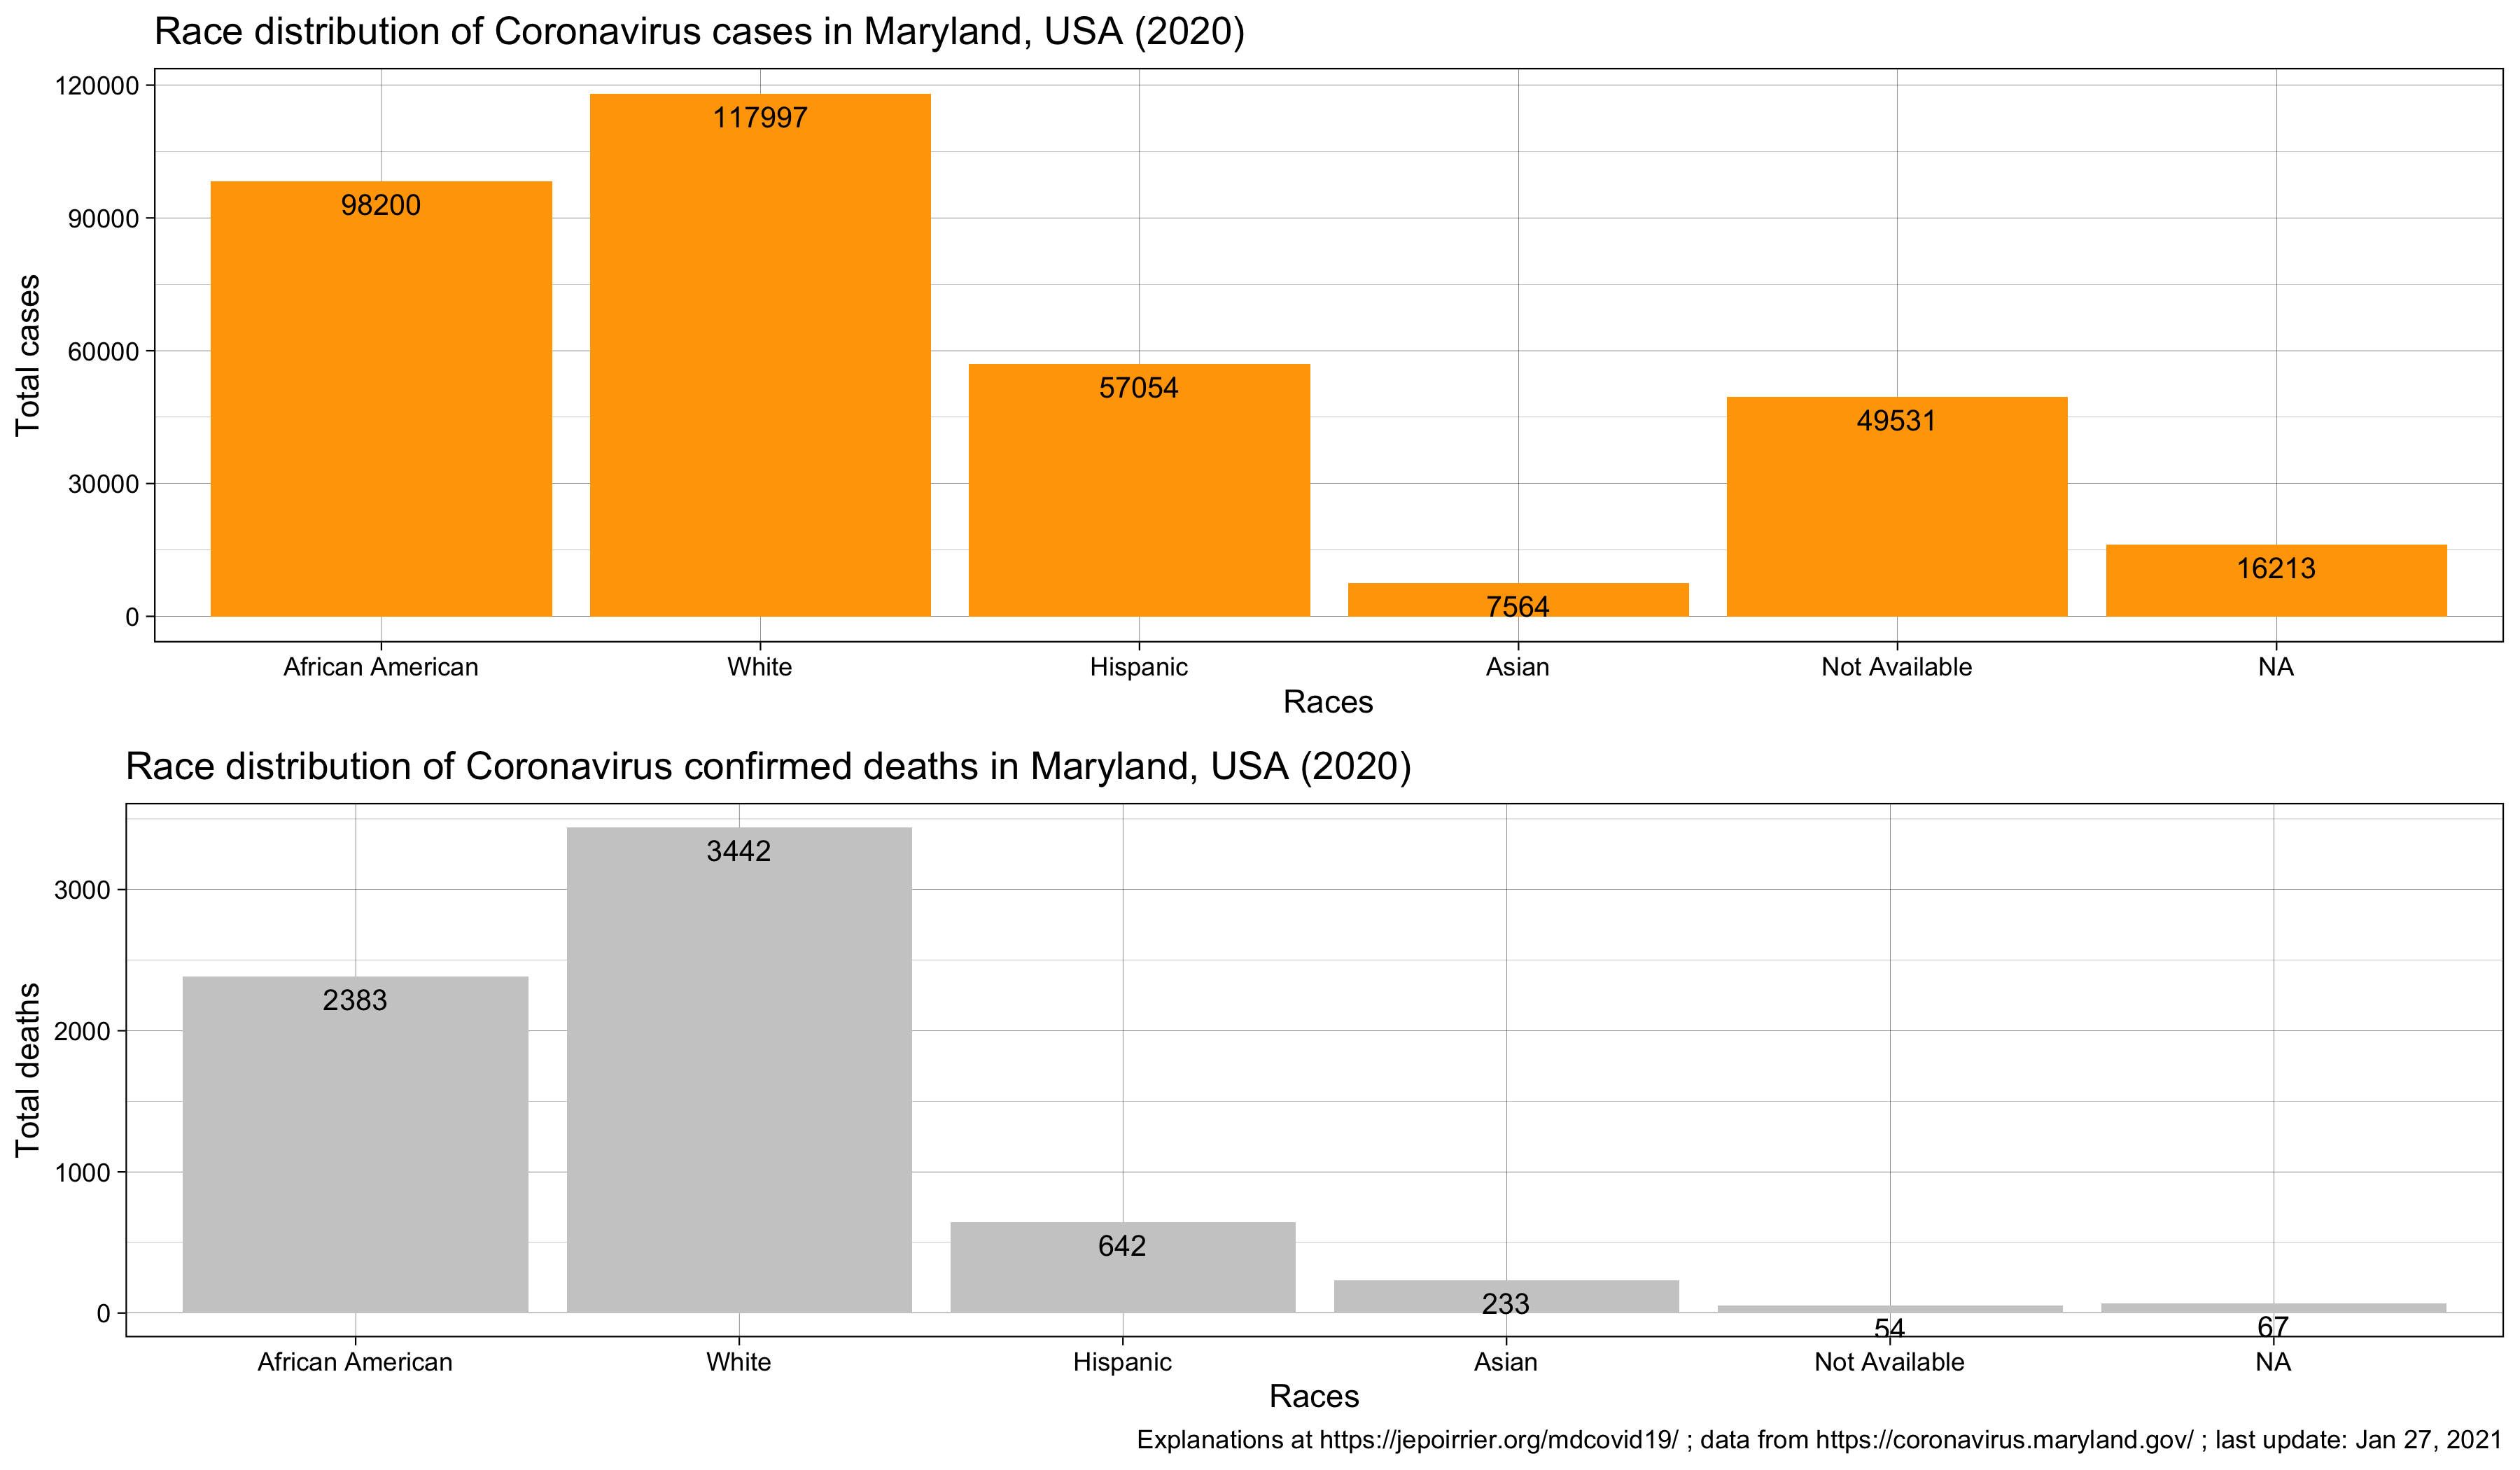
Race
Graphs showing the cumulative evolution of COVID-19 cases by race in Maryland (crude numbers at the top, relative to each population at bottom).Graphs showing the cumulative evolution of COVID-19 deaths by race in Maryland (crude numbers at the top, relative to each population at bottom).Latest snapshot (count) of all cases and deaths due to COVID-19 by race in Maryland. I wrote about inequalities for COVID-19 cases and deaths in June 2020.
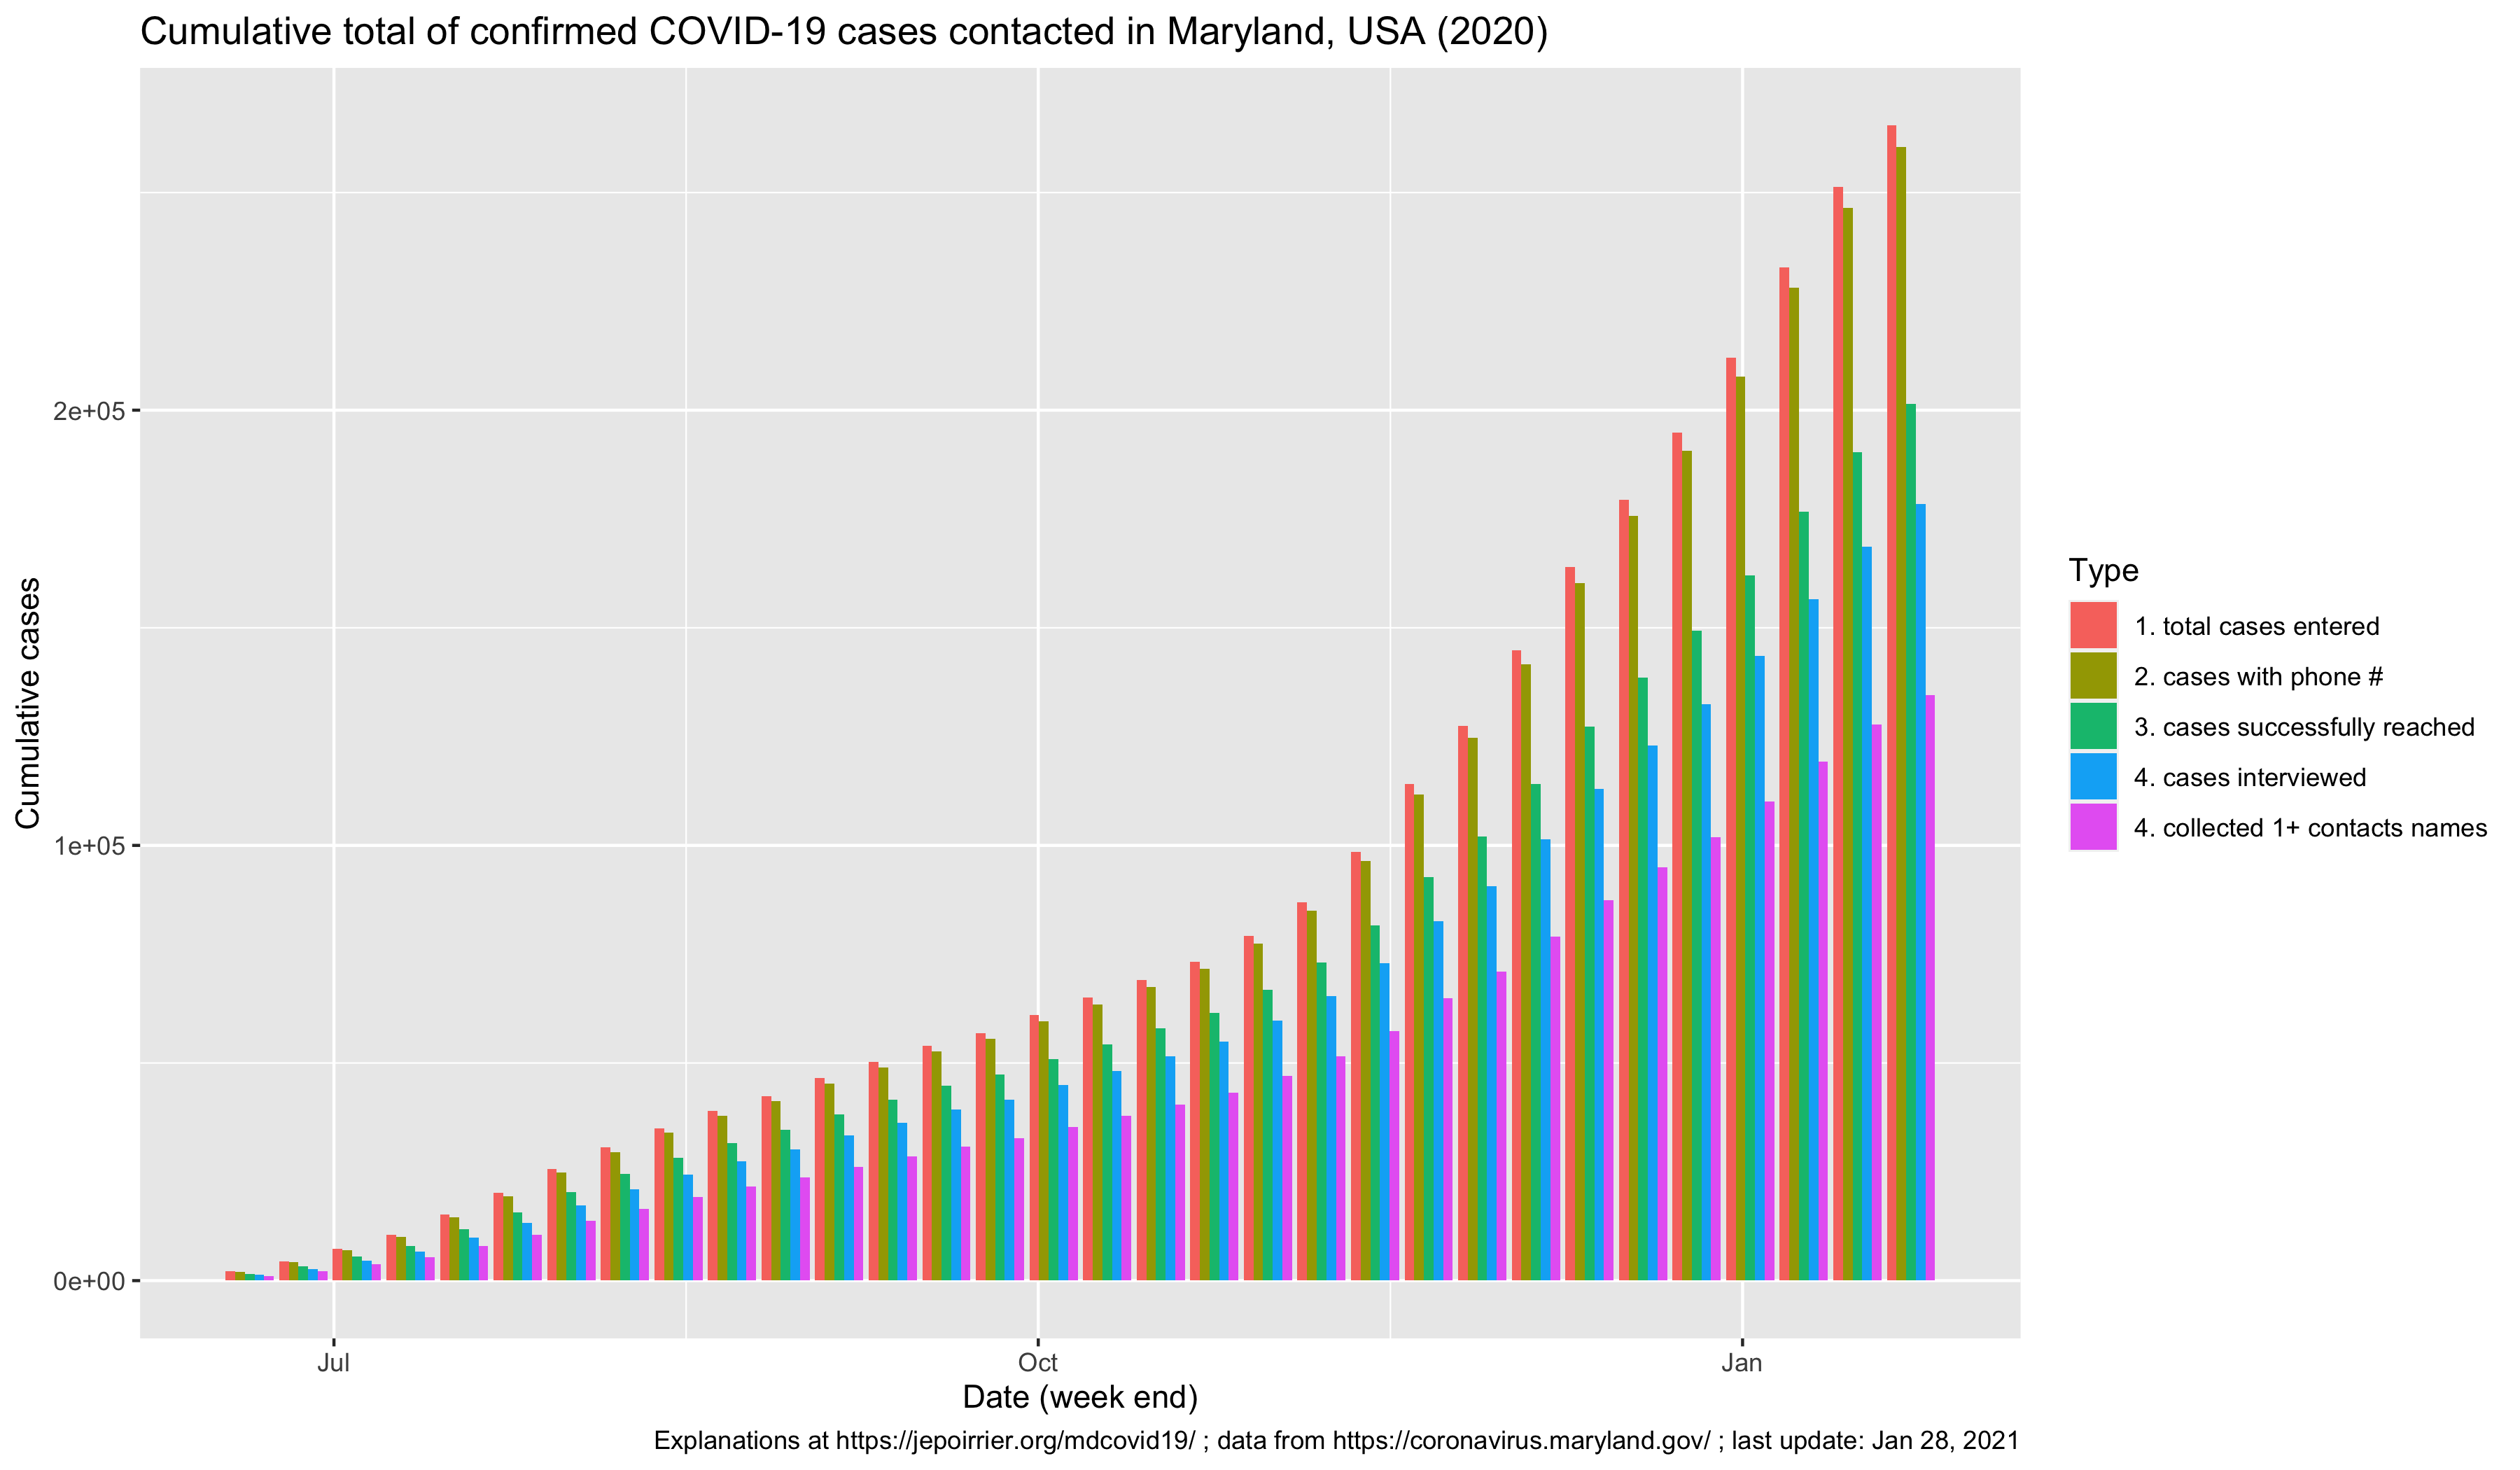
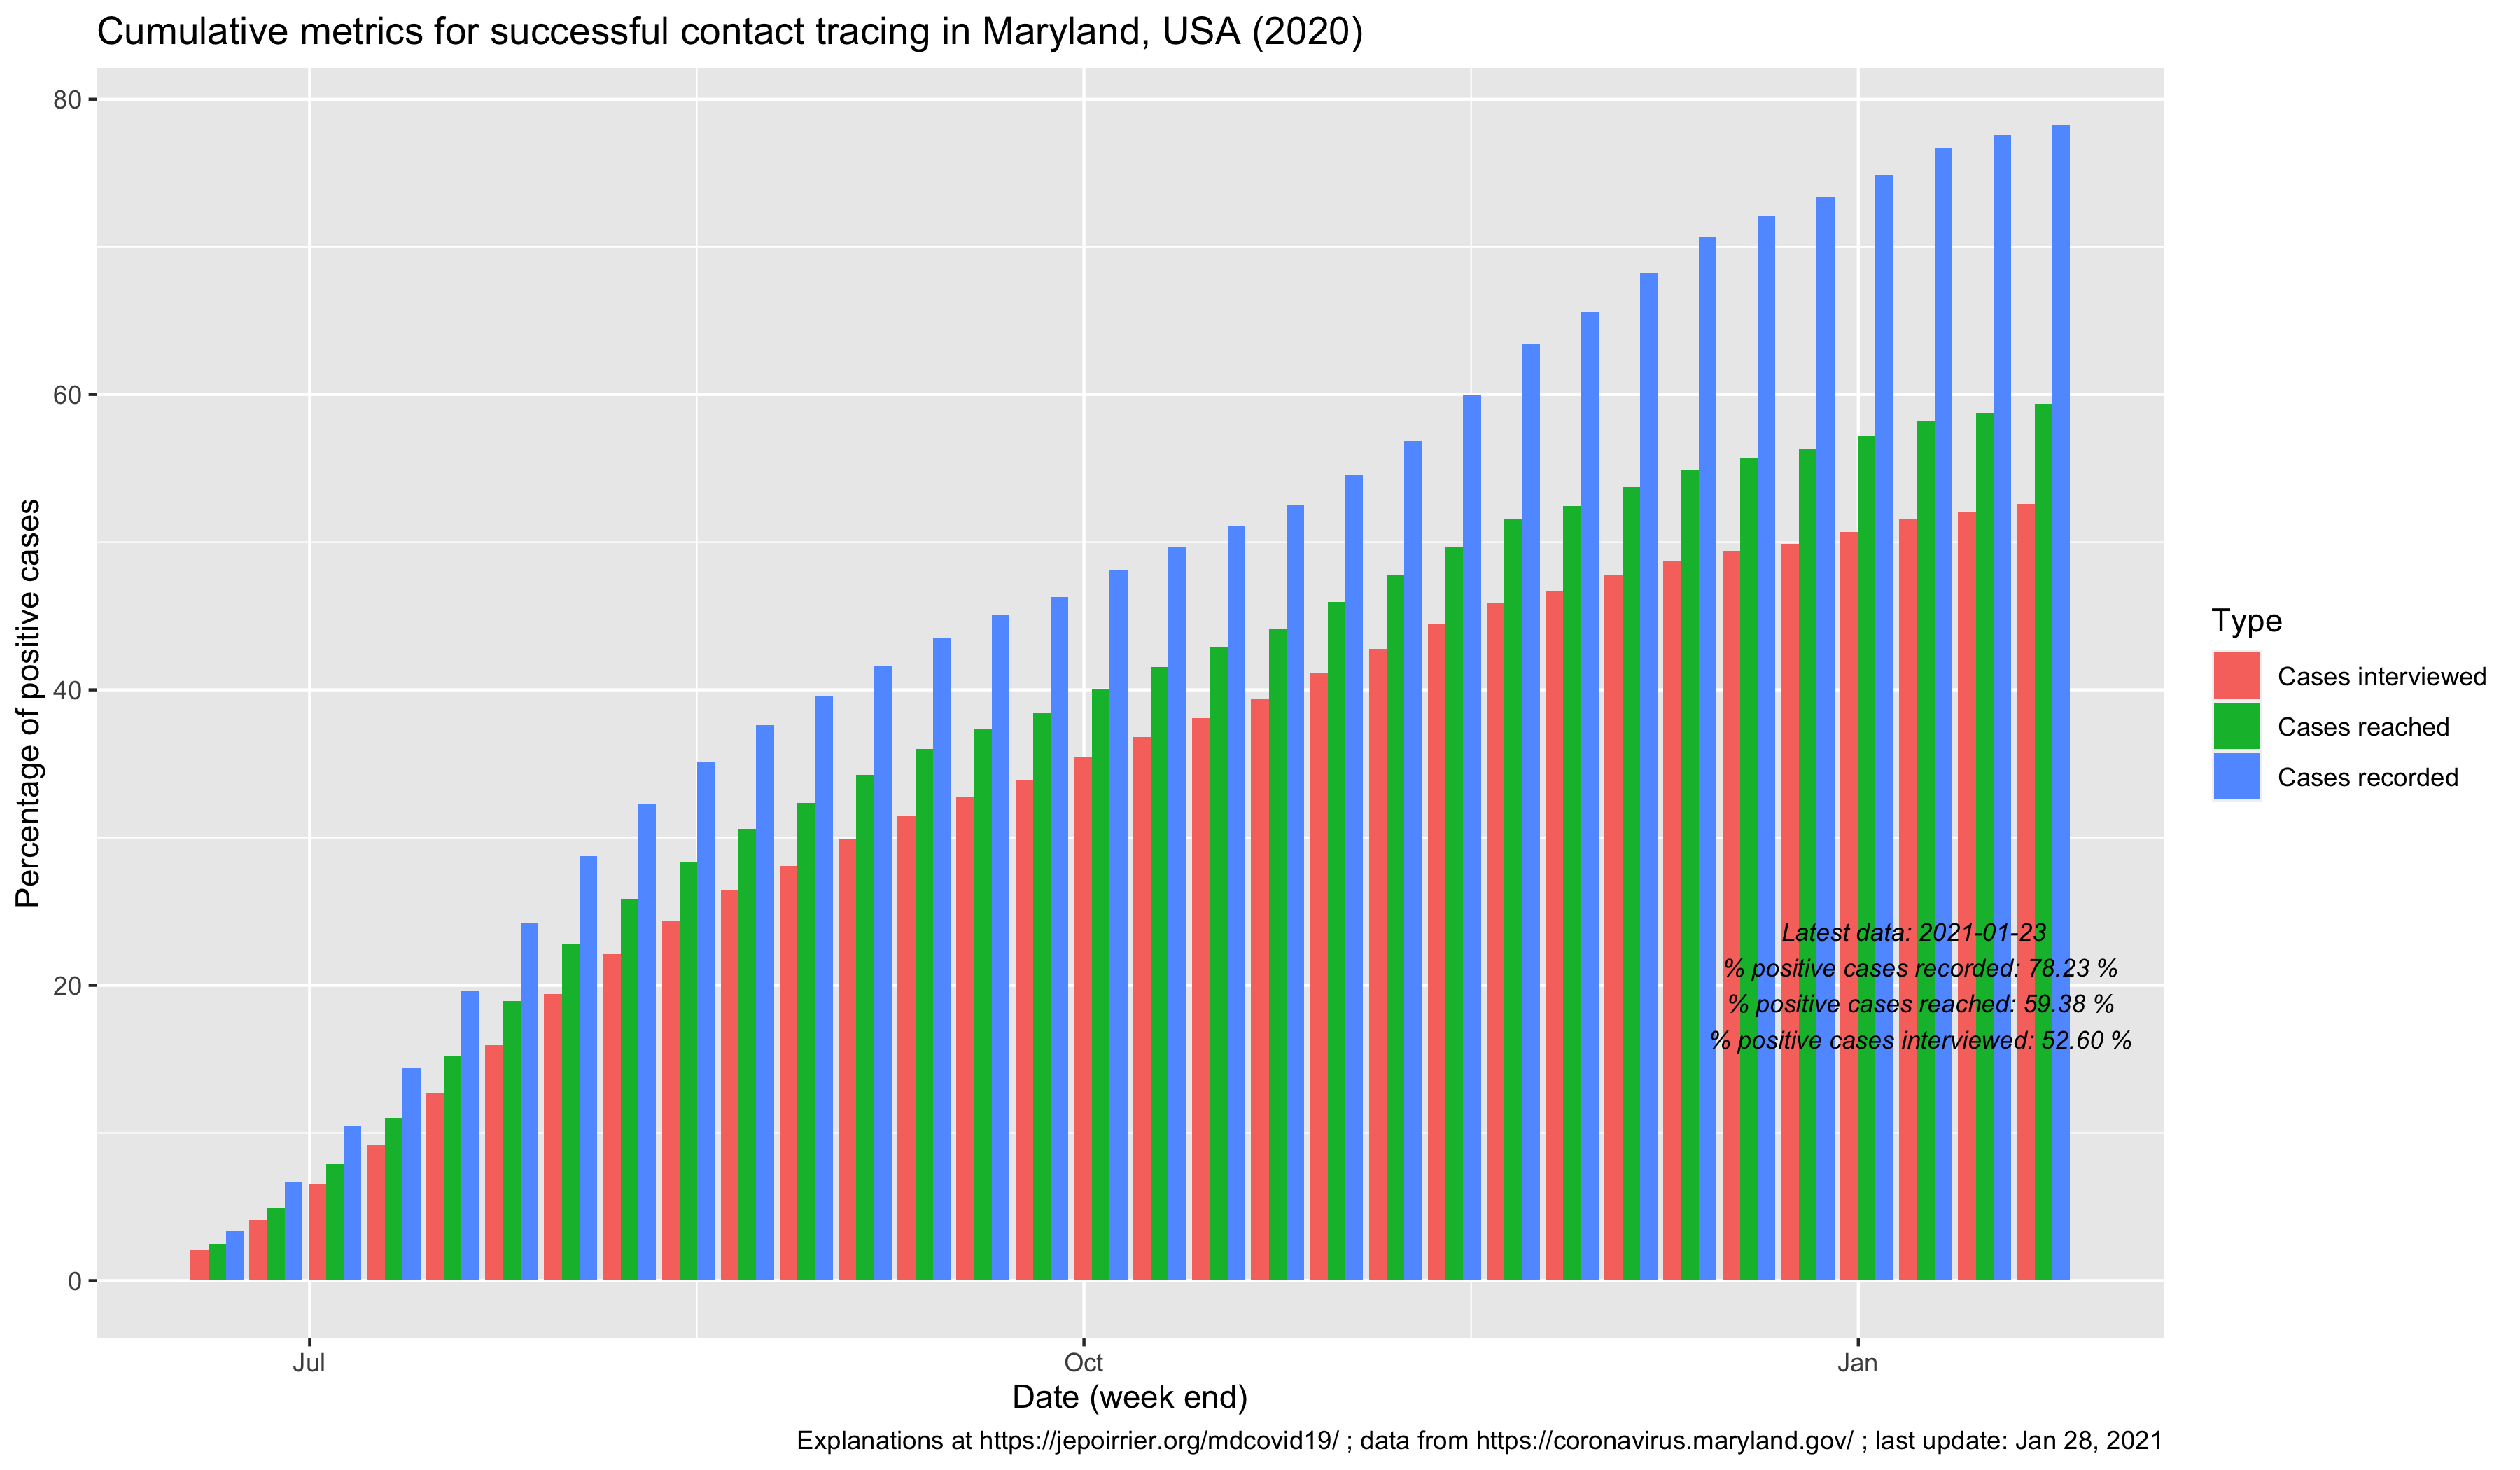
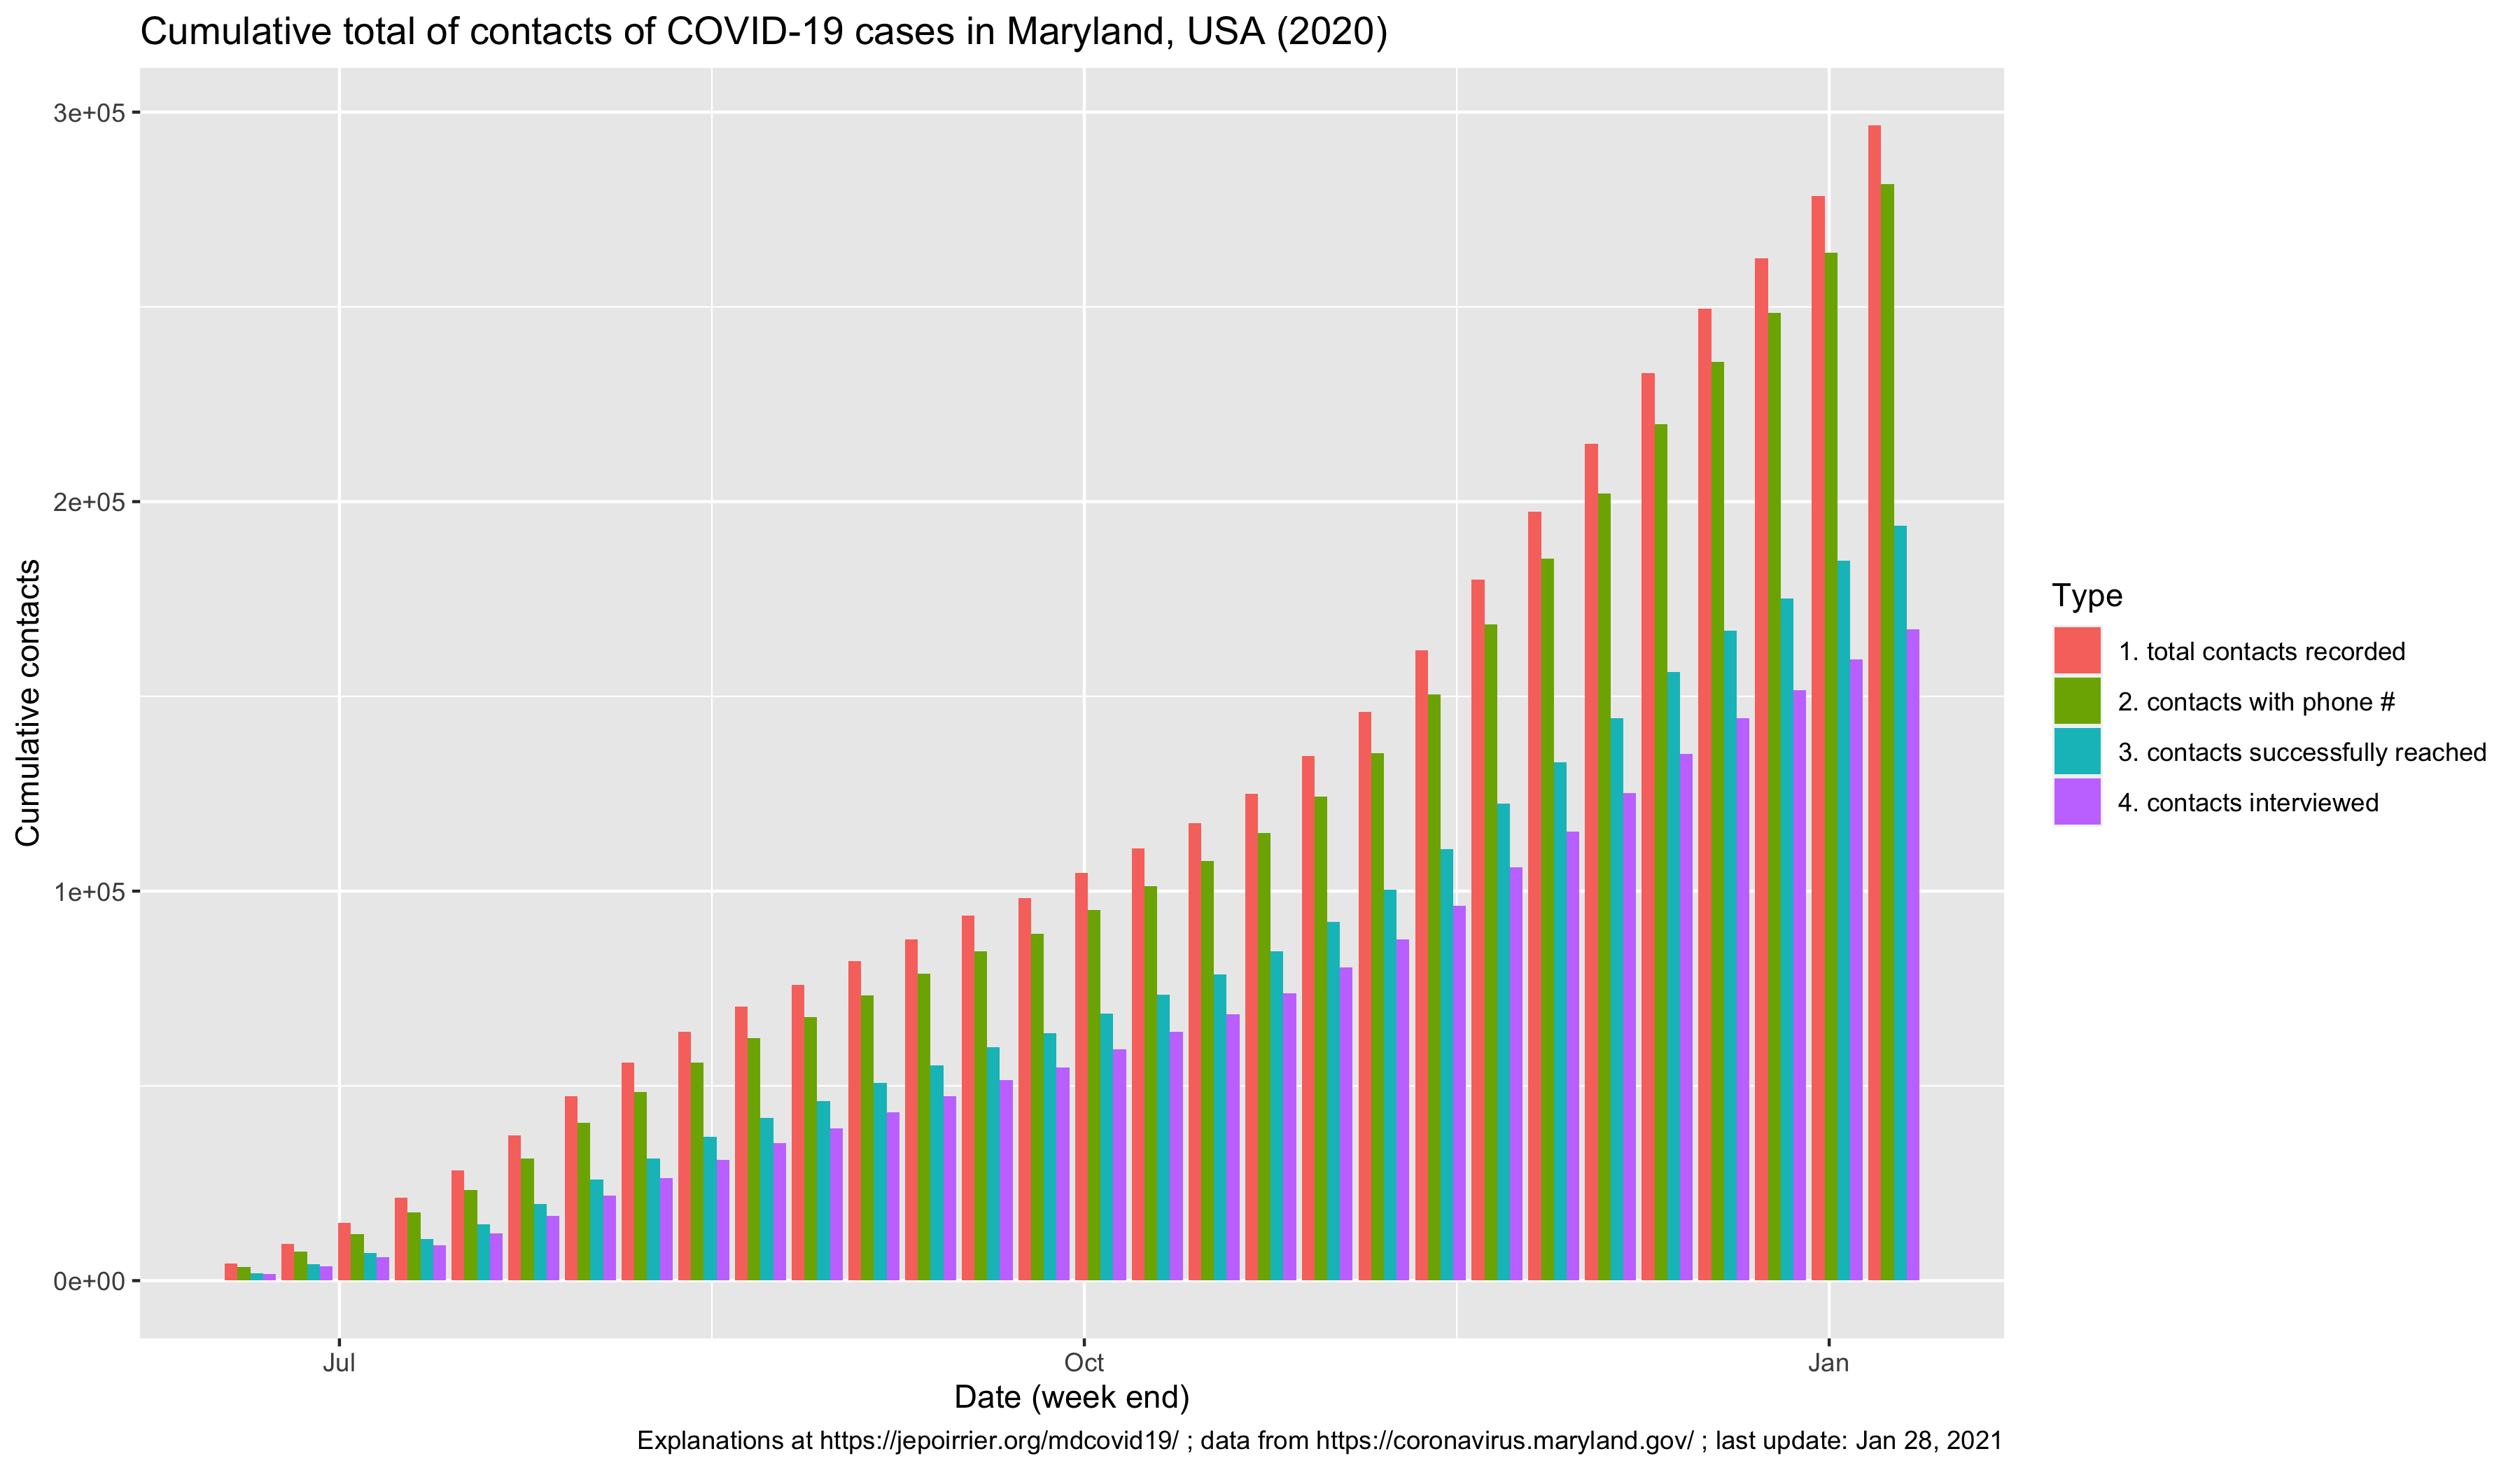
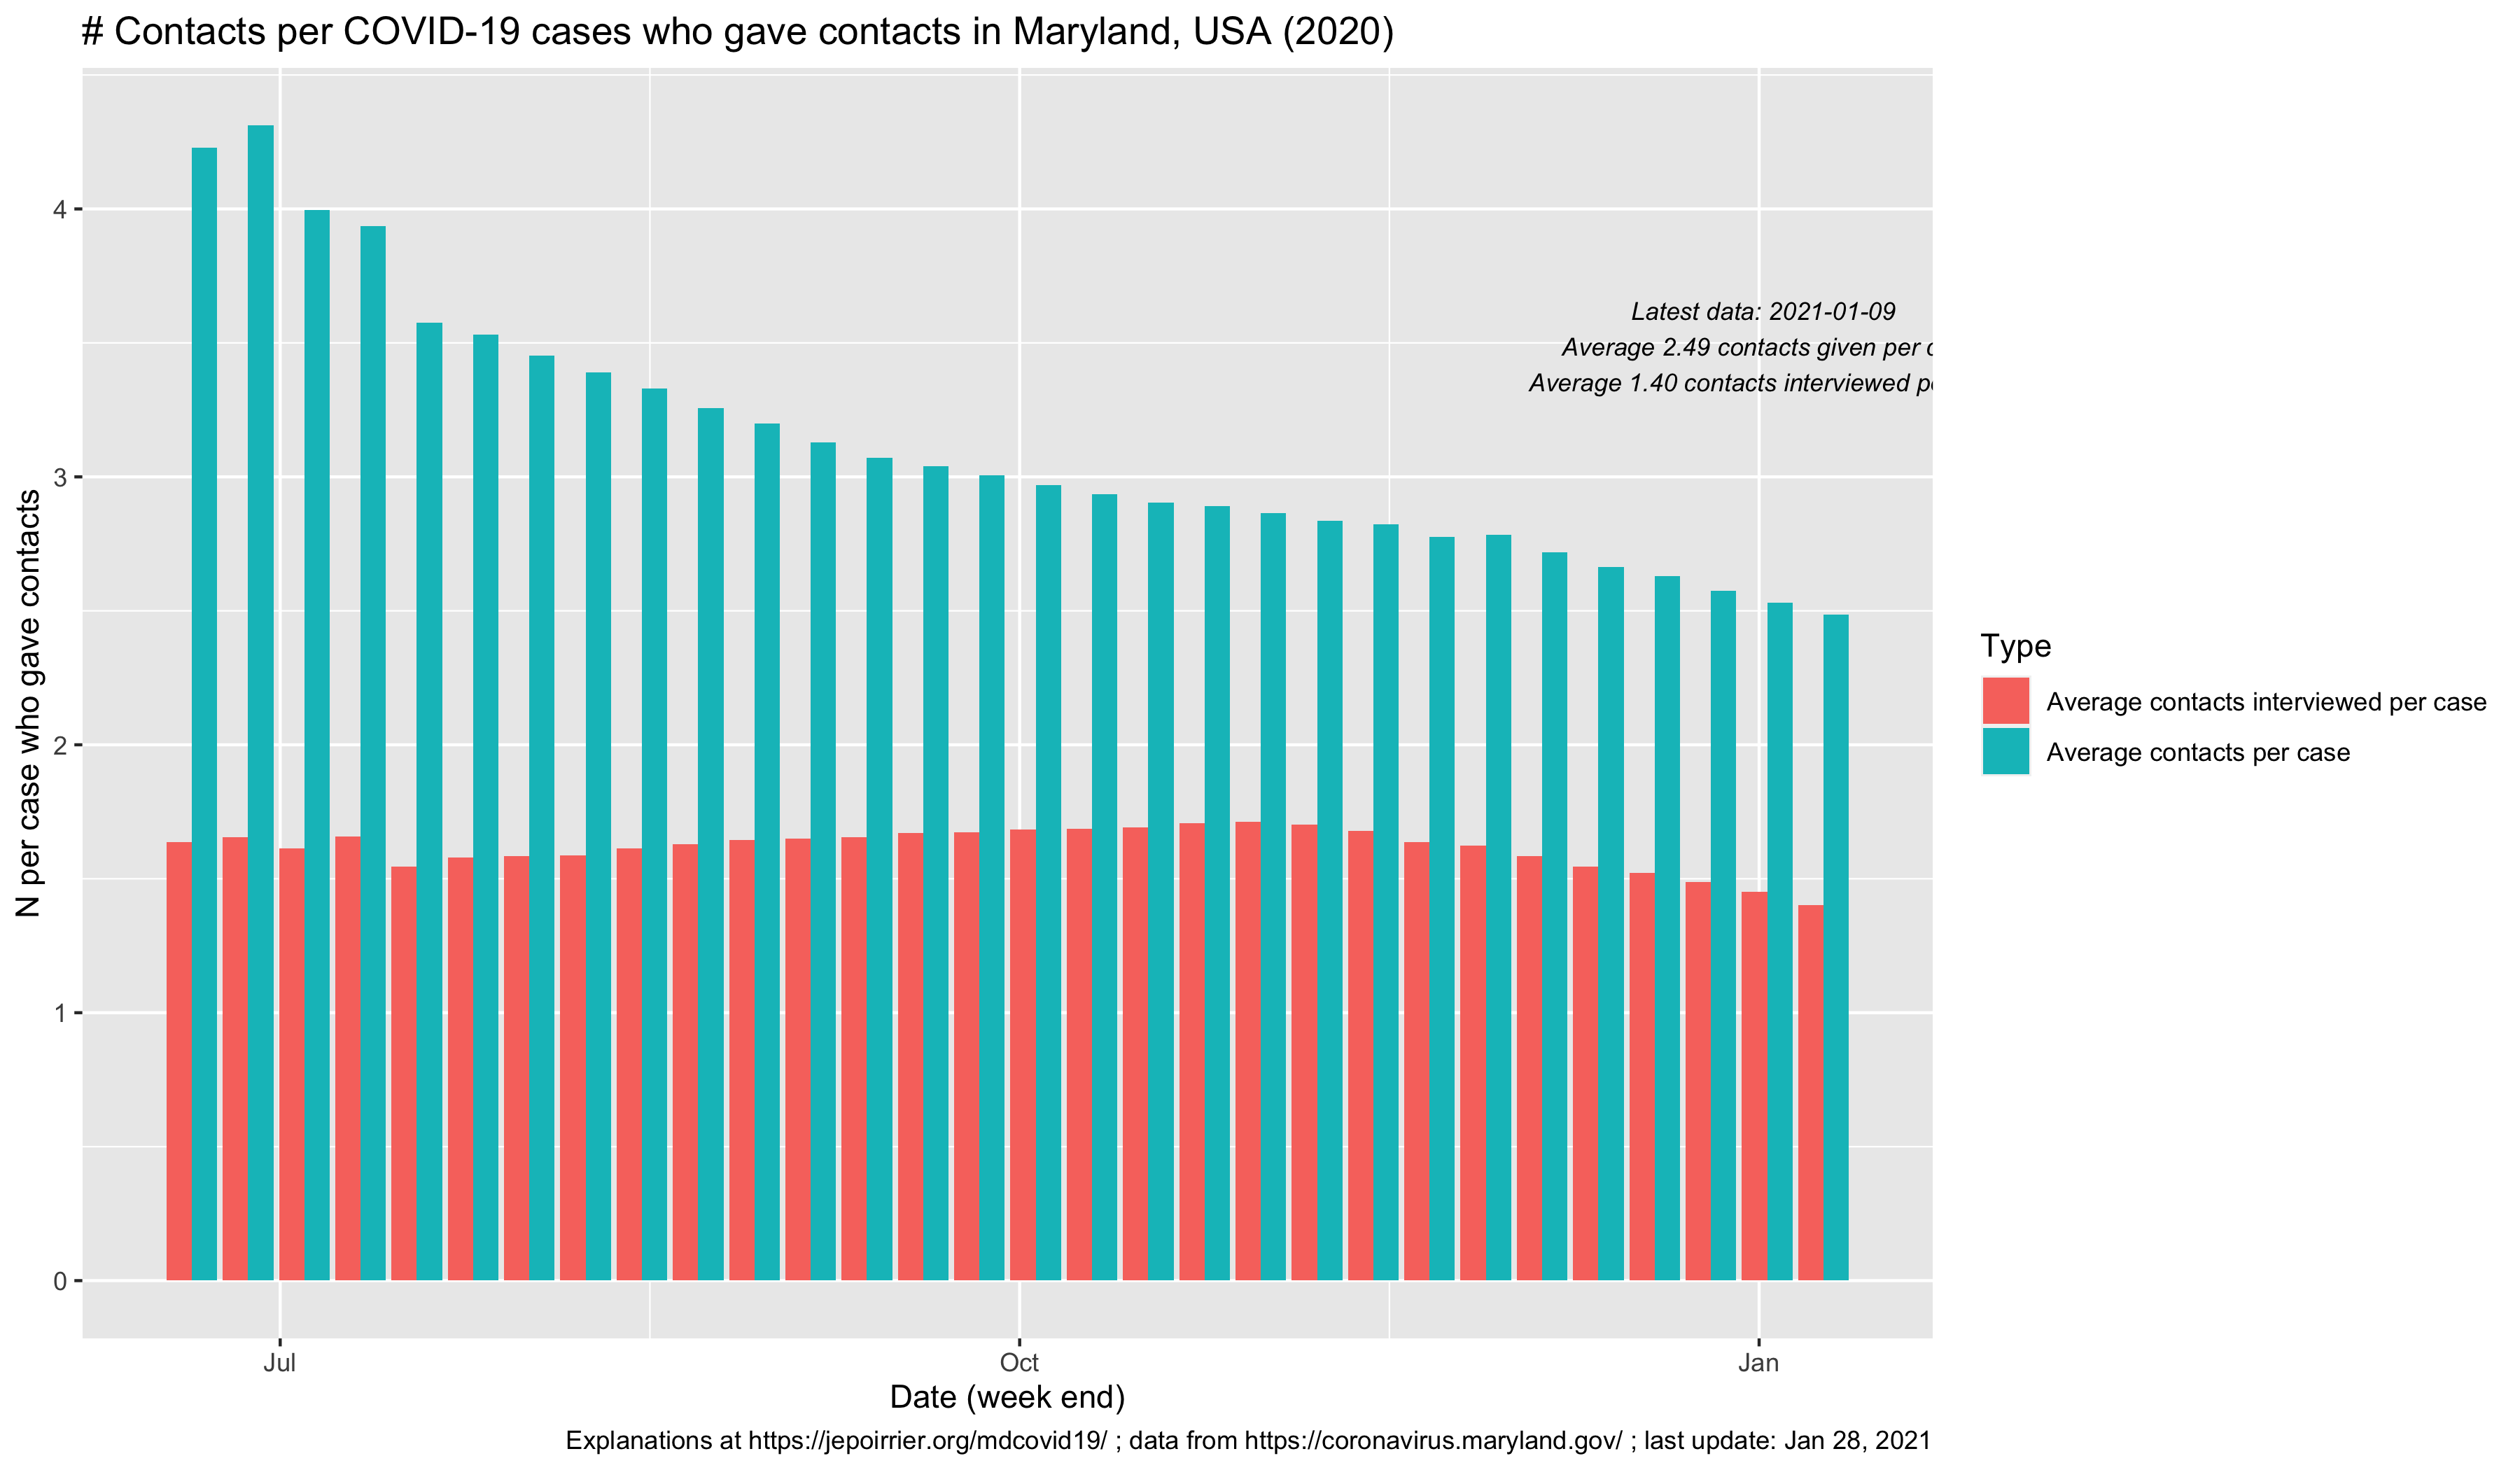
Evolution of contact tracing of COVID-19 cases in Maryland. I wrote about these numbers when they started to become available. The more it increases, the better it is (more cases traced). The more all bars in a group are similar, the better it is (more interviews of cases).Evolution of contact tracing of contact of COVID-19 cases in Maryland. I wrote about these numbers when they started to become available. The more it increases, the better it is (more contacts of cases traced). The more all bars in a group are similar, the better it is (more interviews of contacts).