Tag: Belgium

COVID-19 cases in Wallonia schools

In Wallonia (Southern part of Belgium), universities are already back to only giving online classes, schools will be closed two additional days after the Autumn holidays (so November 2-11), and secondary schools (12-18 years-old children) will be virtual for the 3 days before the Autumn holidays (so October 28-30). The reason? The exploding number of COVID-19 cases in schools.

In Wallonia, education is in the hands of the French-speaking Community (along with Brussels) but its statistics department doesn’t seem to provide public data on COVID-19. For that, we have to look at ONE (roughly: “Office for births and infancy“) that communicate weekly numbers of cases and quarantines in children in schools via press releases (forcing us to parse PDFs but it’s better than no data).

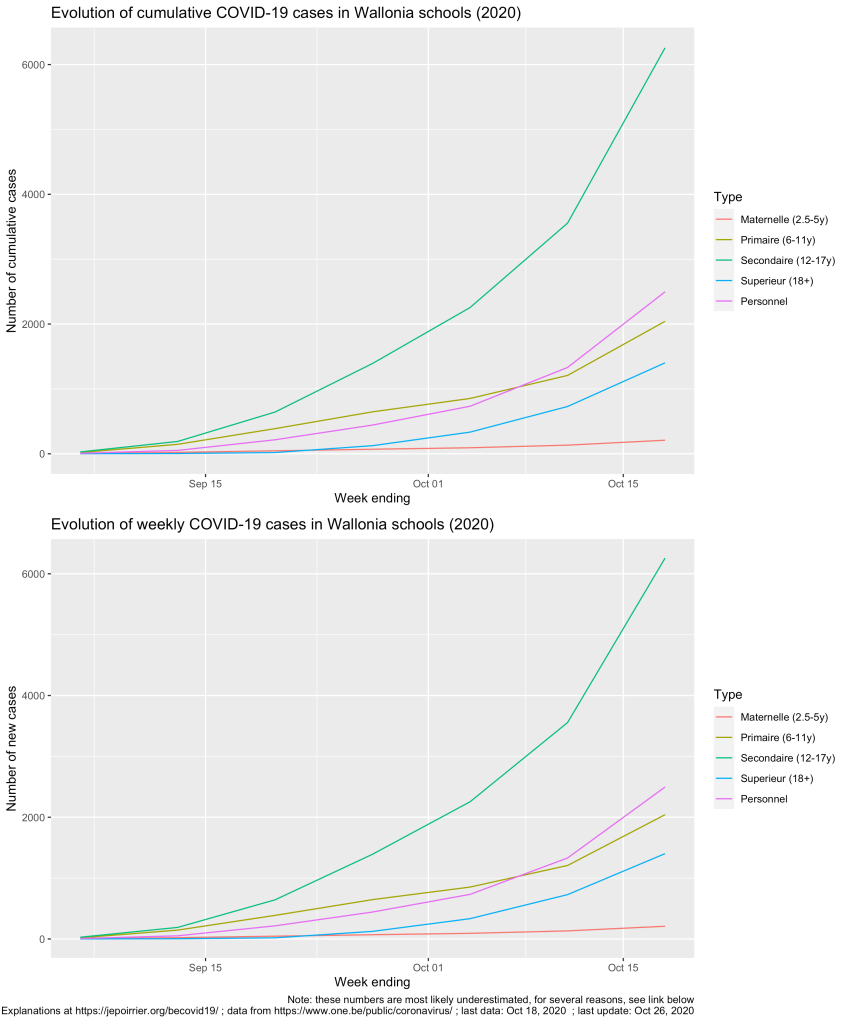
So far, the students in secondary school (12-18 years old) are the worst hit with a total of 6,258 positive cases since September 2020 (I’m writing this on October 27), followed by teachers and other personnel (total: 2,497 positive cases).

Is it a lot? Consider this: for the week ending on October 18, incidence in primary school (6-11 years old) is 365 / 100,000, incidence in secondary school (12-17 years old) is 1,117 / 100,000 while the average incidence over the last 14 days in the whole Belgian population is 1,289 / 100,000 (epidemiological bulletin of Oct. 26). Adolescents are therefore a driver of the incidence.

But one can see on the charts below that all age categories are exponentially seeing new cases:
Unfortunately, when you read the press releases, you realize that these numbers are minima. Indeed, the situation is actually worse but there are several reasons why numbers are not completely reported:

  • Health services in schools are not staffed to face a pandemic, they were not prepared and now some personnel also got the virus.
  • As a consequence, data is not completely transmitted to ONE since mid-October (it’s apparently worse for quarantine data, not shown here: at least 21% of cases don’t have data associated with potential follow-up quarantine in the last (7th) report).
  • Since October 1st, protocols (quarantine decreased at 7 days, definitions of close contact, etc.) changed.
  • Children below 6 years are exceptionally tested.
  • Children between 6 and 12 years (primary school) are tested only if they meet some conditions (symptoms, contacts in the family, or if 2 cases in the class).
  • It seems there are issues with reporting in students 18+ (“écoles supérieures“).
  • Universities are not reported in this count.
  • For adults (here: 18+ students, teachers and personnel), Belgium is back at testing only symptomatic patients since October 19, 2020.

So the additional days of holidays and making a few additional days of virtual school for secondary students is meant to try to break transmission of COVID-19 in schools.

Talking about transmission, it seems there is a kind of exploration on sources of infection in the ONE reports. It is not reported systematically nor in a similar way but the source of infection for reported cases is the school (close contact with a student, a teacher or a personnel) in 16-20% of cases.

I really hope this extended holidays will reduce transmission. It seems the younger a child is, the less symptoms he/she’ll display, it therefore seems ok for them to get the disease. But children remain important transmission vectors and we don’t want them to transmit the disease to more vulnerable groups of the population, like grand-parents but also adults and children with co-morbidities or immune diseases. Let’s not add a COVID-19 burden to the usual disease associated with winter (like flu).

To be continued …

As usual, you’ll find other graphs on my page about COVID-19 in Belgium (and figures above are updated with new data as they appear) and the data, code and figures are on Github (including the AVIQ one in this post).
COVID-19 clusters in Belgium

Recently (I’m writing this on October 20), the (new) Belgian government decided to apply more stringent prophylaxis measures to contain COVID-19. One of the controversial measure is to close bars and restaurants for a month.

Unfortunately, in a way, at approximately the same time, AVIQ released its latest poll on COVID-19 clusters in Wallonia (AVIQ is the Walloon agency for well-being, health, handicap and family). I wrote it was unfortunate because I read and heard several people who criticized the closing of bars and restaurants by citing this poll. But this poll cannot answer in favor or against this closure; it doesn’t look at that …

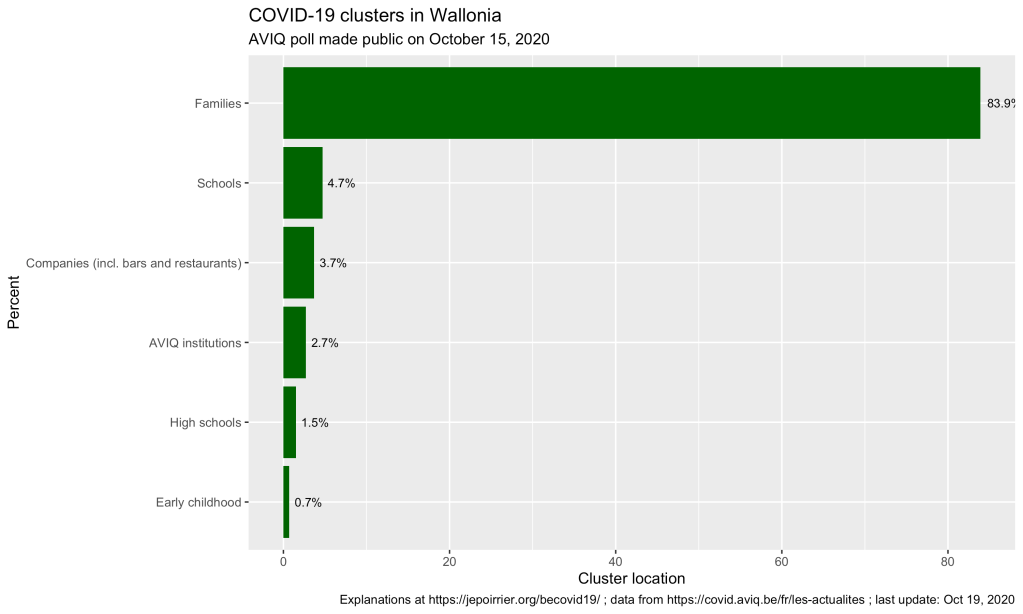
Here are the results:

From the meager press release, here is what we can reconstruct … AVIQ looked at the 5,043 COVID-19 clusters in Wallonia so far and went to interview one or several patients from these clusters (AVIQ defines a cluster as a place where there are 2 or more confirmed COVID-19 cases). The question was, more or less, where did you go before getting COVID-19? (in French: “collectivités que les personnes covid-19 positives ont déclaré avoir fréquentées“).

From there, nearly 84% of clusters were families, far ahead from schools (4%), companies/bars/restaurants (3%), and other places (note schools are still open in Belgium, except universities starting today).

First, bars and restaurants are amalgamated with companies (where home working was encouraged). One cannot easily disentangle them, unfortunately. Then all places are linked and the virus didn’t suddenly appear in the family – but one is more inclined to remember it’s in the family because it is close to dear people (spouse, children, parents, …). Also, there is the potential recollection bias (a classical limitation of interviews), interviewees willing to please the interviewer or simply not willing to disclose behaviors that may be frowned upon. A recent example of this was when the previous Belgian Prime Minister announced she was positive:

This tweet was quickly put in perspective with a plenary meeting of Mrs Wilmès party where the recommended precautions were not all followed:

Well, back to our clusters … My last points for this AVIQ poll is that unfortunately there is no more details than this. We don’t know much about the methodology, it was minimally put in context and there was little caution against wild interpretations (just a “[Ces données] restent toutefois parcellaires compte tenu de ce qu’elles sont déclaratives et tributaires des délais de testing“).

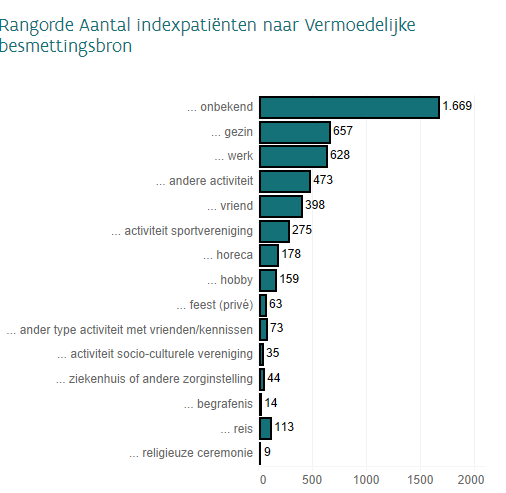
On the other side of Belgium, Zorg en Gezondheid (~AVIQ in the Flemish Region) did a similar poll but gave a bit more details about how they did it and provided more explanations in the results. For instance, they started by asking the index patient where he/she thinks he/she was contaminated: in the chart below, most patients didn’t know (“onbekend” – at least it was an option) but family (“gezin“) and workplace (“werk“) are respectively second and third in the places where they think they most likely got infected (but quite behind “unknown”).

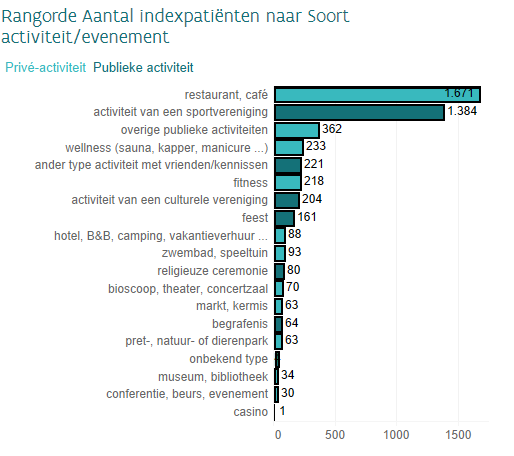
What is interesting is that Zorg en Gezondheid then asked in which social places were these patients before self-isolating. And then we see (below) than most mention bars (“cafés“), restaurants, sports and then only the rather vague “public activities”. It is striking to note that none of these activities are related to school (maybe they only interviewed adults?).

And again, as it was mentioned elsewhere, these are interesting results but it doesn’t show the contagiousness or risk of contamination of these places.

For that, you’ll need serious tracing studies following knows outbreaks. But that’s another story …

To be continued …

As usual, you’ll find other graphs on my page about COVID-19 in Belgium (and figures above are updated with new data as they appear) and the data, code and figures are on Github (including the AVIQ one in this post).
Moving from US to Belgium during a pandemic

We moved our family from the US (Maryland, just in case you didn’t know yet) to Belgium – no big deal. During the COVID-19 pandemic, in July-August 2020 – now we’re talking …

I wrote this post to document our journey. We were (and still are) extremely privileged to have been able to do this, in the conditions we did it. The journey is not over. I’ll update and continue to document it until we fall back into something more “normal” … [long post]

Continue reading “Moving from US to Belgium during a pandemic”

Euthanasia in the Netherlands and Belgium, 1990-2015

While parsing the general literature, I found this paper from van der Heide et al. (2017) giving some numbers about end-of-life decisions in the Netherlands these past 25 years. I was wondering if one could see similar evolution in Belgium. And I didn’t have to look very far: van der Heide cited another NEJM paper with Belgian numbers (Chambaere et al., 2015 ; an attentive reader will notice “Belgian” data is “only” about Flanders, not the whole Belgium).

If you put together the data about euthanasia itself (not counting other type of end-of-life assistance), you obtain approximately the same proportion and evolution:

euthanasia_NL_BE

I’m not aware of more recent Belgian data using the same methodology (i.e. physician interviews). The Belgian Commission fédérale de Contrôle et d’Évaluation de l’Euthanasie (CFCEE) presented its last report in October 2016. This report contained numbers for years 2014 and 2015. But these numbers were related to euthanasia that were officially requested (and granted) by the Commission. For instance, the Commission granted 1 928 euthanasia for a total of 104 723 deaths in Belgium in 2014 (i.e. 1.84% ; deaths in Belgium in the Open Data repository). If we focus only on requests written in Flemish, we find 2.59% of euthanasia in 2014 (1 523 euthanasia for a total of 58 858 deaths) (note: Flemish is the language spoken in Flanders – the region targeted by interviews in the Chambaere et al. paper – but requests in Flemish might have originated from other regions). One might have found different numbers if one would have used interviews like van der Heide or Chambaere.

Dataset (note there is more data in a Wikipedia article)

Evolution of the number and causes of death in Belgium (2010-2014)

Statbel, the Belgian governmental organisation for data and statistics, just released mortality data for 2014 (press release in French, dataset). The headline of their press release was that, for the first time, tumors were the first cause of death for Belgian men. Diseases of the circulatory system remains the main cause of death in Belgium, for women and for both sex together.

While the death of someone is a bad news in itself, I’m more interested here in the evolution of death causes. I’m interested in the evolution of causes of death because it might be a consequence of the evolution of the Belgian society and, as a proxy, of any (most) developed, occidental countries.

If you look at the data, the number of Belgians dying is stable and natural death is still the main cause (and also stable, around 93%). Note that if we look at data before 2010, it seems that mortality is slightly increasing since around 2005.

Evolution of the number of deaths in Belgium, all causes, 2010-2014

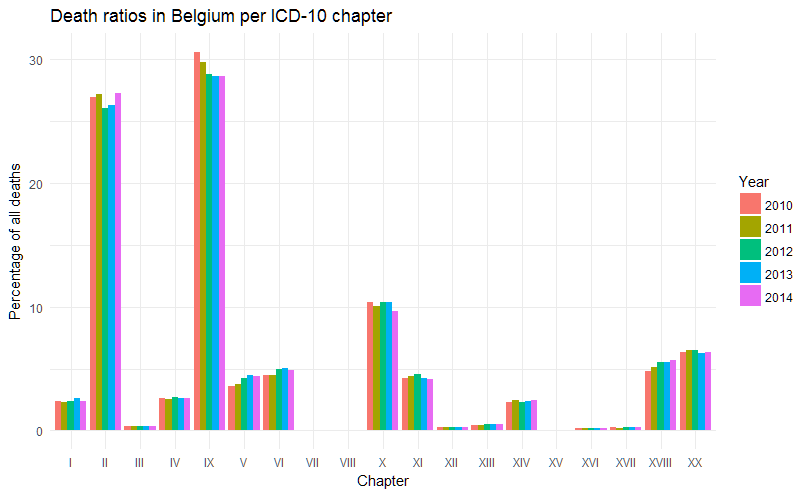
If the total number of deaths seems stable, the press release seemed to indicate that tumors (cancers) are on the rise, especially in men. The breakdown in categories is made following the international classification ICD-10 and, because the names of the different chapters are quite long for graphs, I will use the corresponding chapter numbers instead. Here is the key:

Chapter Header
I Certain infectious and parasitic diseases (A00-B99)
II Neoplasms (C00-D48)
III Diseases of the blood and blood-forming organs and certain disorders involving the immune mechanism (D50-D89)
IV Endocrine, nutritional and metabolic diseases (E00-E90)
V Mental and behavioural disorders (F00-F99)
VI Diseases of the nervous system (G00-G99)
VII Diseases of the eye and adnexa (H00-H59)
VIII Diseases of the ear and mastoid process (H60-H95)
IX Diseases of the circulatory system (I00-I99)
X Diseases of the respiratory system (J00-J99)
XI Diseases of the digestive system (K00-K93)
XII Diseases of the skin and subcutaneous tissue (L00-L99)
XIII Diseases of the musculoskeletal system and connective tissue (M00-M99)
XIV Diseases of the genitourinary system (N00-N99)
XV Pregnancy, childbirth and the puerperium (O00-O99)
XVI Certain conditions originating in the perinatal period (P00-P96)
XVII Congenital malformations, deformations and chromosomal abnormalities (Q00-Q99)
XVIII Symptoms, signs and abnormal clinical and laboratory findings, not elsewhere classified (R00-R99)
XX External causes of morbidity and mortality (V01-Y98)

One thing to notice is that, for chapter IV, Statbel only counts categories E00 to E88 while the WHO includes 2 more, from category E00 to E90 ; I would assume here that it has no important impact. Also note that, below, R ordered the chapters in a strange way – I’ll see how to fix that.

Excluding natural causes, we see that indeed, diseases of the circulatory system (chapter IX) are still the first cause of death, followed by neoplasms (chapter II) and diseases of the respiratory system (chapter X). If we compare the relative ratio of all these causes (second graph below), we also find the same conclusion – but the relative decline in deaths due to diseases of the circulatory system is better shown. And we can see that neoplasms take back approximately the same relative percentage of death, in 2014 (although they returned to the absolute number of deaths of 2012, approximately).

Causes of death in Belgium, 2010-2014

Causes of death in Belgium, 2010-2014, relative numbers

The available data set doesn’t go into more details than numbers by ICD-10 chapters. Therefore we cannot tell from that what kind of neoplasm is the most prevalent or what kind of infectious disease is the most present in Belgium, for instance. The press release however mentions that respiratory, colorectal and breast cancers are the top three killers and that flu was not very present in 2014.

As the cancer occurrence is increasing with age, and as the Belgian population is aging, one of the explanation for a high number of deaths due to neoplasms can be age ; however we don’t see a dramatic increase of neoplasms (fortunately!). Another potential factor is the impact of screening for cancers. Due to a very intelligent political split (sarcasm!), prevention (and therefore screening) is not a federal duty. Therefore regions started different screening programs, at different times, with different results. Screening data and their results are therefore difficult to obtain. The Belgian Cancer Registry doesn’t publish data on screening in oncology – although its latest report (revised version of April 2016) very often mentions screening as a main factor for change in the number of cases diagnosed. In its 2016 report (PDF), the Flemish Center for the Detection of Cancer (Centrum voor kankeropsporing) indicates that they increased the number of women screened for breast cancer by more than 8% between 2011 and 2015 (especially in 2015), with a quality of test between 90% and 95%. They also showed an increase in cancer diagnostics (without linking it directly to the increase in screening).

screening-flanders

This is by no means an exhaustive review of the data. There are other potentially interesting things to look at: the geographical disparities between the three regions, the gender ratio evolution (as some of these diseases are known or by definition affecting more one sex than the other), etc.

It would also be interesting to follow these trends as some changes occurred recently in the Belgian curative landscape. New drugs in cancer immunotherapy were recently authorised and reimbursed, for melanoma, lung – and other indications will follow. These costs have a price (less than what is in the press, however, I may come back on this in a future post) but they delay death (unfortunately they don’t avoid it). However, for some of them, in some indications, their administration and reimbursement is sometimes also linked with screening, testing and prior treatment failure ; that might decrease their impact on overall mortality. New drugs for Hepatitis C also arrived in 2015 and 2016 and the Belgian health minister decided to reimburse these drugs for patients in their early stage 2 of the disease. Studies showed that treating at this stage may prevent hepatitis C from progressing to later stages and, in some cases, studies showed patients cured from the disease. This is an opportunity to see a decline in mortality due to this infectious disease (although it is already quite low – compared to other diseases).

About antibiotic resistance and the price of drugs

Many headlines stated today that UK wants to tax pharmaceutical companies again in order to contribute to a pooled fund against antimicrobial resistance (AMR). The proposed ‘pay or play’ mechanism is a bit more subtle than that. The report (full text here) is also suggesting other financing mechanisms (including the improvement of existing ones) as well as describing potential non-financial measures to reduce these resistances in the first place. Actually, financial measures occupy only about 6% of the report. But headlines need to be catchy. Let’s see a broader picture on tackling antibiotic resistance …

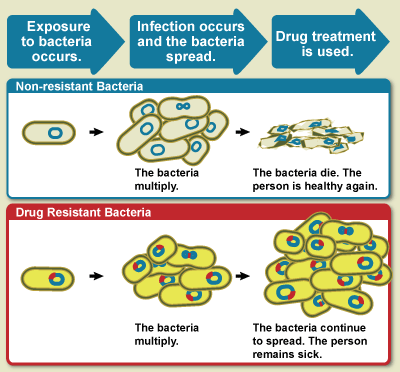
The WHO summarizes well the situation: “Antibiotics are medicines used to prevent and treat bacterial infections. Antibiotic resistance occurs when bacteria change in response to the use of these medicines. Bacteria, not humans, become antibiotic resistant. These bacteria may then infect humans and are harder to treat than non-resistant bacteria. Antibiotic resistance leads to higher medical costs, prolonged hospital stays and increased mortality.

An illustrative diagram that shows the difference between a drug resistant bacteria and a non-resistant bacteria.

For Belgium, the Joint Programming Initiative on Antimicrobial Resistance displays a long list of governmental bodies and initiatives that study and/or tackle AMR. The Belgian Scientific Institute of Public Health has a dedicated program against AMR. Despite that, a recent study showed that, in 9 European countries, 99% of bacteria Streptococcus pneumoniae taken from nose of people aged 4 or more show antibiotic resistance (S. pneumoniae causes many types of pneumococcal infections like pneumonia or meningitis). The same study showed that Belgium has the worst resistance rate against the antibiotic cefaclor (fortunately authors also show there is little resistance against the most common antibiotics used against S. pneumoniae). A study from last year in 8 European countries (including Belgium) showed that approximately 4 out of 5 Staphylococcus aureus (another bacteria) isolates from individuals without specific health issues were resistant to at least one antibiotic and more than 7% of them are multidrug resistant. And we are talking here about Belgium, a country with a well developed healthcare system, following best practises in antibiotic stewardship and often considered as an example for the reduction of antibiotic consumption outside hospitals.

B0006889 MRSA

Coming back to the UK report, a big part of it advocates more or less what the 2015 WHO country situation analysis on antimicrobial resistance described too: countries need a plan to fight AMR, surveillance and laboratory capacities should be raised (no data = no knowledge of the situation and no capability to measure progression), antimicrobial medicines should be correctly used, public awareness campaigns should be deployed, and the prevention and control of infections allow to tackle the issue at the source.

The question raised in the report is also how to accelerate the discovery of new antimicrobial medicines? The report advocates for a “global innovation fund for early stage and non-commercial R&D”. And it correctly points that there are currently little incentives for companies to invest in research for products that will ultimately be priced very low (also thanks to generics) for a high volume to produce. Because in “normal times” (periods of “usual drug resistance”) competition between existing products drives prices down. However, if resistances become too high (and they will because they are selected over non-resistant bacteria), none of the existing medicine will be effective anymore, the willingness to pay for innovative drugs will be high but the time to develop them will still be in decades (i.e. too late to tackle the resistances).

Intervention 9 of the UK report tackle this issue with a complex reward mechanism (“the carrot”). But then the next section describes a very simple tax in one page (“the stick”). This ‘pay or play’ mechanism that was highlighted in the press and should indeed be the simplest mechanism that can be applied at a country level.

However, another mechanism could be to make the antimicrobial market attractive again. Allow for (moderately) increased prices on existing drugs (even the ones with competition from generics) and pharmaceutical companies will see opportunities to develop new medicines. Yes, they will become richer thanks to these price increases – but these funds are (partially) re-invested in research and development.

Photo credits: What Is Drug Resistance? by NIAID (licence CC-by) and B0006889 MRSA (clusters of methicillin-resistant Staphylococcus aureus (MRSA) bacteria) by Wellcome Images (licence CC-by-nc-nd).

Belgium doesn’t score well in the Open Data Index (not speaking about health!)

The Open Knowledge Foundation (OKF) released the Open Data Index, along with details on how their methodology. The index contains 70 countries, with UK having the best score and Cyprus the worst score. In fact the first places are trusted by the UK, the USA and the Northern European countries (Denmark, Norway, Finland, Sweden).

And Belgium? Well, Belgium did not score very well: 265 / 1,000. The figure below shows its aggregated score (with green: yes, red: no, blue: unsure).

Open Data Index - Belgium

The issue with this graph is that you may first think it’s a kind of progress bar. For instance, in transport timetables, it seems Belgium reached 60% of a maximum. But the truth is that each bar represents the answer to a specific question. So the 9 questions are, from left to right:

  1. Does the data exist?
  2. Is it in digital form?
  3. Is it publicly available?
  4. Is it free of charge?
  5. Is it online?
  6. Is it machine readable (e.g. spreadsheet, not PDF)?
  7. Is it available in bulk?
  8. Is it open licensed?
  9. Is it up-to-date?

With the notable exceptions of government spending and postcodes/zipcodes, nearly all Belgian data is available in a way or another. That’s already a start – but … None of them are available in bulk nor machine readable nor openly licenced and only few of them are up to date. Be sure to read the information bubbles on the right of the table if you are interested in more details.

The national statistics category leads to a page of tbe Belgian National Bank. And here is one improvement that the OKF could bring to this index: there should be a category about health data. For Belgium we are stuck with some financial data from the INAMI (in PDF, not at all useful as is) but otherwise we have to rely on specific databases or the WHO, the OECD or the World Bank. The painful point is that these supranational bodies often rely on statistics from states themselves – but Belgium doesn’t publish these data by itself!

If you are interested in the topic, three researchers from the Belgian Scientific Institute of Public Health published a study about health indicators in publicly available databases, 2 years ago [1]. Their conclusions were already that Belgium should improve on Belgian mortality and health status data. And the conclusion goes on about politically created issues for data collection, case definition, data presentation, etc.

I was recently in a developping country (Vietnam) where we try to improve data collection: without reliable data collection it is difficult to know what are the issues and to track potential improvements. In the end, this is also applicable in Belgium: we feel proud of our healthcare system ; but on the other hand it is difficult to find health-related data in an uniform way. It is therefore difficult to track trends or improvements.

[1] Vanthomme K, Walckiers D, Van Oyen H. Belgian health-related data in three international databases. Arch Public Health. 2011 Nov 1;69(1):6.

Holi hai!

March 7th, 2012 is Holi! It is first a Hindu spring festival celebration but it is also known as the festival of colours. The main day is celebrated by people throwing scented powder and perfume at each other. Bonfires are lit on the eve of the festival (more info on Wikipedia).

Now compare how a movie showed Holi in 1981 (“Silsila“):

With a movie showing a Holi celebration in 2010 (“Action_Replayy“):

🙂

In Belgium, at least two celebrations are planned:

  • one in Leuven, organised by ISAL, on March 10th, 2012;
  • the other one in Brussels, organised by InBAG, on March 24th, 2012.

Chúc mừng năm mới!

In three days (Jan 23rd, 2012) it will be the Vietnamese Tết. This year is the year of the Dragon. Happy New Year!

Dragon boats resting

For those interested there will be a celebration at Théâtre Marni in Brussels on January 28th afternoon. And BelVietnam is mentioning three celebrations in Brussels on January 21st, 29th and February 12th.

Photo credit: Dragon boats resting on Sông Hương river, Huế, Vietnam (from my photos on Flickr, licence CC-by-sa)

Yesterday was International Day of Older Persons

On 14 December 1990, the United Nations General Assembly designated 1st of October the International Day of Older Persons. 1990 … it is already more than 20 years ago! People who signed the resolution at that time are now more than 20 years older. Some (most) of them probably are now considered as “old persons”. Do they still have the same view on elderly? Maybe the highlighted principles at that time (independence, participation, care, self-fulfilment, dignity, …) are too broad, too short, just enough?

So, already a century ago 😉 people were concerned by the dramatic changes in the composition of the world population. Thanks to progresses and greater availability of preventive measures and treatments more people are living longer and healthier. Even in countries where fertility rate is high, there will be less and less working-age adults per older adult. When you look at China, the percentage of people above 65 years old is projected to rise up to one fourth of the total population in only 40 years.

Actual and projected percentage of people above 65 in China
Actual and projected percentage of people above 65 in China (partial data from Leeder et al., Columbia University, 2005)

Imitating other countries like the USA, UK, the Netherlands, etc., Belgium recently launched its Open Data Initiative. Well, don’t expect fancy graphs nor any “web 2.0” widgets, it’s only a repository of data made available elsewhere. Most (if not all) data is provided “as it is”, in proprietary formats and not easily combined nor even visualized. So I welcome this initiative but just wish it will be at least maintained and updated or, better, grown into something better, just like other government open data websites. A dream will be to have at least direct data manipulation online, downloads in open formats, a clearly open license and why not an open API?

So, what about the elderly in Belgium? There is a section about population forecast by age (which comes from the economy ministry in Excel format).

Projected aging of population in Belgium
Projected aging of population in Belgium (data from http://data.gov.be)

The Belgian population will continue to increase. The older population in Belgium will increase faster than the younger population. But seen like this, the growth will not be very dramatic.

Actual and projected percentage of people above 65 in Belgium (data from http://data.gov.be)

If we look at the projected percentage of people above 65 years old, we see that Belgium in 2010 is already at the same status as China in 2040. If experts say China will have an alarming percentage of old people in the future, the future is already here in Belgium! But it’s also true that Belgium took many decades to achieve this allowing some adaptations to take place. China will achieve it in only a few decades and will have to cope with these changes very quickly.

UN highlighted some challenges and ways to overcome them at a country / government level. The main issues will be to maintain older people as much as possible the same levels of health and independence as they enjoyed during their active lives.

N.B. For other sources of data in Belgium, one may be interested in visiting the Bureau fédéral du Plan, Statistics Belgium and the Statistics section of the National Bank of Belgium.