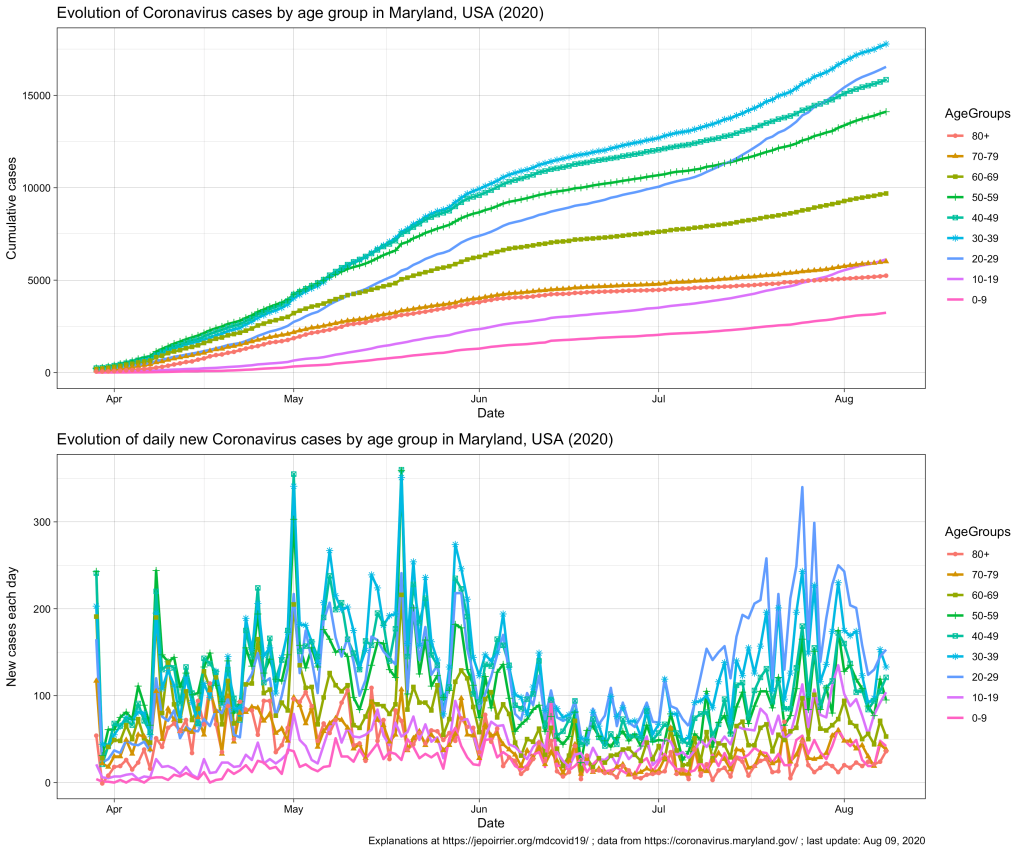
Since mid-July 2020 in Maryland, we understood that the 20-59 yr age group was problematic, especially the 20-29 yr age group that is racing to overtake all age groups in terms of number of COVID-19 cases (relative to their population, see top chart below).
In terms of COVID-19 hospitalizations, we also saw a small rebound (see chart below; it seems that it subsides since beginning of August).
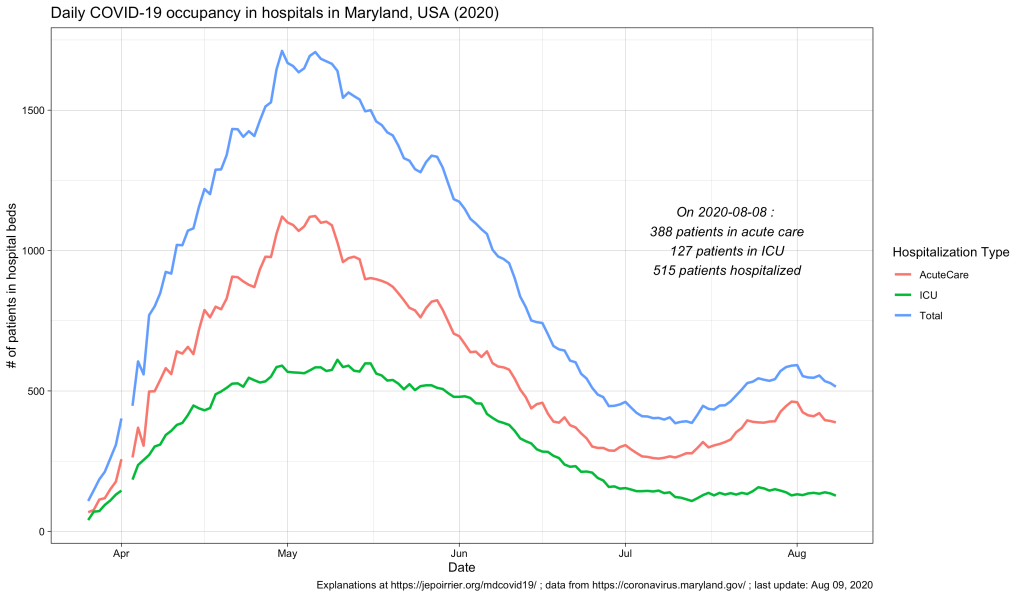
But what we didn’t know (for this small peak as well as since the beginning) was what is the age of these hospitalized populations. Did these hospitalizations impacted more the older adults? The younger ones? Or the children? The Maryland Department of Health COVID-19 dashboard doesn’t report that information (nor in the API).
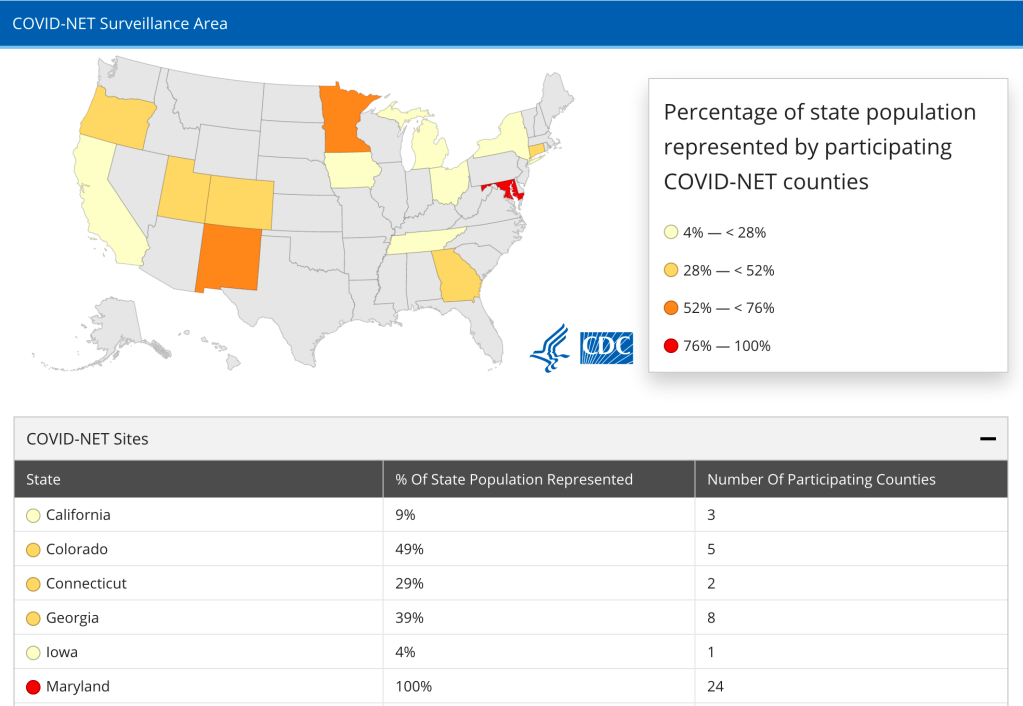
Despite the recent issue about switching hospitalization reporting from CDC to HHS, it seems that CDC is still reporting hospitalization data at COVID-NET (Coronavirus Disease 2019-Associated Hospitalization Surveillance Network), at least until the end of July. There, it is interesting to note that Maryland is the only state which reporting represents 100% of the population (24 counties) – that’s good!
Now, the CDC also has an interactive graph where you can see and filter the data by yourself. Here is the situation up to August 9, 2020, for Maryland:
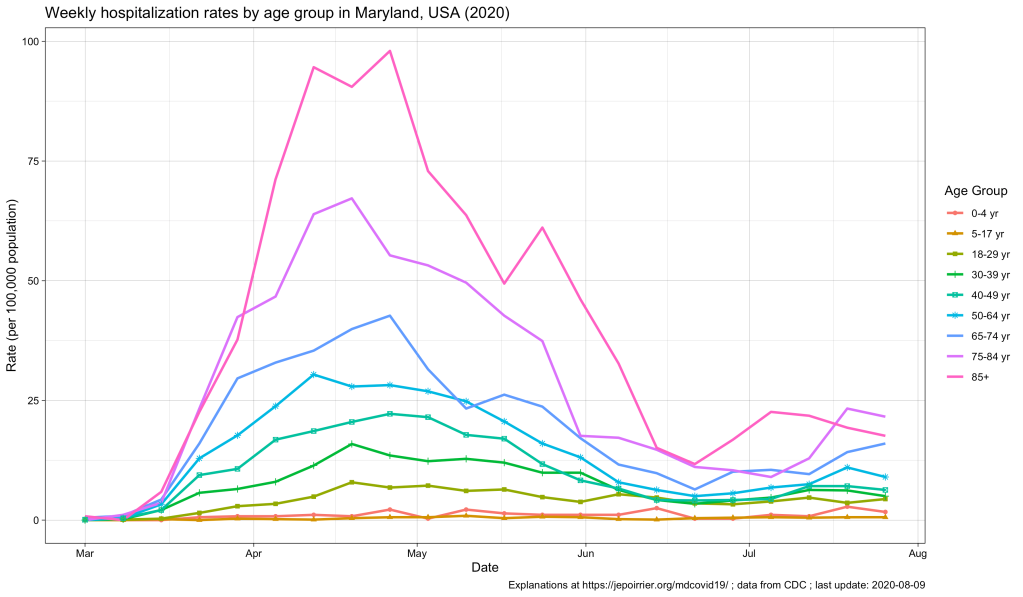
The peak of April-May is well represented, with the 85+ population reaching a peak at nearly 100 weekly hospitalizations per 100,000 pop. All the other age groups increased during that time, the older the higher (unfortunately).
Now, since July, we see some of these age groups increase again. At the end of July:
| Age group | Weekly hospitalization rate |
|---|---|
| 65-74 yr | 16.0 |
| 75-84 yr | 21.6 |
| 85+ yr | 17.6 |
This, in my opinion, reinforce the view that, cases might be increasing in the younger population (also thanks to testing being more available) and children and young adults might be less impacted when infected. But the older population is the first impacted by any increase in cases. It was true in April-May. It is again the case with this small peak. If we should take preventative measures to contain COVID-19, it is for us – but especially for the older population, our parents.
To be continued …
As usual, you’ll find other graphs on my page about COVID-19 in Maryland (and figures above are updated with new data as they appear) and the data, code and figures are on Github (including these ones).
