Since the beginning of this pandemic, one metric intrigued many of us in Maryland: the cumulative number of people released from isolation. Initially (before the data release via API, when there was only the MDH dashboard), it was even thought to be the number of hospital patients released from isolation. It’s not: the API page mentions:
Total Number Released from Isolation data layer is a collection of the statewide cumulative total of individuals who tested positive for COVID-19 that have been reported each day by each local health department via the ESSENCE system as having been released from home isolation. As “recovery” can mean different things as people experience COVID-19 disease to varying degrees of severity, MDH reports on individuals released from isolation. “Released from isolation” refers to those who have met criteria and are well enough to be released from home isolation. Some of these individuals may have been hospitalized at some point.
Definition of “release from isolation” according to the MDH API (emphasis is mine)
Therefore, mentioning the number of patients released from (home) isolation just below the current number of patients in hospital (as it is currently the case on the MDH dashboard) is a bit misleading: this metric is related to home isolation, which is very different than isolation in hospital.
According to the MDH FAQ on isolation and quarantine, there is no mandate to isolate newly diagnosed positive COVID-19 cases. These cases should follow their healthcare provider’s guidance. In the same document, it also appears that there is no mandate to be notified of the end of isolation. There is a guidance with 3 conditions from the CDC (≥ 10 days since first symptoms, ≥ 24 hours without fever and all COVID-19 symptoms are better – note they don’t need to disappear). These are exactly the conditions written in the CDC Guidance on Discontinuing Home Isolation for Persons with COVID-19 (consulted on August 5, 2020). So I don’t know exactly how this “released from isolation” data is collected.
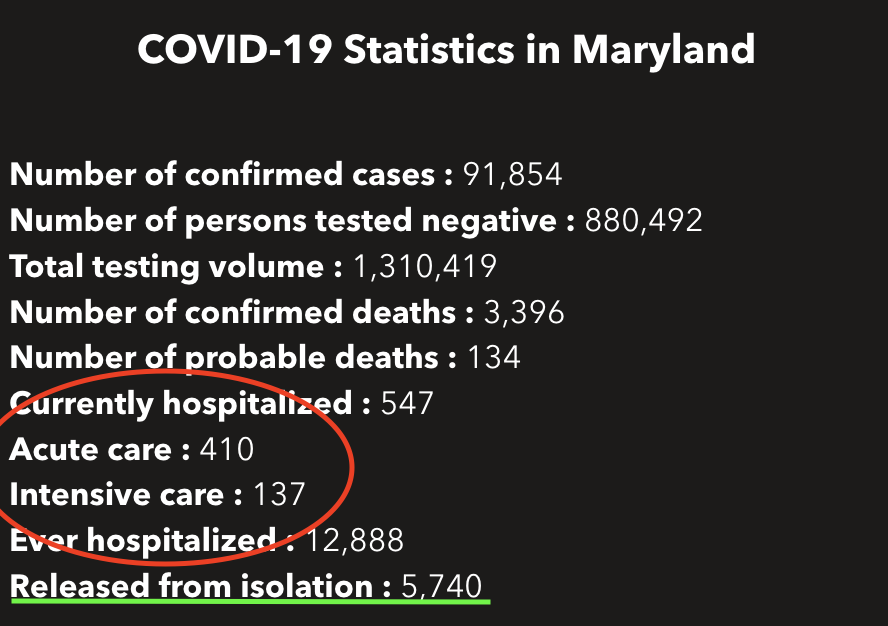
To add to the confusion, the API page indicates that the data is provided by Maryland’s ESSENCE (Electronic Surveillance System for the Early Notification of Community-based Epidemics). But this system takes most if its data from Maryland acute care hospitals. So would that mean that hospitals direct the end of home isolation and report these numbers? It could be patients released from hospital and asked to isolate at home: so far, there were a total of 12,888 hospitalizations due to COVID-19 in Maryland. It would mean less than half of these patients would have been asked to continue to isolate at home after their hospital release (up to August 4, 2020, the data says that a total of 5,740 COVID-19 cases were released from home isolation). This is 1/20th of the total of positive cases so far (91,854) so I’m not sure we can link these two metrics.
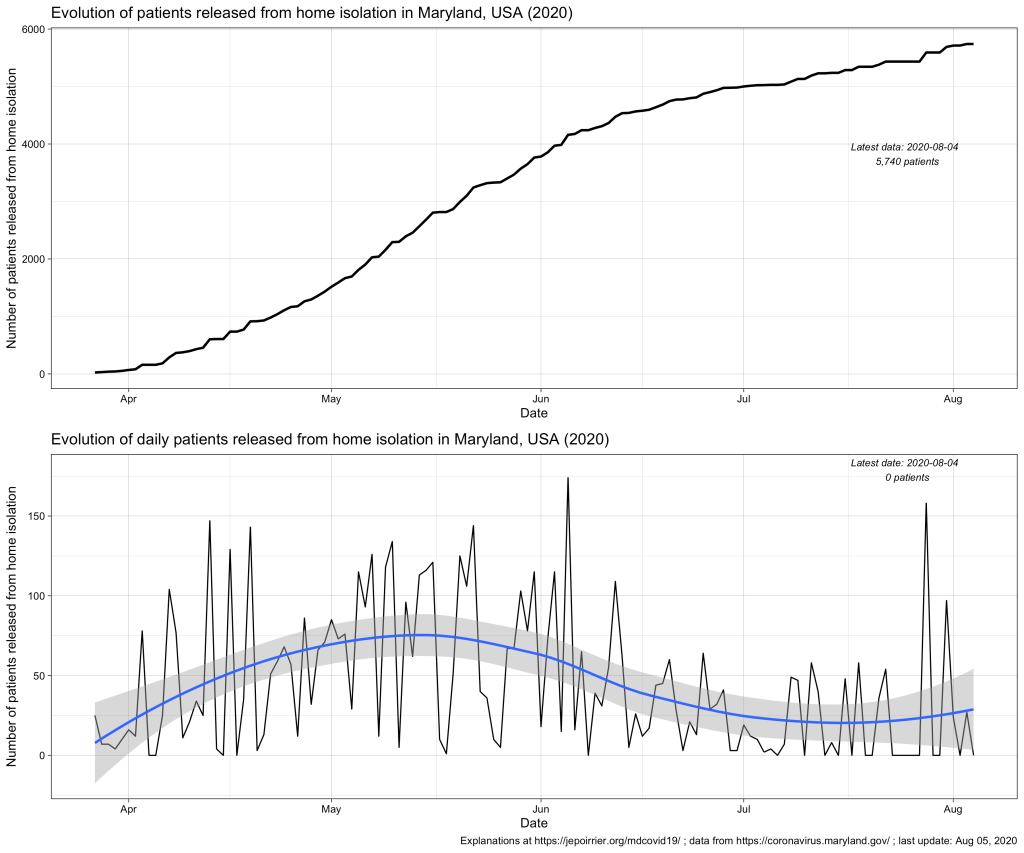
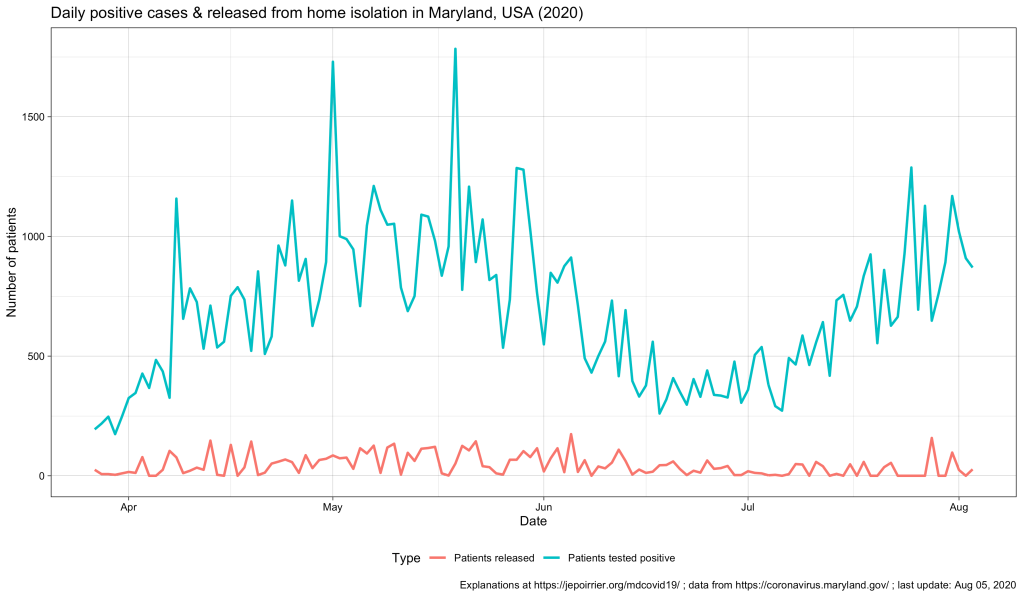
On a daily basis, the second chart (above) shows a kind of cycle with a peak around mid-May – early-June and a trend that increases again end of July. This blue, smoothed curve really looks like the curve of positive cases so I plotted them both below (cases in blue, releases in red). We can see the 2 peaks for both curves but we can’t really distinguish any relay in patients released (red), compared to the positive cases (blue) (this would have made sense since releases follow reporting of cases, by definition – a confounding factor may be the delay in case reporting that may blur the time difference). But the graph also shows us the difference in magnitude between the number of cases (high) and, indirectly, the number of people that were in isolation at home (then released – low).
So I still don’t really know what to think of this metric. If you have any idea, please tell me! Thanks!
To be continued …
As usual, you’ll find other graphs on my page about COVID-19 in Maryland (and figures above are updated with new data as they appear) and the data, code and figures are on Github (including these ones).
