Category: Data

Counting steps is the easiest way to reduce cardiovascular risk

After abandoning my Fitbit device in January because using it didn’t see improvement in my weight (see previous post), I was wondering if I could still measure my risk to develop cardiovascular diseases and other preventable chronic diseases (diabetes e.g.). So, still sitting at my desk (something I do for more than 8 hours a day in theory – probably more in practice), I looked into the ways to monitor my risk for these diseases …

Continue reading “Counting steps is the easiest way to reduce cardiovascular risk”

Evolution of the number and causes of death in Belgium (2010-2014)

Statbel, the Belgian governmental organisation for data and statistics, just released mortality data for 2014 (press release in French, dataset). The headline of their press release was that, for the first time, tumors were the first cause of death for Belgian men. Diseases of the circulatory system remains the main cause of death in Belgium, for women and for both sex together.

While the death of someone is a bad news in itself, I’m more interested here in the evolution of death causes. I’m interested in the evolution of causes of death because it might be a consequence of the evolution of the Belgian society and, as a proxy, of any (most) developed, occidental countries.

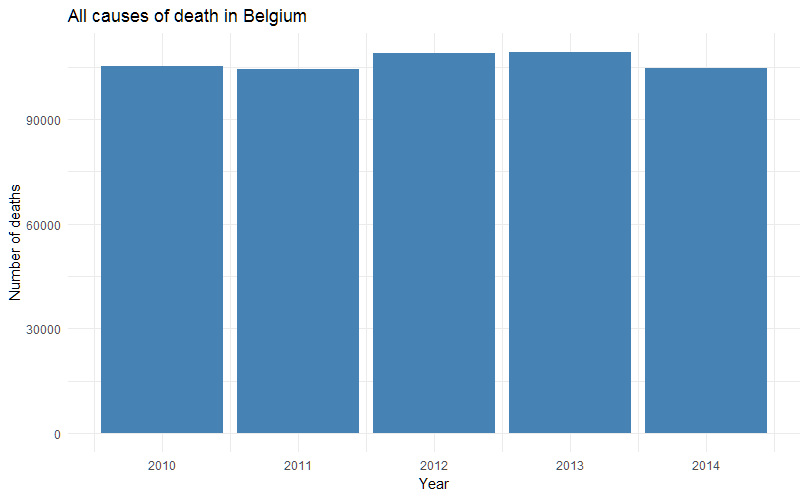
If you look at the data, the number of Belgians dying is stable and natural death is still the main cause (and also stable, around 93%). Note that if we look at data before 2010, it seems that mortality is slightly increasing since around 2005.

Evolution of the number of deaths in Belgium, all causes, 2010-2014

If the total number of deaths seems stable, the press release seemed to indicate that tumors (cancers) are on the rise, especially in men. The breakdown in categories is made following the international classification ICD-10 and, because the names of the different chapters are quite long for graphs, I will use the corresponding chapter numbers instead. Here is the key:

Chapter Header
I Certain infectious and parasitic diseases (A00-B99)
II Neoplasms (C00-D48)
III Diseases of the blood and blood-forming organs and certain disorders involving the immune mechanism (D50-D89)
IV Endocrine, nutritional and metabolic diseases (E00-E90)
V Mental and behavioural disorders (F00-F99)
VI Diseases of the nervous system (G00-G99)
VII Diseases of the eye and adnexa (H00-H59)
VIII Diseases of the ear and mastoid process (H60-H95)
IX Diseases of the circulatory system (I00-I99)
X Diseases of the respiratory system (J00-J99)
XI Diseases of the digestive system (K00-K93)
XII Diseases of the skin and subcutaneous tissue (L00-L99)
XIII Diseases of the musculoskeletal system and connective tissue (M00-M99)
XIV Diseases of the genitourinary system (N00-N99)
XV Pregnancy, childbirth and the puerperium (O00-O99)
XVI Certain conditions originating in the perinatal period (P00-P96)
XVII Congenital malformations, deformations and chromosomal abnormalities (Q00-Q99)
XVIII Symptoms, signs and abnormal clinical and laboratory findings, not elsewhere classified (R00-R99)
XX External causes of morbidity and mortality (V01-Y98)

One thing to notice is that, for chapter IV, Statbel only counts categories E00 to E88 while the WHO includes 2 more, from category E00 to E90 ; I would assume here that it has no important impact. Also note that, below, R ordered the chapters in a strange way – I’ll see how to fix that.

Excluding natural causes, we see that indeed, diseases of the circulatory system (chapter IX) are still the first cause of death, followed by neoplasms (chapter II) and diseases of the respiratory system (chapter X). If we compare the relative ratio of all these causes (second graph below), we also find the same conclusion – but the relative decline in deaths due to diseases of the circulatory system is better shown. And we can see that neoplasms take back approximately the same relative percentage of death, in 2014 (although they returned to the absolute number of deaths of 2012, approximately).

Causes of death in Belgium, 2010-2014

Causes of death in Belgium, 2010-2014, relative numbers

The available data set doesn’t go into more details than numbers by ICD-10 chapters. Therefore we cannot tell from that what kind of neoplasm is the most prevalent or what kind of infectious disease is the most present in Belgium, for instance. The press release however mentions that respiratory, colorectal and breast cancers are the top three killers and that flu was not very present in 2014.

As the cancer occurrence is increasing with age, and as the Belgian population is aging, one of the explanation for a high number of deaths due to neoplasms can be age ; however we don’t see a dramatic increase of neoplasms (fortunately!). Another potential factor is the impact of screening for cancers. Due to a very intelligent political split (sarcasm!), prevention (and therefore screening) is not a federal duty. Therefore regions started different screening programs, at different times, with different results. Screening data and their results are therefore difficult to obtain. The Belgian Cancer Registry doesn’t publish data on screening in oncology – although its latest report (revised version of April 2016) very often mentions screening as a main factor for change in the number of cases diagnosed. In its 2016 report (PDF), the Flemish Center for the Detection of Cancer (Centrum voor kankeropsporing) indicates that they increased the number of women screened for breast cancer by more than 8% between 2011 and 2015 (especially in 2015), with a quality of test between 90% and 95%. They also showed an increase in cancer diagnostics (without linking it directly to the increase in screening).

screening-flanders

This is by no means an exhaustive review of the data. There are other potentially interesting things to look at: the geographical disparities between the three regions, the gender ratio evolution (as some of these diseases are known or by definition affecting more one sex than the other), etc.

It would also be interesting to follow these trends as some changes occurred recently in the Belgian curative landscape. New drugs in cancer immunotherapy were recently authorised and reimbursed, for melanoma, lung – and other indications will follow. These costs have a price (less than what is in the press, however, I may come back on this in a future post) but they delay death (unfortunately they don’t avoid it). However, for some of them, in some indications, their administration and reimbursement is sometimes also linked with screening, testing and prior treatment failure ; that might decrease their impact on overall mortality. New drugs for Hepatitis C also arrived in 2015 and 2016 and the Belgian health minister decided to reimburse these drugs for patients in their early stage 2 of the disease. Studies showed that treating at this stage may prevent hepatitis C from progressing to later stages and, in some cases, studies showed patients cured from the disease. This is an opportunity to see a decline in mortality due to this infectious disease (although it is already quite low – compared to other diseases).

2013 in review: how to use your users’ collected data

With a few days of interval I received two very different ways of reviewing data collected by users of “activity trackers”.

Jawbone_20140117-075010b The first one came from Jawbone (although I don’t own the UP, I might have subscribed to one of their mailing-lists earlier) and is also publicly available here. Named “2013, the big sleep” it a kind of infographics of how public (and mostly American) events influenced sleep of the “UP Community”. Here data about all (or at least a lot of) UP users were aggregated and shown. This is Big Data! This is a wonderful and quantitative insight on the impact of public event on sleep! But this is also a public display of (aggregated) individual data (something that UP users most probably agreed by default when accepting the policy, sometimes when they first used their device).

The second way came from Fitbit, also via e-mail. There was written how many steps I took in total as well as my most and least active periods / days of 2013. At the bottom there was a link to a public page comparing distances traveled in general with what it could mean in the animal kingdom (see below or here). This is not Big Data (although I am sure Fitbit have access to all these data). But at the same time (aggregated) individual data are not shared with the general public (although here again I am sure a similar policy apply to Fitbit users).

Different companies, different ways to handle the data … I hope people will realise the implication of sharing their data in an automated ways in such centralized services.

Fitbit2_20140117-075745

More sleep with Fitbits

After a bit less than 2 hours, jepsfitbitapp retrieved my sleep data from Fitbit for the whole 2013 (read previous post for the why (*)). Since this dataset covers the period I didn’t have a tracking device and, more broadly, I always slept at least a little bit at night, I removed all data point where it indicates I didn’t sleep.

hours alseep with FitbitSo I slept 5 hours and 37 minutes on average in 2013 with one very short night of 92 minutes and one very nice night of 12 hours and 44 minutes. Fitbits devices do not detect when you go to sleep and when you wake up: you have to tell tem (for instance by tapping 5 times on the Flex) that you go to sleep or you wake up (by the way this is a very clever way to use the Flex that has no button). Once told you are in bed the Flex manages to determine the number of minutes to fall asleep, after wakeup, asleep, awake, … The duration mentioned here is the real duration the Fitbit device considers I sleep (variable minutesAsleep).

Visually it looks like there is a tendency to sleep more as 2013 passes. But, although the best linear fit shows an angle, the difference between sleep in March and sleep in December is not significant.

R allows to study the data in many different ways (of course!). When plotting the distribution of durations asleep it seems this may be distributed like a normal (Gaussian) distribution (see the graph below). But the Shapiro-wilk normality test shows that the data doesn’t belong to a normal distribution.

Histogram of hours asleep in 2013Hours asleep in 2013 - Normal?As mentioned above, Fitbit devices are tracking other sleep parameters. Among them there is the number of awakenings and the sleep efficiency.

Awakenings in 2013

The simple plot of the number of awakenings over time shows the same non-significant trend as the sleep duration (above). The histogram of these awakenings shows a more skewed distribution to the left (to a low number of awakenings) (than the sleep duration). This however shows there is a relation between the two variables: the more I sleep the more the Flex detects awakenings (see second graph below).

Number of awakenings in 2013 (histogram)Relation between sleep duration and awakenings with Fitbit FlexSleep efficiency is the ratio between the total time asleep by the total time in bed from the moment I fell asleep. This is therefore not something related to the different sleep stages. However it may indicate an issue worth investigating with a real doctor. In my case, although I woke up 9 time per night on average in 2013, my sleep efficiency is very high (93.7% on average) …

Sleep efficiency in 2013… or very low. There are indeed some nights where my sleep efficiency is below 10% (see the 4 points at the bottom of the chart). These correspond with nights when I didn’t sleep a lot and also with very little awakenings (since these are related).

There is no mood tracking with Fitbit (except one additional tracker that you can define by yourself and must enter a value manually): everything tracked has to be a numerical value either automatically tracked or manually entered. It would be interesting to couple these tracked variables with the level of fatigue at wake-up time or the mood you feel during the subsequent day. I guess there are apps for that too …

The code is updated on Github (this post is in the sleep.R file).

(*) Note: I just discovered that there is in fact a specific call in the API for time series … This is for a next post!

Getting some sleep out of Fitbits

After previous posts playing with Fitbit API (part 1, part 2) I stumbled upon something a bit harder for sleep …

Previous data belong to the “activities” category. In this category it is easy to get data about a specific activity over several days in one request. All parameters related to sleep are not in the same category and I couldn’t find a way to get all the sleep durations (for instance) in one query (*). So I updated the code to requests all sleep parameters for each and every day of 2013 … and I hit the limit of 150 requests per hours.

Hours asleep (March-April 2013)This graph is what I achieved so far. I didn’t sleep much in March-April 2013: on average 4.9 hours per night. The interesting thing is that I can understand why by going back to my agenda at that time (work, study, family …). As soon as I can get additional data it would be interesting to see if sleep durations will increase later on.

(*) If you know how to get all sleep durations for 2013 in one query, let me know!

Do you climb more floors when moving from an apartment to a house?

I continue to explore data about my physical activity in 2013 (see part 1). We moved from an apartment (on the third floor of a building) to a house (with two floors) on July 1st, 2013. I was wondering if the change would have an impact on the number of floors I climbed: I now have to climb to reach bedrooms and go down to go in the living room. A standard house.

Two things before diving into data … First I sometimes used to climb the stairs to the 3rd floor in my building (and I worked all the time at the same floor at the office). Then only the Fitbit One is collecting the number of floors you climb, not the Flex (you can enter them in the web interface but I don’t). So I don’t value the data after I lost my Fitbit One (Sep. 16). I don’t really know how the One determines the number of stairs I climb but I felt it was fairly accurate. For instance when I climbed 3 stairs in my building, the One always indicated +3 stairs on its counter.

So now the data. I updated the R scripts and here is what I get for the number of floors.

Number of floors climbed in 2013 - JepOn average I did not climb a lot of stairs. In general it is below 20. And if I compare the data before and after the move there is indeed a significant difference (p=2.49e-06)! But I was climbing more floors when I was in my apartment than when I was/am in a house (respective means of 12.59 and 7.37 floors)!

There are a few outliers, days when I climbed relatively more than others. Going back to my agenda, it corresponded to:

  • one day I took holidays just after the move in order to arrange things at home (strangely the days of the move doesn’t correspond to more of that activity);
  • one day when I came back from a business trip (I had to walk a lot to/in/from airports);
  • two days with no particular event.

The lessons I take are that you don’t necessarily need stairs in the area where you live to actually climb more floors (in my case it appears to be the opposite). And I don’t necessarily need to have a specific activity to climb more floors, hence it’s a question of willingness more than anything else.

Next post: how much sleep did I get in 2013!

2013 with Fitbits

2013 is near its end and it’s time to see what happened during the last 360 days or so. Many things happened (graduated from MBA, new house, holidays, ill a few days, …) but I wanted to know if one could quantify these changes and how these changes would impact my daily physical activity.

For that purpose I bought a Fitbit One in March 2013. I chose Fitbit over other devices available because of the price (99 USD at the time) and because it was available in Europe (via a Dutch vendor). At that time the Jawbone Up was unavailable (even in the USA) and the Nike Fuelband couldn’t track my sleep.

Basically the One is a pedometer (it tracks the number of steps you make per day) but also the number of floors climbed and the time asleep. Note you have to tell your device when you go to sleep and when you wake up ; it will substract automatically the times you were awake. The rest of the data presented are taken from these few observed variables: distance traveled, calories burnt, … The Fitbit website also categorizes your activity from ‘sedentary’ to ‘very active’.

Of course there is an app (for both iOS and Android) where you can also enter what you eat (it automatically calculate the number of calories ingested) and your weight (unless you buy a wifi scale from them). You can set goals on the website and then it tells you how many steps you have to make per day. All this data is stored on a Fitbit server and you can access it via your personal dashboard (yes your data is kept away from you but there are ways to get it …).

Fitbit dashboard beta

I liked the Fitbit One mainly because it is easy to use: you take it and forget it, it works in the pocket. There is a nice, easy to use web interface – great for immediate consumption (not really for long trend analysis). It is quite cheap to acquire the device (well, it is quite small anyway). It works with desktop software as well as mobile app (incl. synchronisation). The One can easily be forgot in a pocket (gives peace of mind) but it doesn’t work when you don’t have pockets (shower, pyjama, changing clothes, … ; I didn’t use the clip/holder at the waist).

That leads me to its disadvantages …

  • First it’s a proprietary system: you need to pay 50USD in order to get the data you generate, to get your data. Although it makes perfect sense from a business perspective, the device then costs 150USD (and not only 99USD for acquisition alone).
  • Then it also uses a proprietary interface to charge the device. This is problematic when you move house (the cable is somewhere in a box) or simply when the cable is lost (see messages on Twitter asking for such cable when lost). Most mobile phone manufacturers understood that and provide regular USB interface (for charging and syncing btw). I guess the small form factor has a price to pay.
  • Tracking of other activities than movement is tedious, especially the need for an internet connection in order to enter food eaten in the app (but otherwise that’s the drawback of logging: auto-vs-manual in general).
  • Then tracking is sometimes not practical. e.g. between wake up and dressed up or shower. So is there always some under-reporting? Probably there is as I don’t wear it when changing or in pyjama (no pocket). Of course the One comes with an armband-holder but I guess it records data differently.

But the last and main disadvantage that comes to my mind is linked with its advantage: it is so easy to use and to forget (in the washing machine), it can fall and you won’t notice it.

So of course I lost it. It was in a business trip in South-East Asia. I thought I put it in my suitcase when changing pants but I couldn’t find it anymore. So after a few hesitations I chose to get a Fitbit Flex.

Fitbit Flex with charger and armband

The Flex comes in another format: it’s like a small pill that you put in a plastic armband-holder. Therefore it is closer to the body (but not legs, to count steps) and therefore you don’t need pockets. However it doesn’t give time (if you have a watch you’ll have 2 devices at your left wrist? Fitbit now sell an evolution of the Flex – the Force – with LEDs displaying time a.o.). As it is always in its armband I feel it is less likely to be forgotten. And you don’t need pockets, it’s like a bracelet you receive at some concerts. The battery autonomy is approximately the same: around 7 days. You can read here another comparison of the two.

So, what about 2013?

In order to dig the past I could:

  1. use the Fitbit dashboard (see first picture of this post) and visually track what I did, making screenshots as I want to keep some results offline ;
  2. shelve 50USD for the Premium reports that can be downloaded and use whatever software to look at the data – note that you get more than just reports for that ;
  3. use the Fitbit API and figure out how to get my data out it.

Of course I chose the third option. It is a bit more complicated but helped with one of Ben Sidders’post I started coding my “app” in R, the statistical language. As there is a bit more than Ben is explaining I posted all my code on the Github repository of my app, jepsfitbitapp.

The first thing I wanted to see is the most obvious one: my steps. As you can see in the figure below I started to collect data in March 2013 (with the One), I stopped collecting data around October 2013 (when I lost the One) and I re-started later on (with the Flex). I usually walk between 5,000 and 10,000 steps per day, with a maximum on July 1st (the day we moved). 10,000 steps is the daily goal Fitbit gave me. There is a significant difference in the number of steps measured by the One (before October) and the Flex (after October): I cannot really say if it is due to the change in tracking device (and their different location on the body) or if I kind of reduced my physical activity (mainly because of more work, sitting in the office).

Fitbit steps over time - 2013

As always, I’ll promise to add some physical activity on top of this baseline as a New Year resolution. We’ll see next year how things evolve. In the meantime I’ll explore more what I can extract from my Fitbits in the following posts. Stay tuned!

Belgium doesn’t score well in the Open Data Index (not speaking about health!)

The Open Knowledge Foundation (OKF) released the Open Data Index, along with details on how their methodology. The index contains 70 countries, with UK having the best score and Cyprus the worst score. In fact the first places are trusted by the UK, the USA and the Northern European countries (Denmark, Norway, Finland, Sweden).

And Belgium? Well, Belgium did not score very well: 265 / 1,000. The figure below shows its aggregated score (with green: yes, red: no, blue: unsure).

Open Data Index - Belgium

The issue with this graph is that you may first think it’s a kind of progress bar. For instance, in transport timetables, it seems Belgium reached 60% of a maximum. But the truth is that each bar represents the answer to a specific question. So the 9 questions are, from left to right:

  1. Does the data exist?
  2. Is it in digital form?
  3. Is it publicly available?
  4. Is it free of charge?
  5. Is it online?
  6. Is it machine readable (e.g. spreadsheet, not PDF)?
  7. Is it available in bulk?
  8. Is it open licensed?
  9. Is it up-to-date?

With the notable exceptions of government spending and postcodes/zipcodes, nearly all Belgian data is available in a way or another. That’s already a start – but … None of them are available in bulk nor machine readable nor openly licenced and only few of them are up to date. Be sure to read the information bubbles on the right of the table if you are interested in more details.

The national statistics category leads to a page of tbe Belgian National Bank. And here is one improvement that the OKF could bring to this index: there should be a category about health data. For Belgium we are stuck with some financial data from the INAMI (in PDF, not at all useful as is) but otherwise we have to rely on specific databases or the WHO, the OECD or the World Bank. The painful point is that these supranational bodies often rely on statistics from states themselves – but Belgium doesn’t publish these data by itself!

If you are interested in the topic, three researchers from the Belgian Scientific Institute of Public Health published a study about health indicators in publicly available databases, 2 years ago [1]. Their conclusions were already that Belgium should improve on Belgian mortality and health status data. And the conclusion goes on about politically created issues for data collection, case definition, data presentation, etc.

I was recently in a developping country (Vietnam) where we try to improve data collection: without reliable data collection it is difficult to know what are the issues and to track potential improvements. In the end, this is also applicable in Belgium: we feel proud of our healthcare system ; but on the other hand it is difficult to find health-related data in an uniform way. It is therefore difficult to track trends or improvements.

[1] Vanthomme K, Walckiers D, Van Oyen H. Belgian health-related data in three international databases. Arch Public Health. 2011 Nov 1;69(1):6.

Is it so difficult to maintain a free RSS reader?

A few months ago Google decided to retire its Google Reader (it stopped working on July 1st, 2013). As it was simple, effective and good-looking, a lot of people complained about this demise. A few days ago The Old Reader, one of the most successful replacement for Google Reader, also announced it will close its gates, only to keep early registered users. And today Feedly, another successful alternative, announced it is introducing a pro version at 5.00 USD per month.

One of the reasons often evoked is the difficulty for these relatively small projects (before Google Reader demise) to handle the many users who migrated to their platform. Difficulties in terms of hardware resources but also human resources, finances, etc.

So, to answer my own question, yes, it looks like it’s difficult to maintain a free RSS reader with an extensive number of users. And free software alternatives like Tiny Tiny RSS, pyAggr3g470r or Owncloud can be difficult for users to install (and especially maintain – same type of difficulties: necessity to have a host and technical capabilities, time, money (even if at a different scale), …).

Two thoughts on this. Fist people are used to free products on the internet (count myself among them). And we take for granted that services on the web are and will remain free. RSS and its associated readers were a great inventions to keep track of information coming from various sources. However with the explosion of the number of these sources is RSS still a valid tool? One solution is to restrict ourselves to some, carefully selected sources of information. The other is to imitate statistics: summary statistics exist for raw data, datamining should become as easy to use for raw information (but I don’t think datamining is as easy as summary statistics).

Which leads me to my second thought: aren’t this just signs of the end of RSS as we know it? People thought of it because of a giant web service provider removed its “support” for RSS. What if it is just the end of RSS because it is not adapted anymore to “modern” use?

Let me try a comparison. E-mail is an older system than RSS. It is however still there. It serves another purpose: one-to-one or one-to-few communication. But since its origin e-mail clients tried to innovate by adding features, among which is automated classification of e-mail. Spam filters exist since a long time. Rules can be defined in most e-mail clients. GMail (again from Google) is now classifying your own e-mail with “Priority”, “Social” etc. These tools help us to de-clutter our Inbox and keep only relevant e-mails in front of us when we need them. I think RSS would benefit from similar de-clutter/summarizing tools. We just need to find / invent them.

Will we see more babies named George in England and Wales?

A few days ago Prince William and Duchess Catherine of Cambridge gave birth to Prince George. Today at the office we were wondering if we will see more babies names George in UK. Very important question indeed!

So I went to the UK National Statistics website and looked for baby names in UK. Let’s focus on England and Wales only. There are two datasets for what we are looking for: one for the period 1904-1994 (by 10 years steps) and one for 2004 (if we want to be consistent with the 10 years step in the first dataset). I extracted the ranking relevant for us here: for babies called William, George (and Harry, William’s brother). The data is here.

If we plot these rankings we see for William that there could be a “Prince effect”. Indeed this name was less and less used in the 20th century (blue dots) until Prince William’s birth in 1982 (blue dotted line). Idem for the name Harry (green dots) that didn’t even made it into the top 100 in 1964, 1974 and 1984 ; but it reappeared at the 30th rank in 1994 (he was born in 1984, green dotted line).

Evolution of ranking of baby name popularity - William, Harry and GeorgeNow for the name George, it’s a bit different. The name was also going down the ranking until 1974 when it reached the 83rd rank. After that it went up again. So does it invalidate the “Prince effect” mentioned earlier? Maybe it’s more a “famous effect” since other famous Georges were famous (George Michael, George Clooney, George Best, George Weasley, … from Yahoo!). Maybe the appearance of television shows in colour (1966 for BBC) made this name popular? Do you see other reason? But even from the already high 17th in popularity now I still expect the name George to gain even more popularity.

Btw I discovered that The Guardian ran a similar story (excluding Harry however).