With more and more CPU and storage thrown at Large Language Models (LLMs) and Generative Artificial Intelligence (GenAI) in general, the capacity to “memorise” information grows larger and larger with each generation of LLM. This is further accelerated by the capacity to add specific details to generalist LLMs using Retrieval Augmented Generation (RAG) and agents (e.g., with the ability to query real-world systems at the interface with the physical world).
LLMs are learning more, but what about unlearning? Dai and colleagues didn’t evoke the analogy with human memory: our capacity to learn more relies, in part, on our capacity to forget, to reorganise, to summarise, and to prioritise the learnt information. Sleep and stress play a role in this reorganisation of information; this was the overarching topic of my Ph.D. thesis [link]. I will de-prioritise the visual cues along the path leading to a bakery if I no longer go to this bakery (“unlearning”). However, practising navigation to the bakery improved this skill, and this improvement will serve me later when I need to go to another place (something I could call “secondary learning”). It may seem we diverge from AI, but Dai and colleagues actually start their paper with the EU GDPR possibility for a patient to remove their data from a database, wondering how this is technically possible with LLMs (where data is not structured like in a traditional relational database and where the way data is retrieved is often unknown).
The “unlearning” process in LLMs can be considered from three encapsulated levels: algorithm, legal, and ethical levels.
After Modelling and Regulations & Pricing, and just a few days before ISPOR25, here is my take on the potentially interesting sessions on Artificial Intelligence (AI, which generally means: the use of Generative AI, or GenAI, in HEOR).
First, Sven Klijn, William Rawlinson, and Tim Reason are again offering their introductory course on Applied Generative AI for HEOR. Last year, I followed it in Barcelona, and it was nice. In my opinion, “nice” means that although I didn’t learn much more than previous presentations by the authors and my own experience, it was a great course for beginners because it struck the right balance between theory (which too many sessions end up only covering) and practical examples. Don’t expect hands-on exercises (that would be too long, and the course synopsis doesn’t mention that either). But “nice” to me means that the presenters dared to show actual working code, with all the humility that it implies. This year, they mention they’ll cover Retrieval-Augmented Generation (RAG) and agents. Hopefully, their coverage of these aspects will be as good as last year’s on the other topics.
Note that there is another course on AI and its use in Real-World Evidence (RWE) Research. I never attended this one, but I hope the instructors will give the audience practical instructions, independent of the AI tool their company is selling.
ISPOR’s key areas of focus for AI in HEOR (source)
Now on to the sessions! After several ISPOR sessions filled with hype from AI-enthusiasts and AI-deniers, we are slowly coming to some “âge de raison.” However, GenAI is still relatively new, and sessions reflect the need to cater to all audiences.
Finally, the most practical sessions, IMHO, will be the Research Podiums, as they should marry the technological approaches with the domain approaches. Interestingly, the first of these sessions, The Power and Pitfalls of AI in Health Data Analysis, only presents posters using NLP and Machine Learning (i.e. no GenAI per se). The second session, AI-Assisted Literature Reviews: Requirements and Advances, is focused on literature reviews. This year, it looks like there will be no sessions specifically focused on Modelling; my opinion is that either no significant progress was made (compared to previous ISPOR conferences) or this progress is now kept internally (for pharma’s own use or for consultants’ clients’ use).
Did I miss any important sessions? Do you have another take on sessions at this ISPOR conference or AI in HEOR? Although I enjoy a good quasi-philosophical debate on the good and evil of AI in HEOR, I’m happy to see practical applications being presented and discussed 🙂
ISPOR 2025 is now in about two weeks and in this second post about sessions to look for, I’ll talk about regulations and pricing (this is part of a series: last week, I wrote about Modelling; next week, I will write about AI).
As the main edition of ISPOR is held in North America, the Inflation Reduction Act (IRA) will naturally attract considerable attention. It will start with the very first Plenary Session, promising to explore the impact of price limits on innovation and provide real-world examples.
Here is one session to remind you that timing is essential … The IRA was introduced in 2022, under US President Biden, but the first Maximum Fair Prices will be implemented in 2026, under US President Trump. The latter has already introduced sweeping changes in the pharmaceutical research landscape in the US. But I found one interesting issue panel somewhat prophetic: “IRA Under Trump: What Is Next?“. Given the timelines for panel submission for ISPOR (before the 2024 elections), I have so many scenarios in my head about the authors trying to write the abstract broad enough to encompass potential futures while navigating the possible sensitivity of the situation, even before it happens. It will be an interesting panel to attend …
A panel also takes another perspective, wondering if the IRA became the US HTA. From the abstract, I understand the authors’ perspective, but I don’t agree: although the IRA will impact millions of Americans, it still lacks a direct impact on commercial plans. But it’s obviously a broader discussion than a terse comment in a blog post.
It will also be the first ISPOR conference after the European Joint Clinical Assessment (JCA) process started in Europe. Therefore, it is a bit early to draw conclusions and look at lessons learnt. However, two interesting sessions will examine it from the outside: one will examine the global (i.e. ex-EU) impact of JCA, and another will consider JCA as an enabler of cross-border collaborations.
Finally, because I recently contributed to projects supporting investors with health economics tools and assessments, I will be interested in the Input/Output Modelling panel: it will look at the broader impact of investments in health and pharmaceutical products. Their abstract reminded me of some early work published by a former boss on the societal impact of vaccination (I wonder if vaccines will be mentioned, by the way). The last workshop (the last one mentioned here) is titled “HEOR meets investing“, and it is precisely what we recently did: early health economics modelling can greatly help secure investments by reassuring about the potential cost-effectiveness of a drug, and justifying studies to fill crucial input data gaps.
I missed some panels in this short helicopter view. Do you have any other suggestions?
Next week, I will look at AI’s potential progress in health economics. Stay tuned!
ISPOR25, the annual North American conference for the International Society for Pharmacoeconomics and Outcomes Research, is in three weeks. As usual, I’m planning for it by browsing its program. This time, I decided to share a few of my interests on my blog. ISPOR usually covers many topics, from “hardcore” statistical methods to top-level overviews of some issues, so I will focus on only a few topics. Feel free to connect with me if you want to discuss anything at or around the conference (or virtually). (And before we start, full disclaimer: I’m currently working for Parexel, but opinions shared here are only mine; otherwise, I would have written them on the company blog.)
As usual, browsing the ISPOR conference program brings pages of potentially interesting topics
This first post will be about my primary interest: HEOR modelling, what input data we use, the impact of broader frameworks and regulations, and how it is used. Stay tuned for the next posts: they will be about higher-level regulations and pricing, and one specific to AI.
One will seemingly introduce a benchmark to assess a Large Language Model (LLM) performance at extracting information from models and literature reviews. I wrote “seemingly” because, if the intent is great, the rest of the abstract is not clear about how this system will assess the next model (not only the ones currently contained in the LLM database). And I am a bit doubtful about the use of the number of tokens as a measure of quality. Hopefully, the presentation will clarify these points.
Two posters/presentations will show tools to improve efficiencies: a VBA/R automator (I wonder about the sustainability of maintaining this type of program) and the use of metamodels.
This last poster is interesting because we will also present a poster about visual programming and try to convince the audience that this way of programming has many benefits for specific uses of modelling: brainstorming, early modelling, strategy (and introducing newcomers to complex topics in modelling). In a real geek way, it is interesting to note that most of these sessions still rely on MS Excel and venture, from time to time, with R. Our poster introduces Typescript, but it’s more a side effect (due to the framework used). In addition, our solution can be extended to any programming language, including Python, for instance (a programming language used a lot in data science; besides the use of LLMs for HEOR, Python is not used very much in our domain).
I didn’t mention sessions on causal inference, survival analysis, surrogate endpoints, … They are all worth attending. In your opinion, what session(s) did I miss in this brief overview?
The Adafruit PyPortal is a great device, with a few bells an whistles already integrated in order to start small electronic projects (but expensive, ok ;-)). As usual, Adafruit wrote a nice introductory guide. But some parts are outdated. Therefore, here are a few steps to get you started with CircuitPython on a PyPortal in 2021 …
The Python script (in src/ in the MD-coronavirus repo on Github) just fills in the latest data for days where data is missing. On a side note, it also fix some basic issues like a reporting date in year “0200” (instead of “2020”). You can play with the fixed data file here.
To take the same example again, below is the graph of the number of cases in Sterling Care Frostburg Village according to the official data file (“GH” means “group housing”). Between mid-June and mid-September, there is no data point. Therefore, it’s impossible to calculate a cumulative number of cases in all congregate living facilities. You can see in the old post that the cumulative curve is actually going down after June.
On the fixed version below, you can see data points added between mid-June and mid-September:
Note also that the MDH could have reset the count of cases between periods of 14+ days without reporting. Fortunately, it didn’t do that and you can see the facility re-appears in the file, mid-September, with 11 cases (or 2 more than in June), instead of just 2 cases in residents.
This version now allows to correctly display the cumulative count of COVID-19 cases in congregate living facilities:
We can see that, during the first wave, in May 2020, the number of cases increased a lot, especially among residents of nursing homes. Then the curves increased at a slower pace. Since the beginning, nursing homes counted for the bulk of congregate living facilities cases. But the increase in cases happens in all facilities.
There are still some issues to be solved. For instance, some facilities seem coded under different names. Our example above is coded in 2 different ways (and I need time to go through the 200+ facilities in the list):
Sterling Care – Frostburg Village
Sterling Care Frostburg Village
For a human, they are clearly the same facility. For a computer script, it still needs to be told so. And talking about computer script, this one still needs to be cleaned …
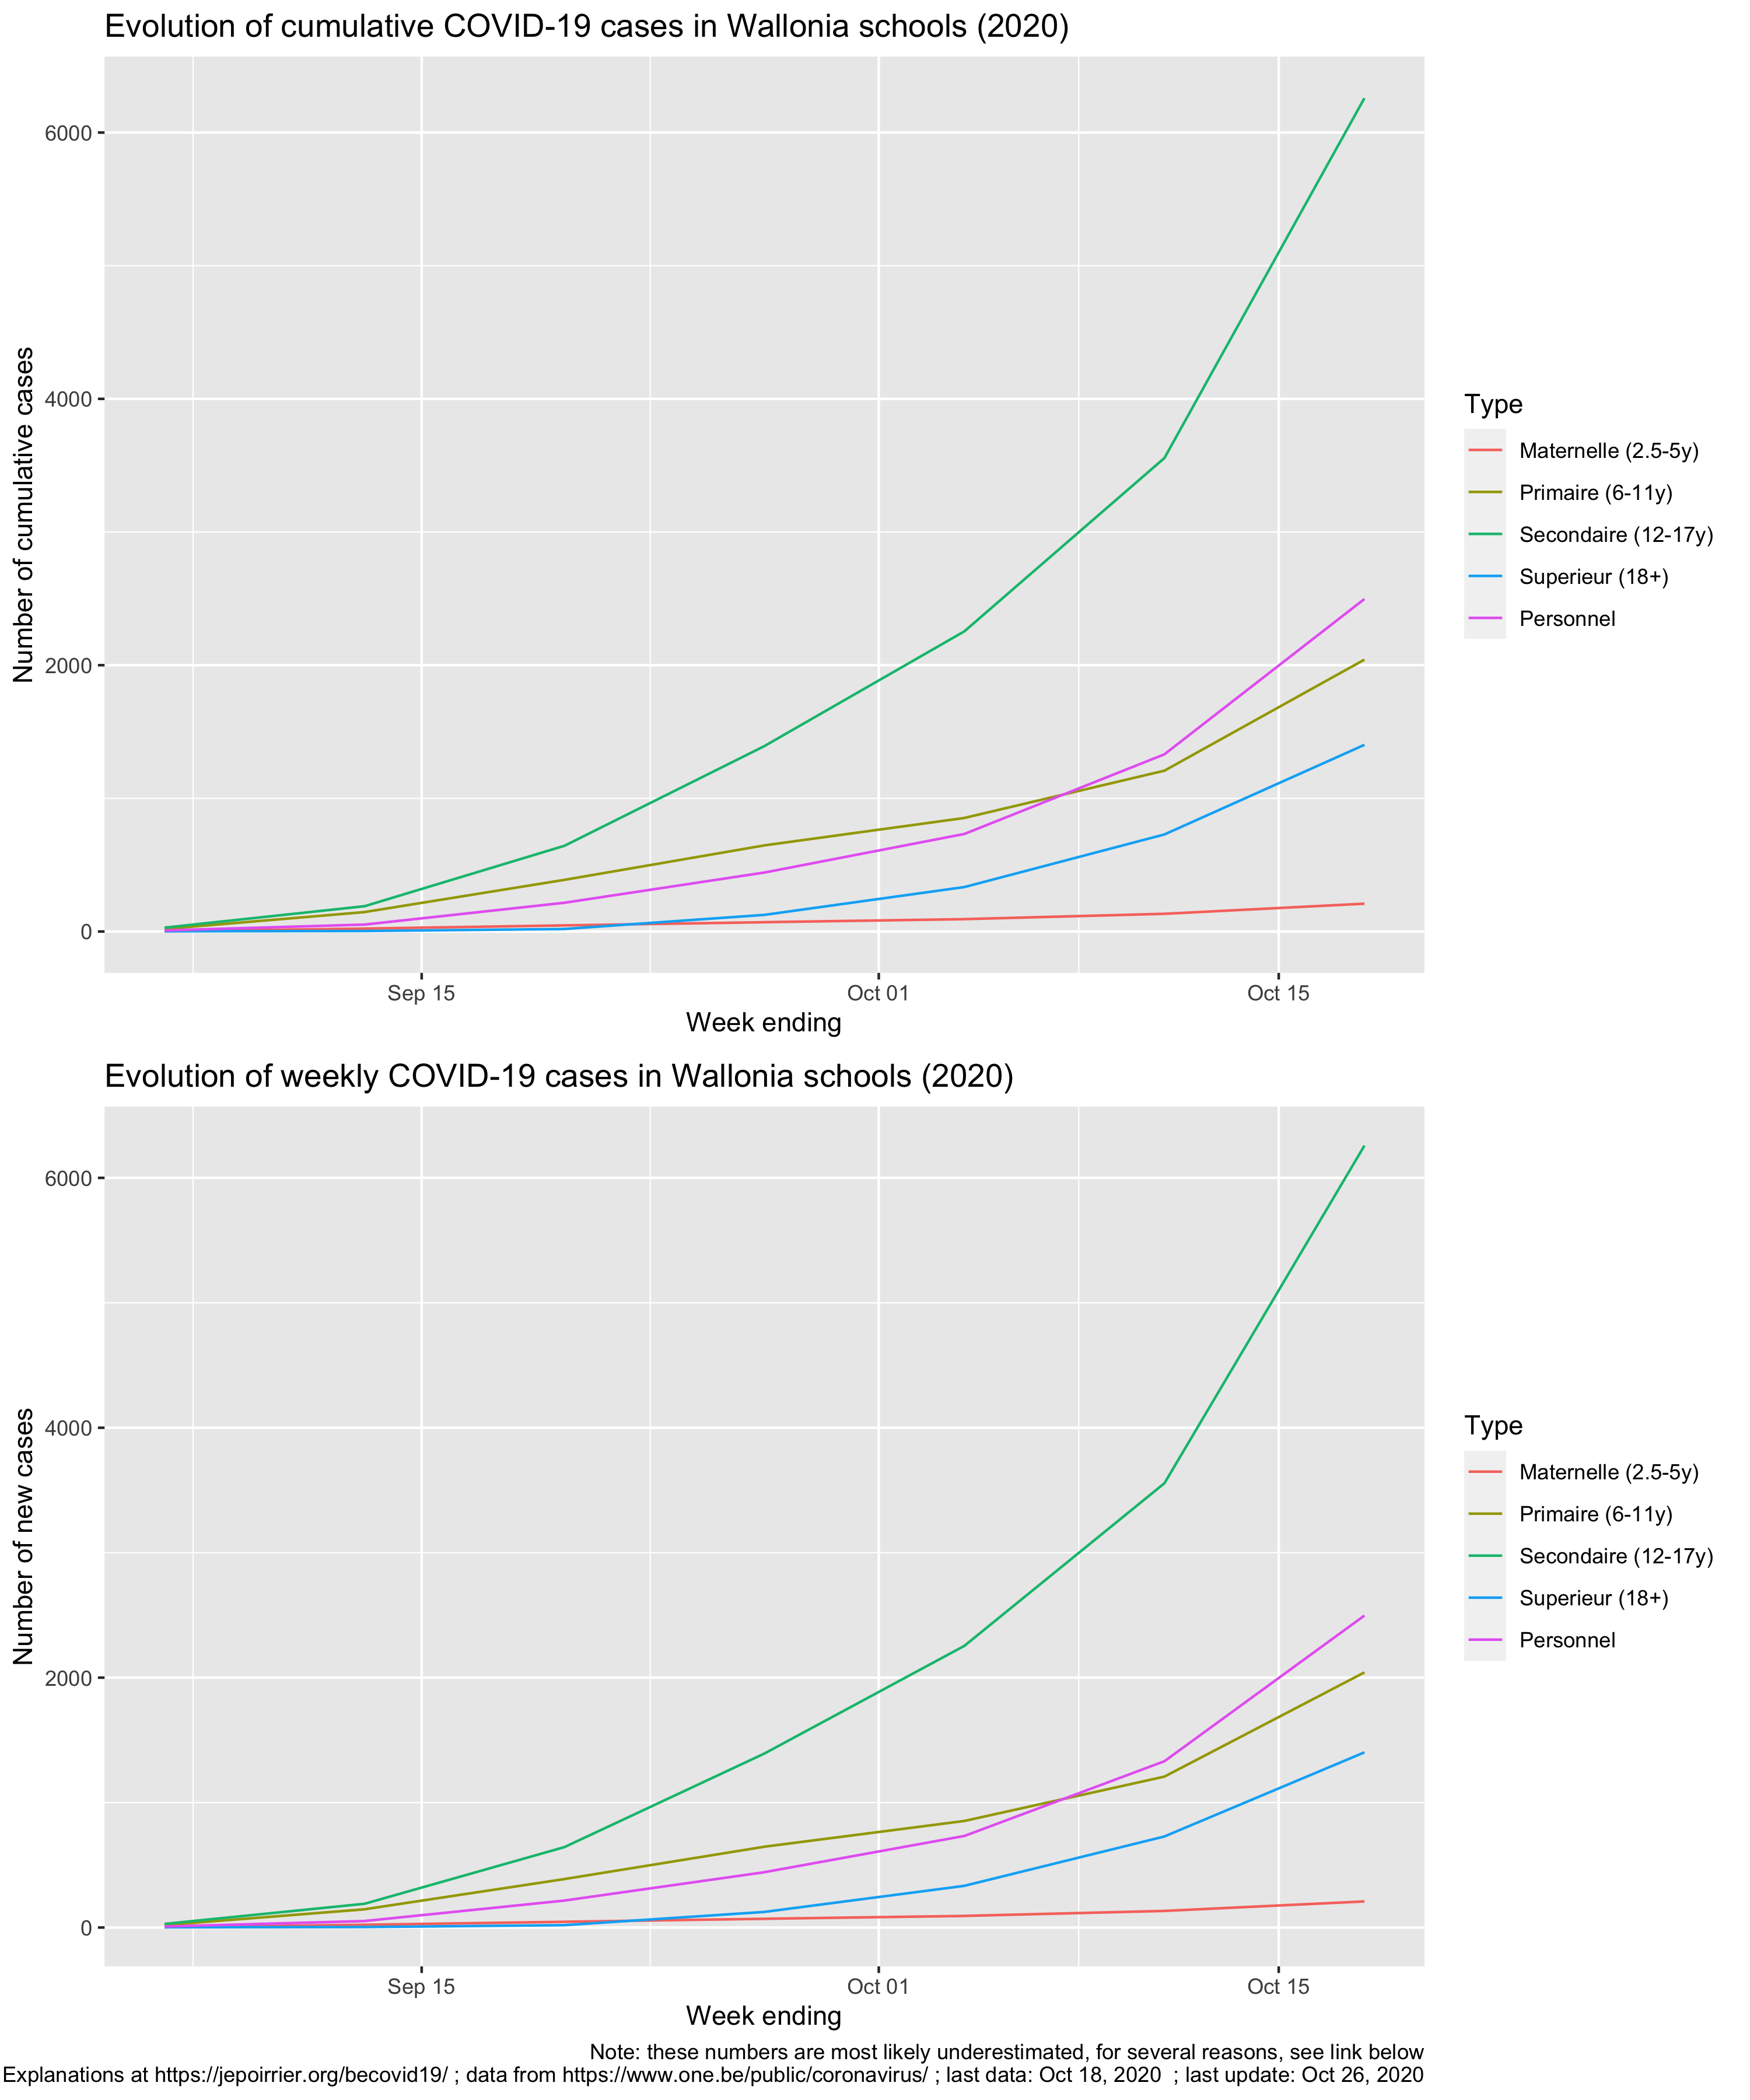
In Wallonia (Southern part of Belgium), universities are already back to only giving online classes, schools will be closed two additional days after the Autumn holidays (so November 2-11), and secondary schools (12-18 years-old children) will be virtual for the 3 days before the Autumn holidays (so October 28-30). The reason? The exploding number of COVID-19 cases in schools.
So far, the students in secondary school (12-18 years old) are the worst hit with a total of 6,258 positive cases since September 2020 (I’m writing this on October 27), followed by teachers and other personnel (total: 2,497 positive cases).
Is it a lot? Consider this: for the week ending on October 18, incidence in primary school (6-11 years old) is 365 / 100,000, incidence in secondary school (12-17 years old) is 1,117 / 100,000 while the average incidence over the last 14 days in the whole Belgian population is 1,289 / 100,000 (epidemiological bulletin of Oct. 26). Adolescents are therefore a driver of the incidence.
But one can see on the charts below that all age categories are exponentially seeing new cases:
Unfortunately, when you read the press releases, you realize that these numbers are minima. Indeed, the situation is actually worse but there are several reasons why numbers are not completely reported:
Health services in schools are not staffed to face a pandemic, they were not prepared and now some personnel also got the virus.
As a consequence, data is not completely transmitted to ONE since mid-October (it’s apparently worse for quarantine data, not shown here: at least 21% of cases don’t have data associated with potential follow-up quarantine in the last (7th) report).
Since October 1st, protocols (quarantine decreased at 7 days, definitions of close contact, etc.) changed.
Children below 6 years are exceptionally tested.
Children between 6 and 12 years (primary school) are tested only if they meet some conditions (symptoms, contacts in the family, or if 2 cases in the class).
It seems there are issues with reporting in students 18+ (“écoles supérieures“).
Universities are not reported in this count.
For adults (here: 18+ students, teachers and personnel), Belgium is back at testing only symptomatic patients since October 19, 2020.
So the additional days of holidays and making a few additional days of virtual school for secondary students is meant to try to break transmission of COVID-19 in schools.
Talking about transmission, it seems there is a kind of exploration on sources of infection in the ONE reports. It is not reported systematically nor in a similar way but the source of infection for reported cases is the school (close contact with a student, a teacher or a personnel) in 16-20% of cases.
I really hope this extended holidays will reduce transmission. It seems the younger a child is, the less symptoms he/she’ll display, it therefore seems ok for them to get the disease. But children remain important transmission vectors and we don’t want them to transmit the disease to more vulnerable groups of the population, like grand-parents but also adults and children with co-morbidities or immune diseases. Let’s not add a COVID-19 burden to the usual disease associated with winter (like flu).
Recently (I’m writing this on October 20), the (new) Belgian government decided to apply more stringent prophylaxis measures to contain COVID-19. One of the controversial measure is to close bars and restaurants for a month.
Unfortunately, in a way, at approximately the same time, AVIQ released its latest poll on COVID-19 clusters in Wallonia (AVIQ is the Walloon agency for well-being, health, handicap and family). I wrote it was unfortunate because I read and heard several people who criticized the closing of bars and restaurants by citing this poll. But this poll cannot answer in favor or against this closure; it doesn’t look at that …
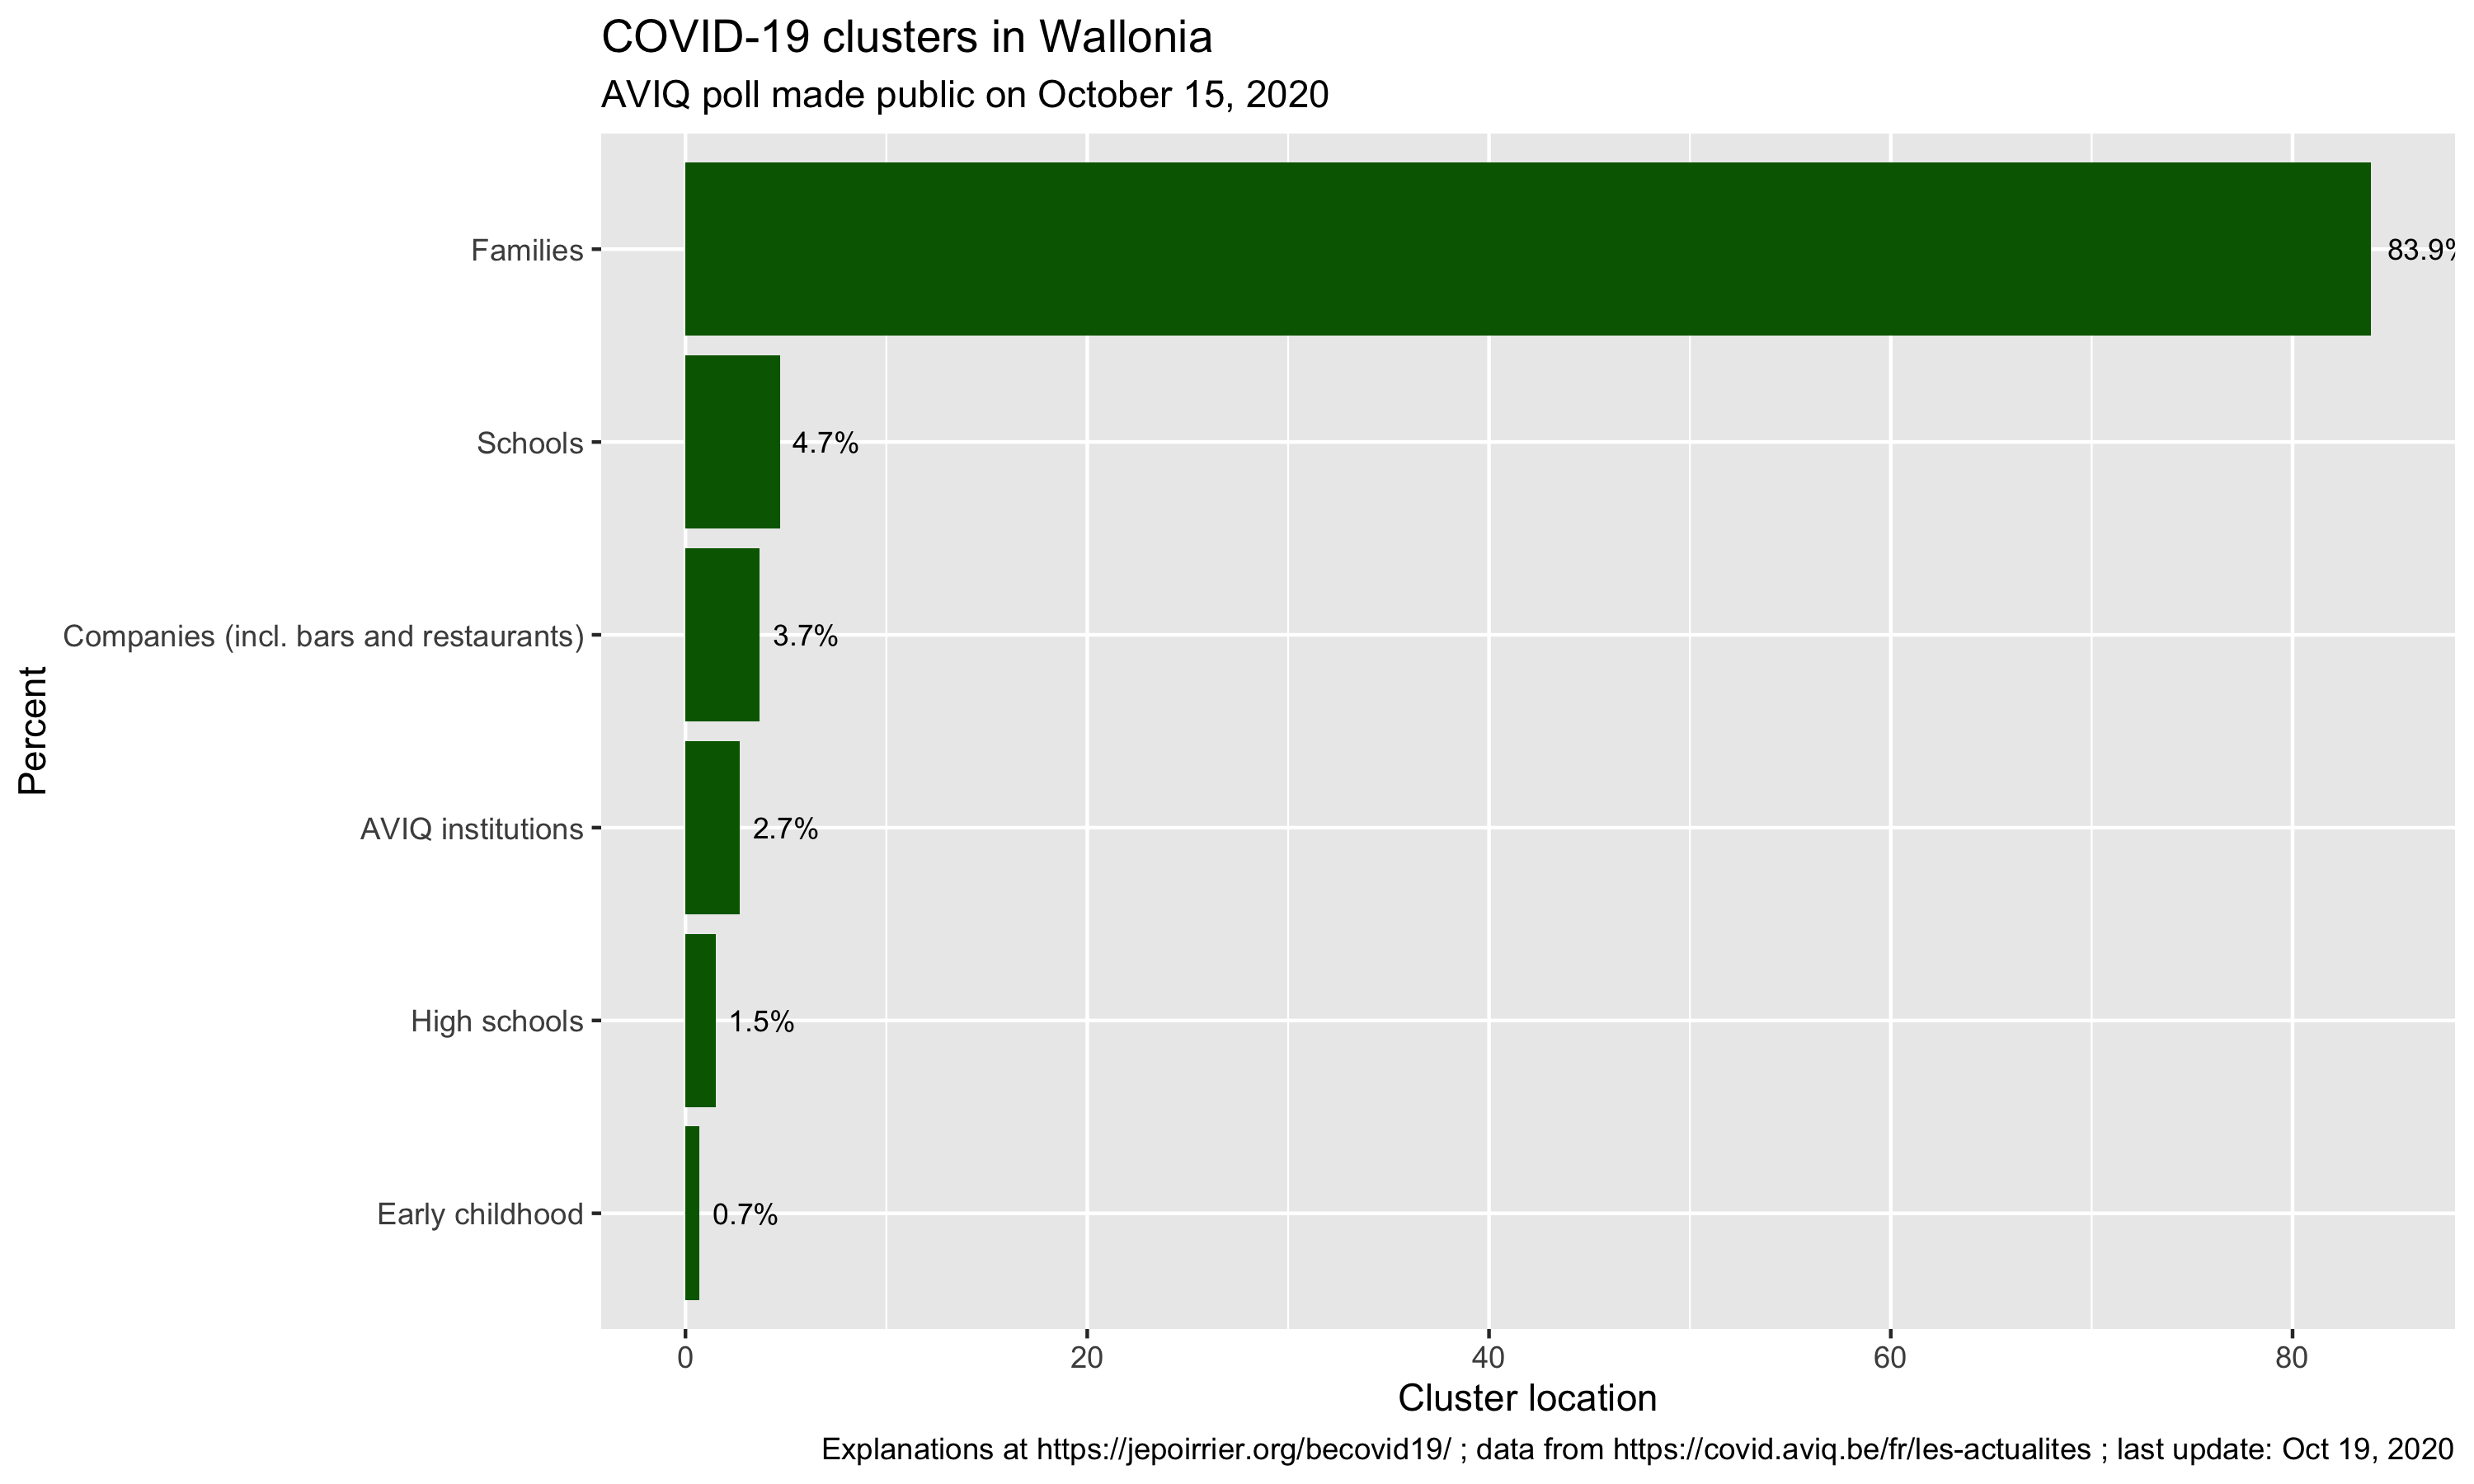
Here are the results:
From the meager press release, here is what we can reconstruct … AVIQ looked at the 5,043 COVID-19 clusters in Wallonia so far and went to interview one or several patients from these clusters (AVIQ defines a cluster as a place where there are 2 or more confirmed COVID-19 cases). The question was, more or less, where did you go before getting COVID-19? (in French: “collectivités que les personnes covid-19 positives ont déclaré avoir fréquentées“).
From there, nearly 84% of clusters were families, far ahead from schools (4%), companies/bars/restaurants (3%), and other places (note schools are still open in Belgium, except universities starting today).
First, bars and restaurants are amalgamated with companies (where home working was encouraged). One cannot easily disentangle them, unfortunately. Then all places are linked and the virus didn’t suddenly appear in the family – but one is more inclined to remember it’s in the family because it is close to dear people (spouse, children, parents, …). Also, there is the potential recollection bias (a classical limitation of interviews), interviewees willing to please the interviewer or simply not willing to disclose behaviors that may be frowned upon. A recent example of this was when the previous Belgian Prime Minister announced she was positive:
Le résultat de mon test Covid est positif. Une contamination probablement survenue au sein de mon cercle familial vu les précautions prises en dehors de mon foyer.
Well, back to our clusters … My last points for this AVIQ poll is that unfortunately there is no more details than this. We don’t know much about the methodology, it was minimally put in context and there was little caution against wild interpretations (just a “[Ces données] restent toutefois parcellaires compte tenu de ce qu’elles sont déclaratives et tributaires des délais de testing“).
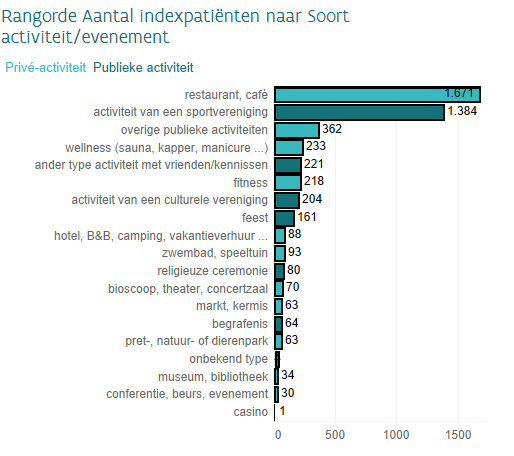
On the other side of Belgium, Zorg en Gezondheid (~AVIQ in the Flemish Region) did a similar poll but gave a bit more details about how they did it and provided more explanations in the results. For instance, they started by asking the index patient where he/she thinks he/she was contaminated: in the chart below, most patients didn’t know (“onbekend” – at least it was an option) but family (“gezin“) and workplace (“werk“) are respectively second and third in the places where they think they most likely got infected (but quite behind “unknown”).
What is interesting is that Zorg en Gezondheid then asked in which social places were these patients before self-isolating. And then we see (below) than most mention bars (“cafés“), restaurants, sports and then only the rather vague “public activities”. It is striking to note that none of these activities are related to school (maybe they only interviewed adults?).
And again, as it was mentioned elsewhere, these are interesting results but it doesn’t show the contagiousness or risk of contamination of these places.
Attention: pas de conclusions trop rapides. Ces graphiques ne disent rien sur le taux de contagion selon le secteur!
Sometimes, you think that you found something interesting but the Maryland Department of Health is already presenting it on its COVID-19 dashboard 😀
For instance, I calculated the percentage of residents of the different counties ever tested (regardless of the test result). I found out that a third of Maryland counties (8/24) tested at least once more than 25% of their residents. Indeed, as of yesterday (August 10), here are the counties in that category:
County (alphabetical order)
% population ever tested
Baltimore
25.8%
Baltimore City
30.2%
Dorchester
30.4%
Kent
30.6%
Somerset
30.8%
Talbot
28.6%
Washington
27.7%
Wicomico
25%
Maryland counties with more than 25% of their population tested for COVID-19 on August 10, 2020
While we are at it, here are the 5 counties with less than 20% of their population tested (still as of August 10, 2020):
County (alphabetical order)
% of population ever tested
Calvert
14.9%
Cecil
15.3%
Charles
18.6%
Harford
18.1%
Queen Anne’s
19.4%
Maryland counties with less than 20% of their population tested for COVID-19 on August 10, 2020
Graphically, we see that all counties are testing more and more, and increasing at approximately the same speed:
As you can see, there are 2 minor issues with the dataset from the MDH API. First, Somerset reported more than double the normal number of tests on June 18, 2020; it went back to “normal” on the next day (I suspect an encoding error here, see highlight below). Then, there is no data after July 7; data resumes on July 13 (a posteriori, I don’t recall reading any issue about county data collection during that time). None of these prevents looking at the current data.
Now, as I mentioned, the official dashboard has already this data, presented by quartile, as a kind of competition between counties 😉 … (the % are slightly different, probably because we are using different sources for the population totals – I’m using the population projections from the Maryland Department of Planning).
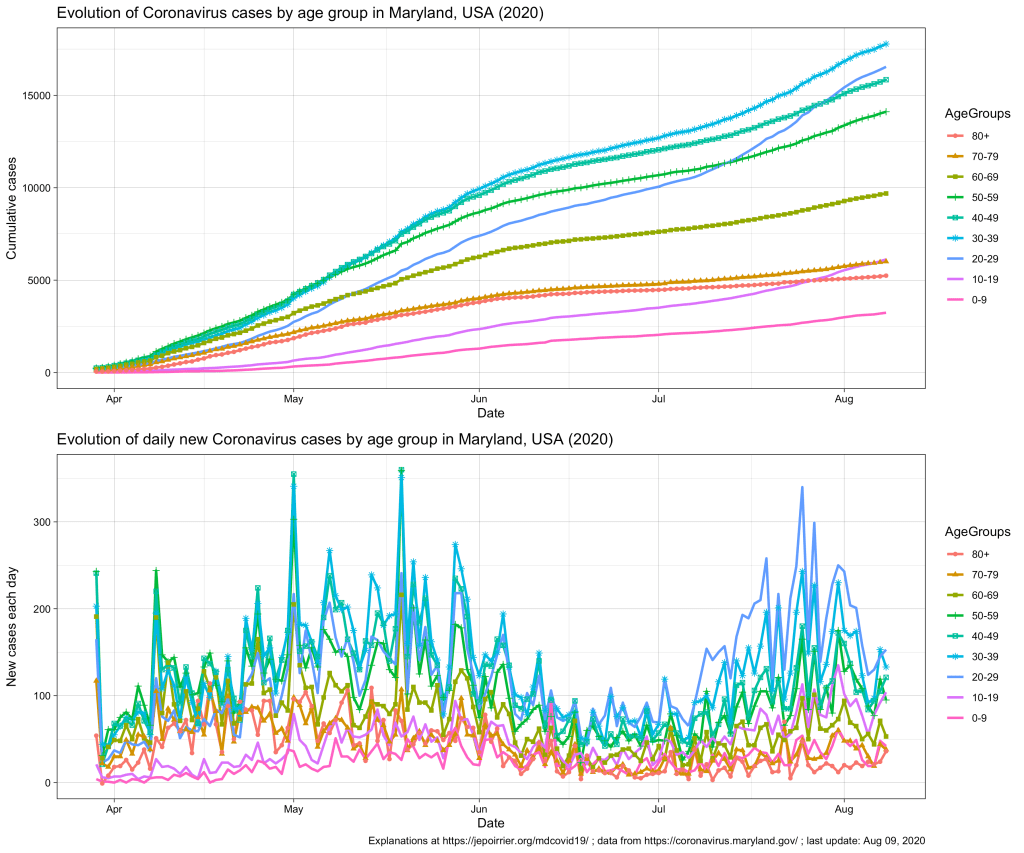
Since mid-July 2020 in Maryland, we understood that the 20-59 yr age group was problematic, especially the 20-29 yr age group that is racing to overtake all age groups in terms of number of COVID-19 cases (relative to their population, see top chart below).
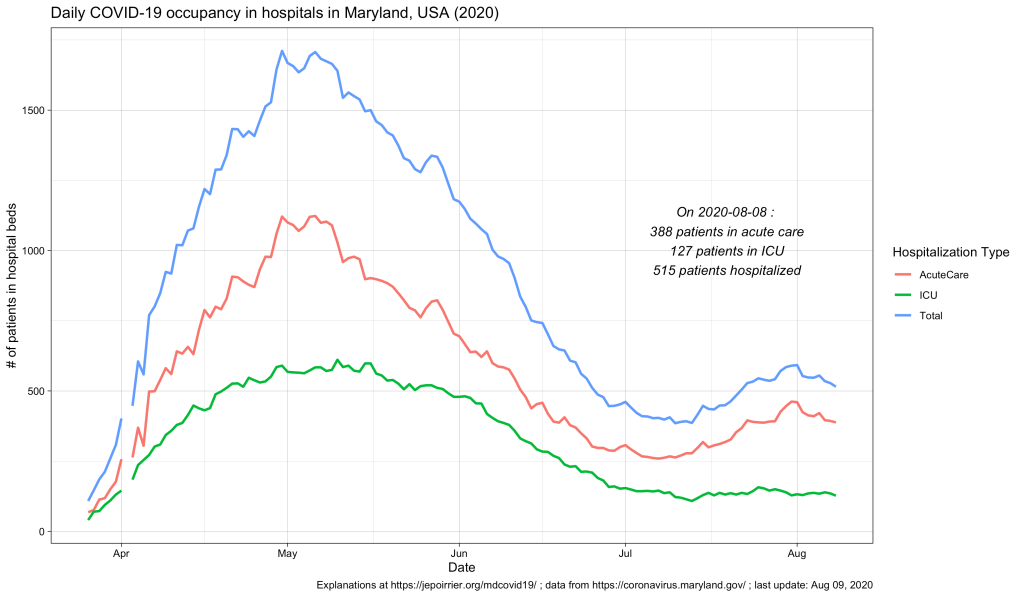
In terms of COVID-19 hospitalizations, we also saw a small rebound (see chart below; it seems that it subsides since beginning of August).
But what we didn’t know (for this small peak as well as since the beginning) was what is the age of these hospitalized populations. Did these hospitalizations impacted more the older adults? The younger ones? Or the children? The Maryland Department of Health COVID-19 dashboard doesn’t report that information (nor in the API).
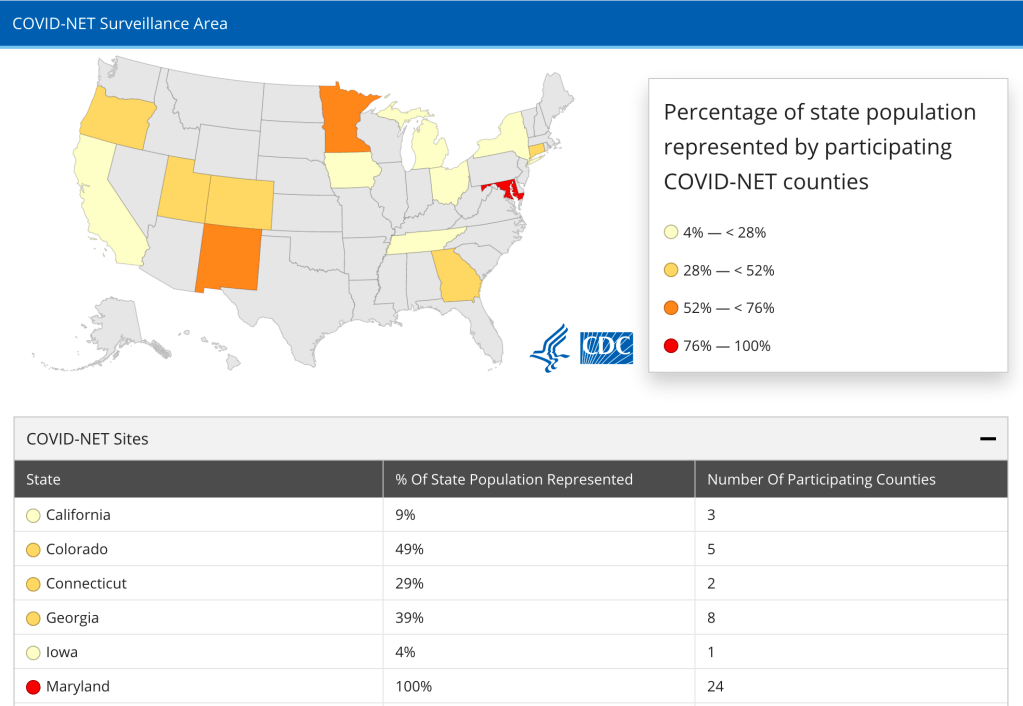
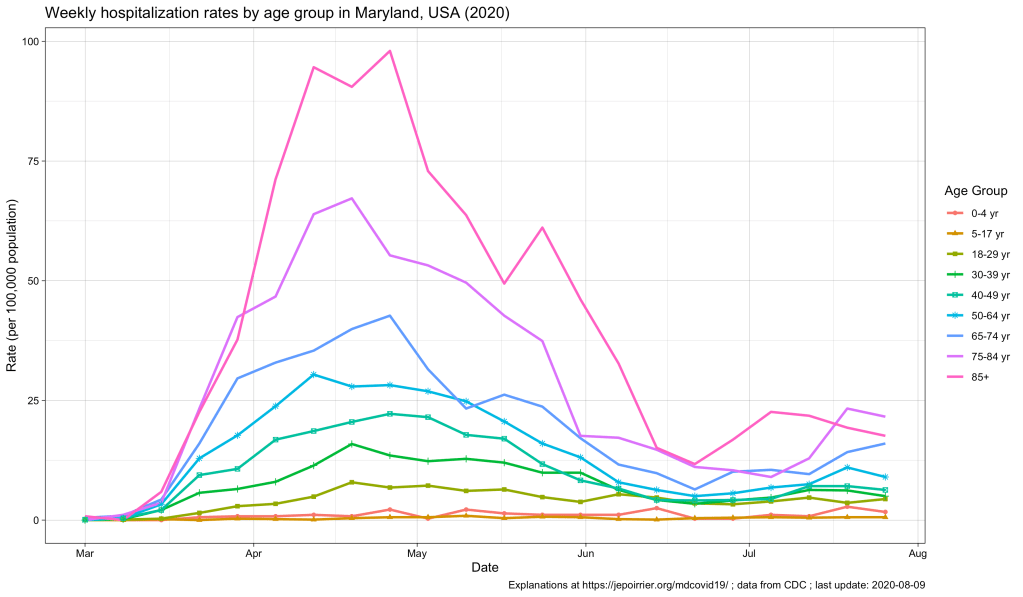
Now, the CDC also has an interactive graph where you can see and filter the data by yourself. Here is the situation up to August 9, 2020, for Maryland:
The peak of April-May is well represented, with the 85+ population reaching a peak at nearly 100 weekly hospitalizations per 100,000 pop. All the other age groups increased during that time, the older the higher (unfortunately).
Now, since July, we see some of these age groups increase again. At the end of July:
Age group
Weekly hospitalization rate
65-74 yr
16.0
75-84 yr
21.6
85+ yr
17.6
Weekly hospitalization rates for the week of July 27, 2020 in Maryland, MD, USA
This, in my opinion, reinforce the view that, cases might be increasing in the younger population (also thanks to testing being more available) and children and young adults might be less impacted when infected. But the older population is the first impacted by any increase in cases. It was true in April-May. It is again the case with this small peak. If we should take preventative measures to contain COVID-19, it is for us – but especially for the older population, our parents.