This page is looking at trends in COVID-19 cases in Maryland, USA.
I started this page to gather in one place all links to my blog posts on specific aspects of COVID-19 in Maryland, links to tools I developed as well as all figures generated (at the bottom). This was updated as new posts/tools/figures were written but please note that I don’t live in Maryland anymore (but I still love this state!). If you want to update all these analysis, all my code and figures are here, for free. And, as always, feel free to [send me suggestions, comments and questions](mailto:jepoirrier@gmail.com?subject=MDCOVID19 blog)!
Note that if you want official information about COVID-19, please visit the Maryland Department of Health. And as always, scientific and understandable information is on the CDC website.
Blog posts:
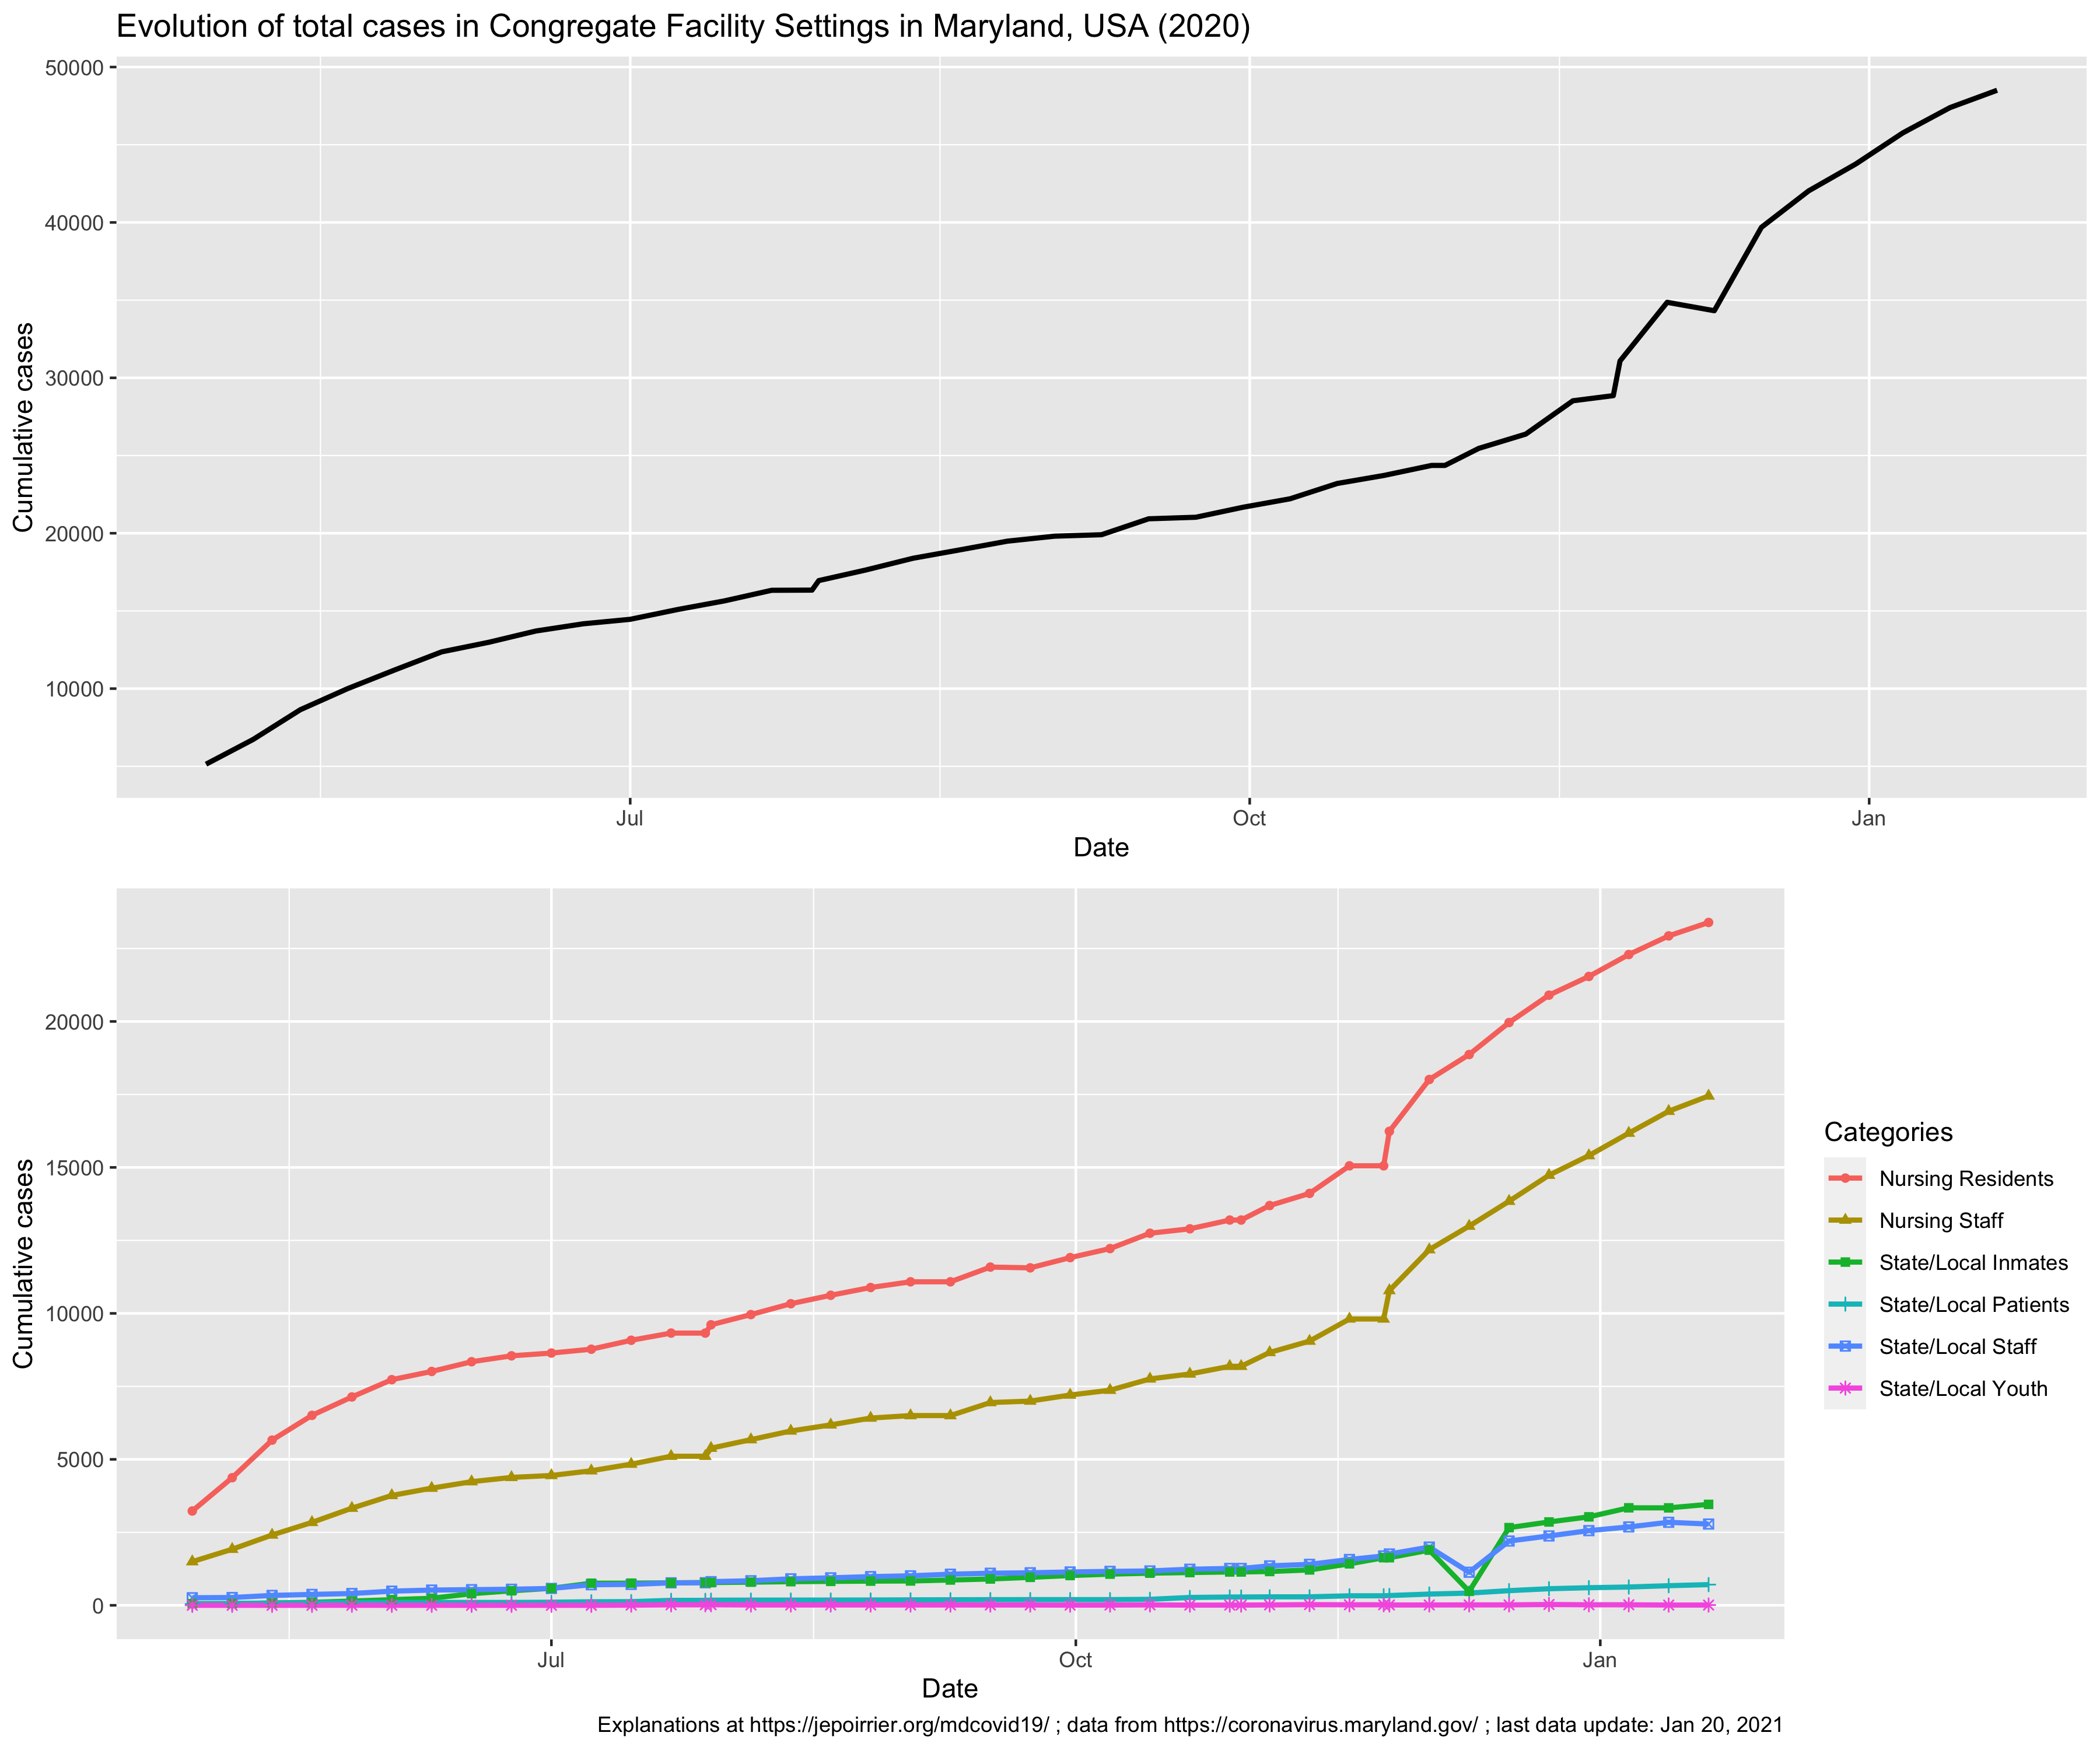
- November 15 - COVID-19 cases in Maryland congregate living facilities
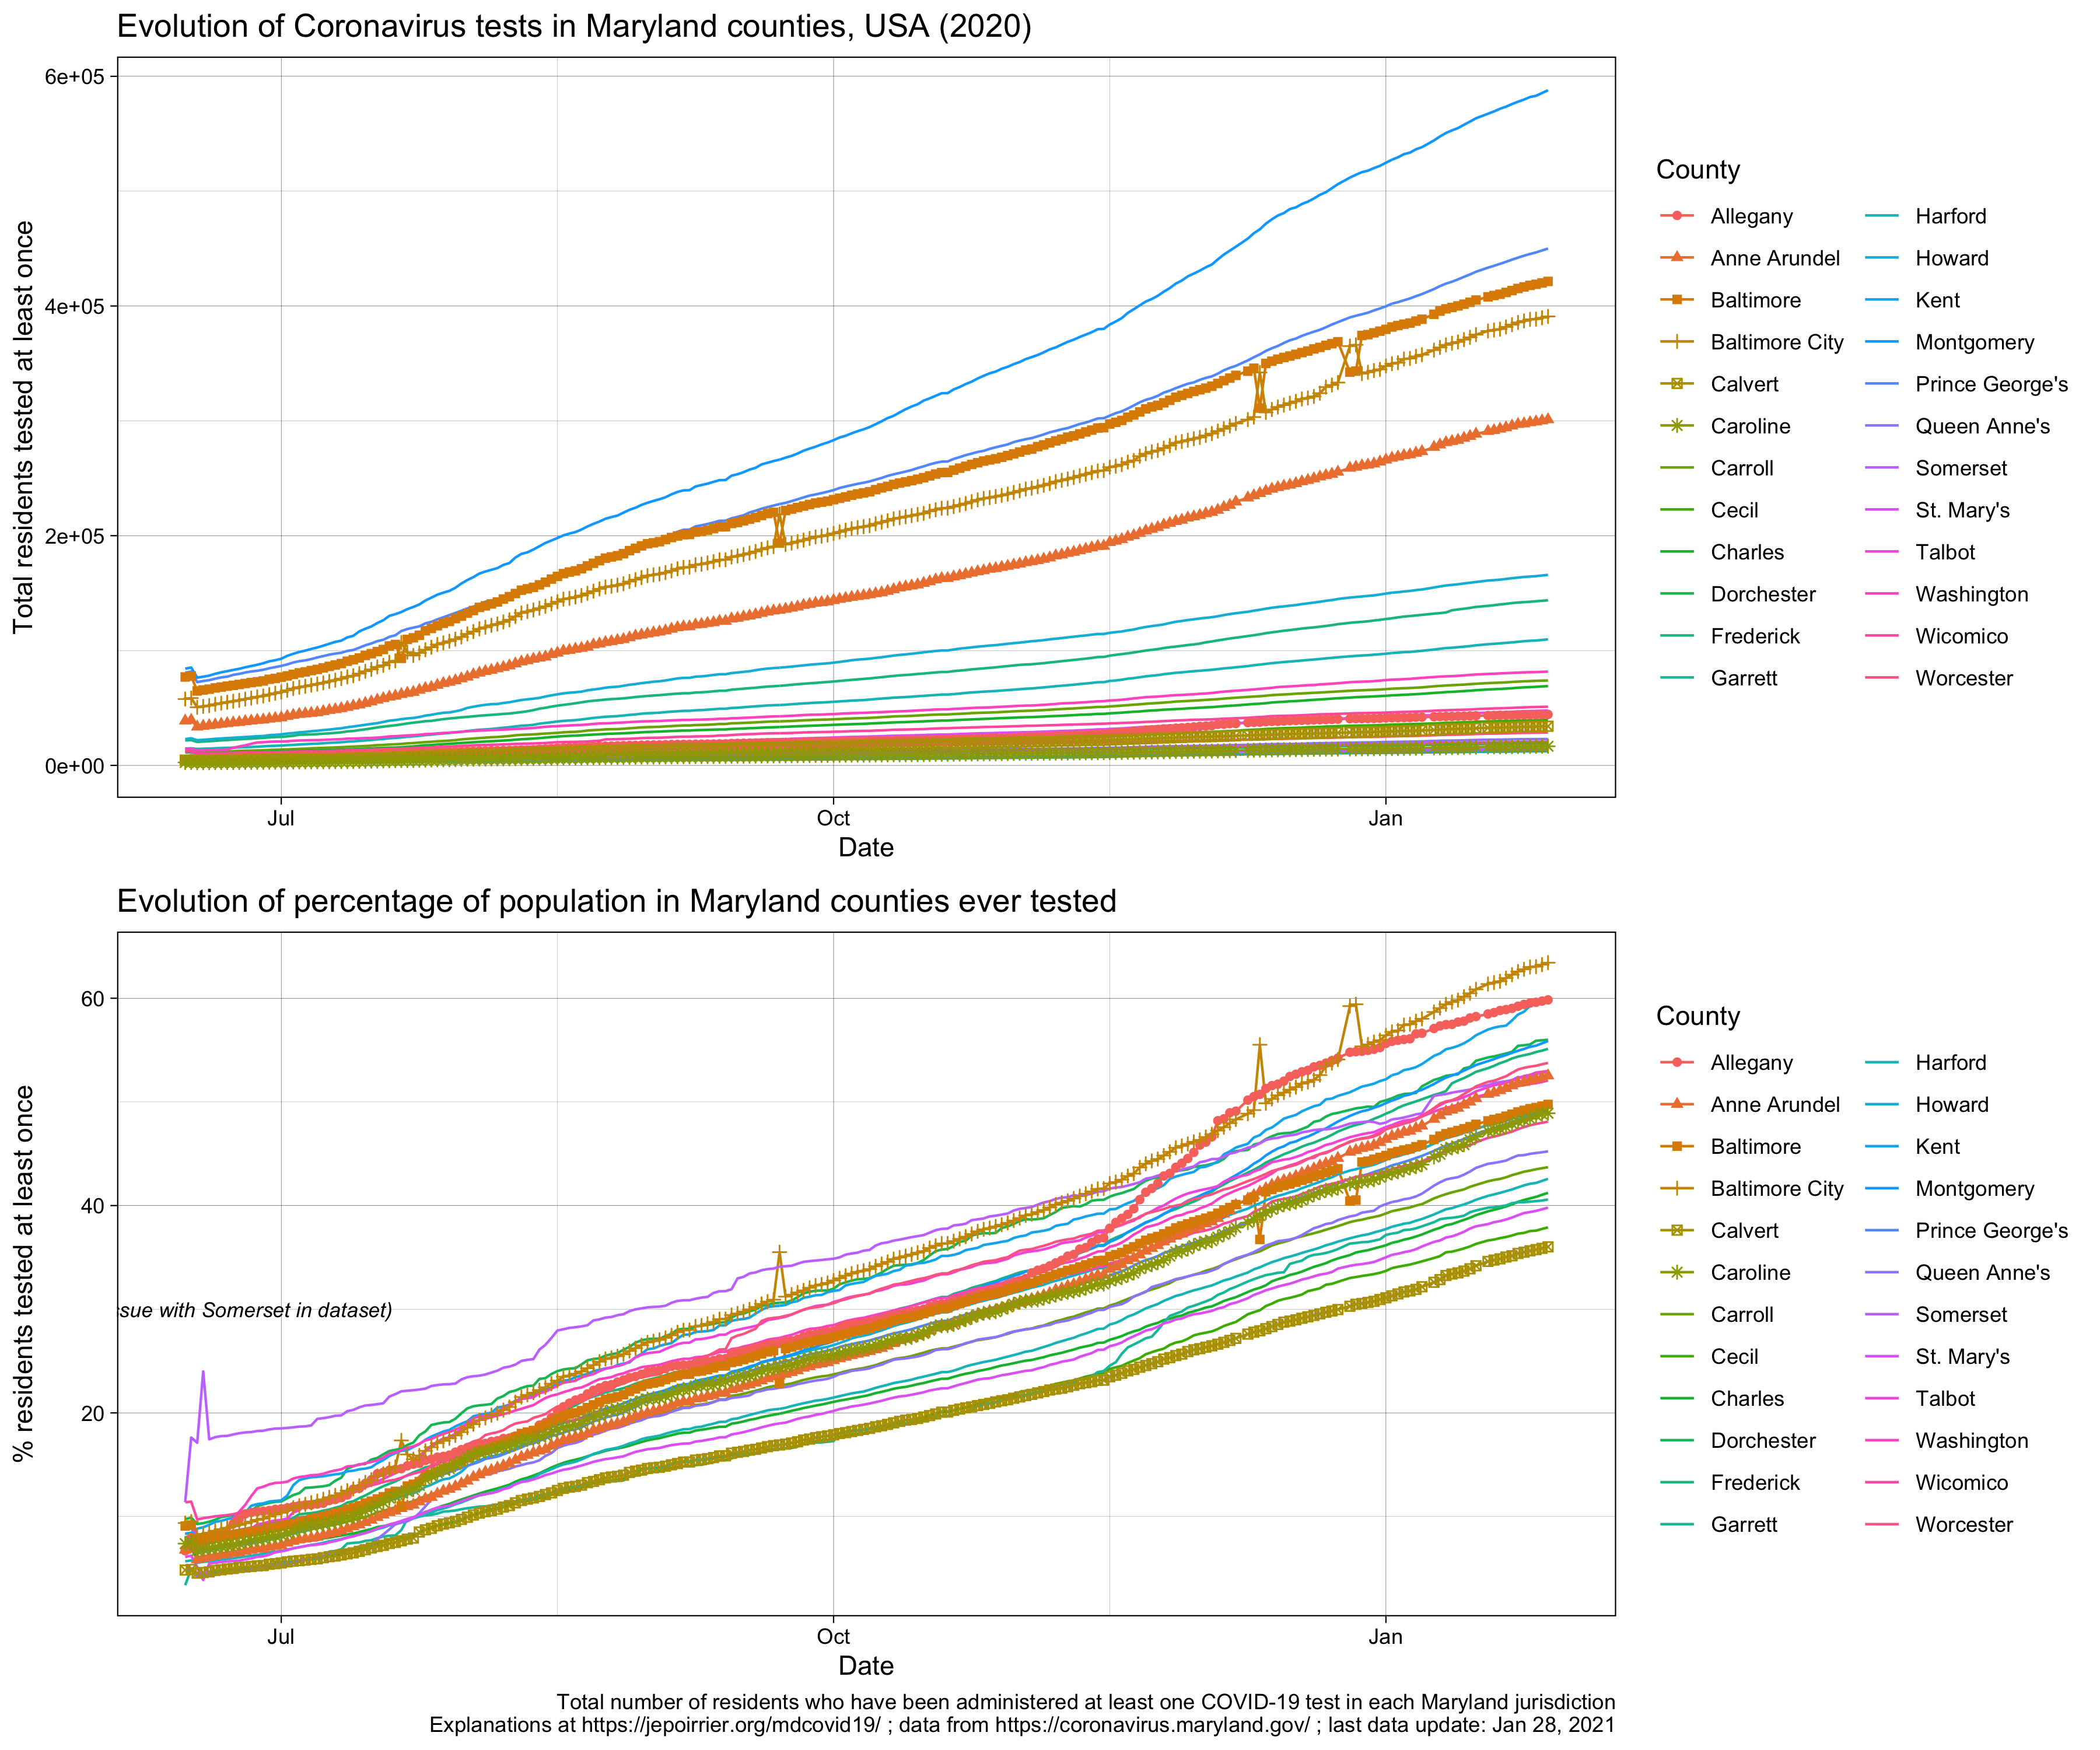
- August 11 - A third of Maryland counties tested more than 25% of residents
- August 9 - COVID-19 hospitalization by age in Maryland
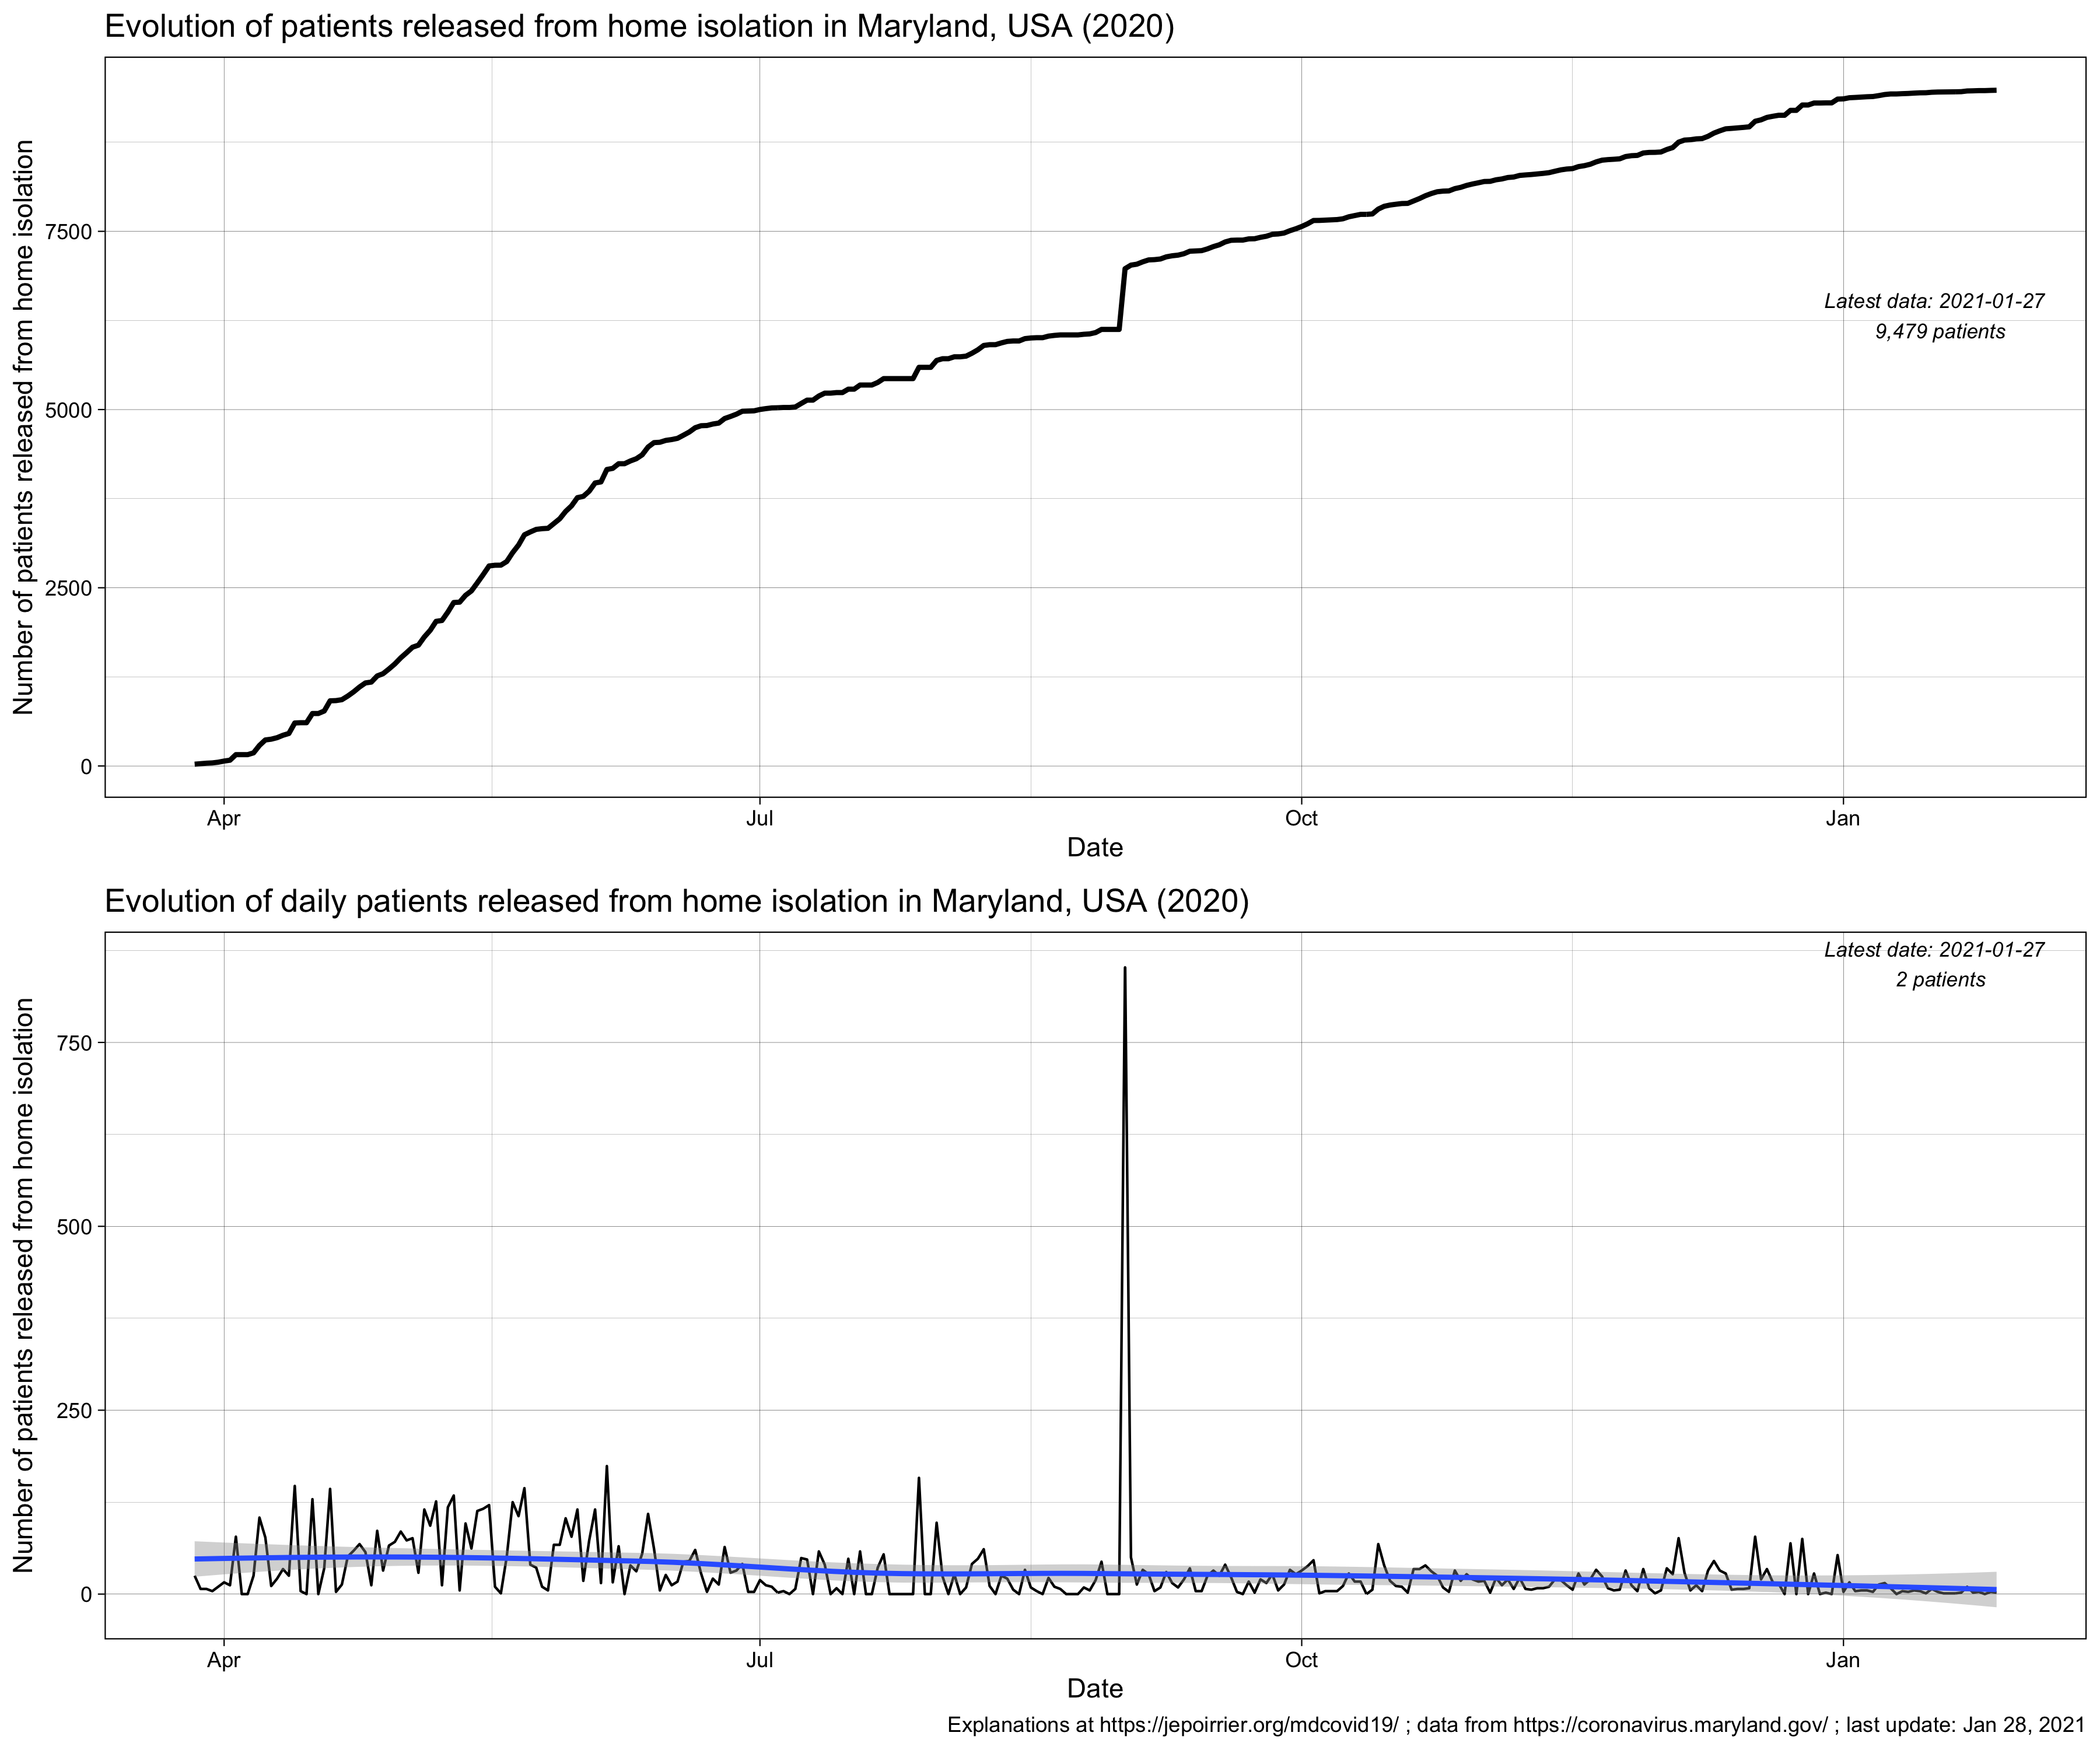
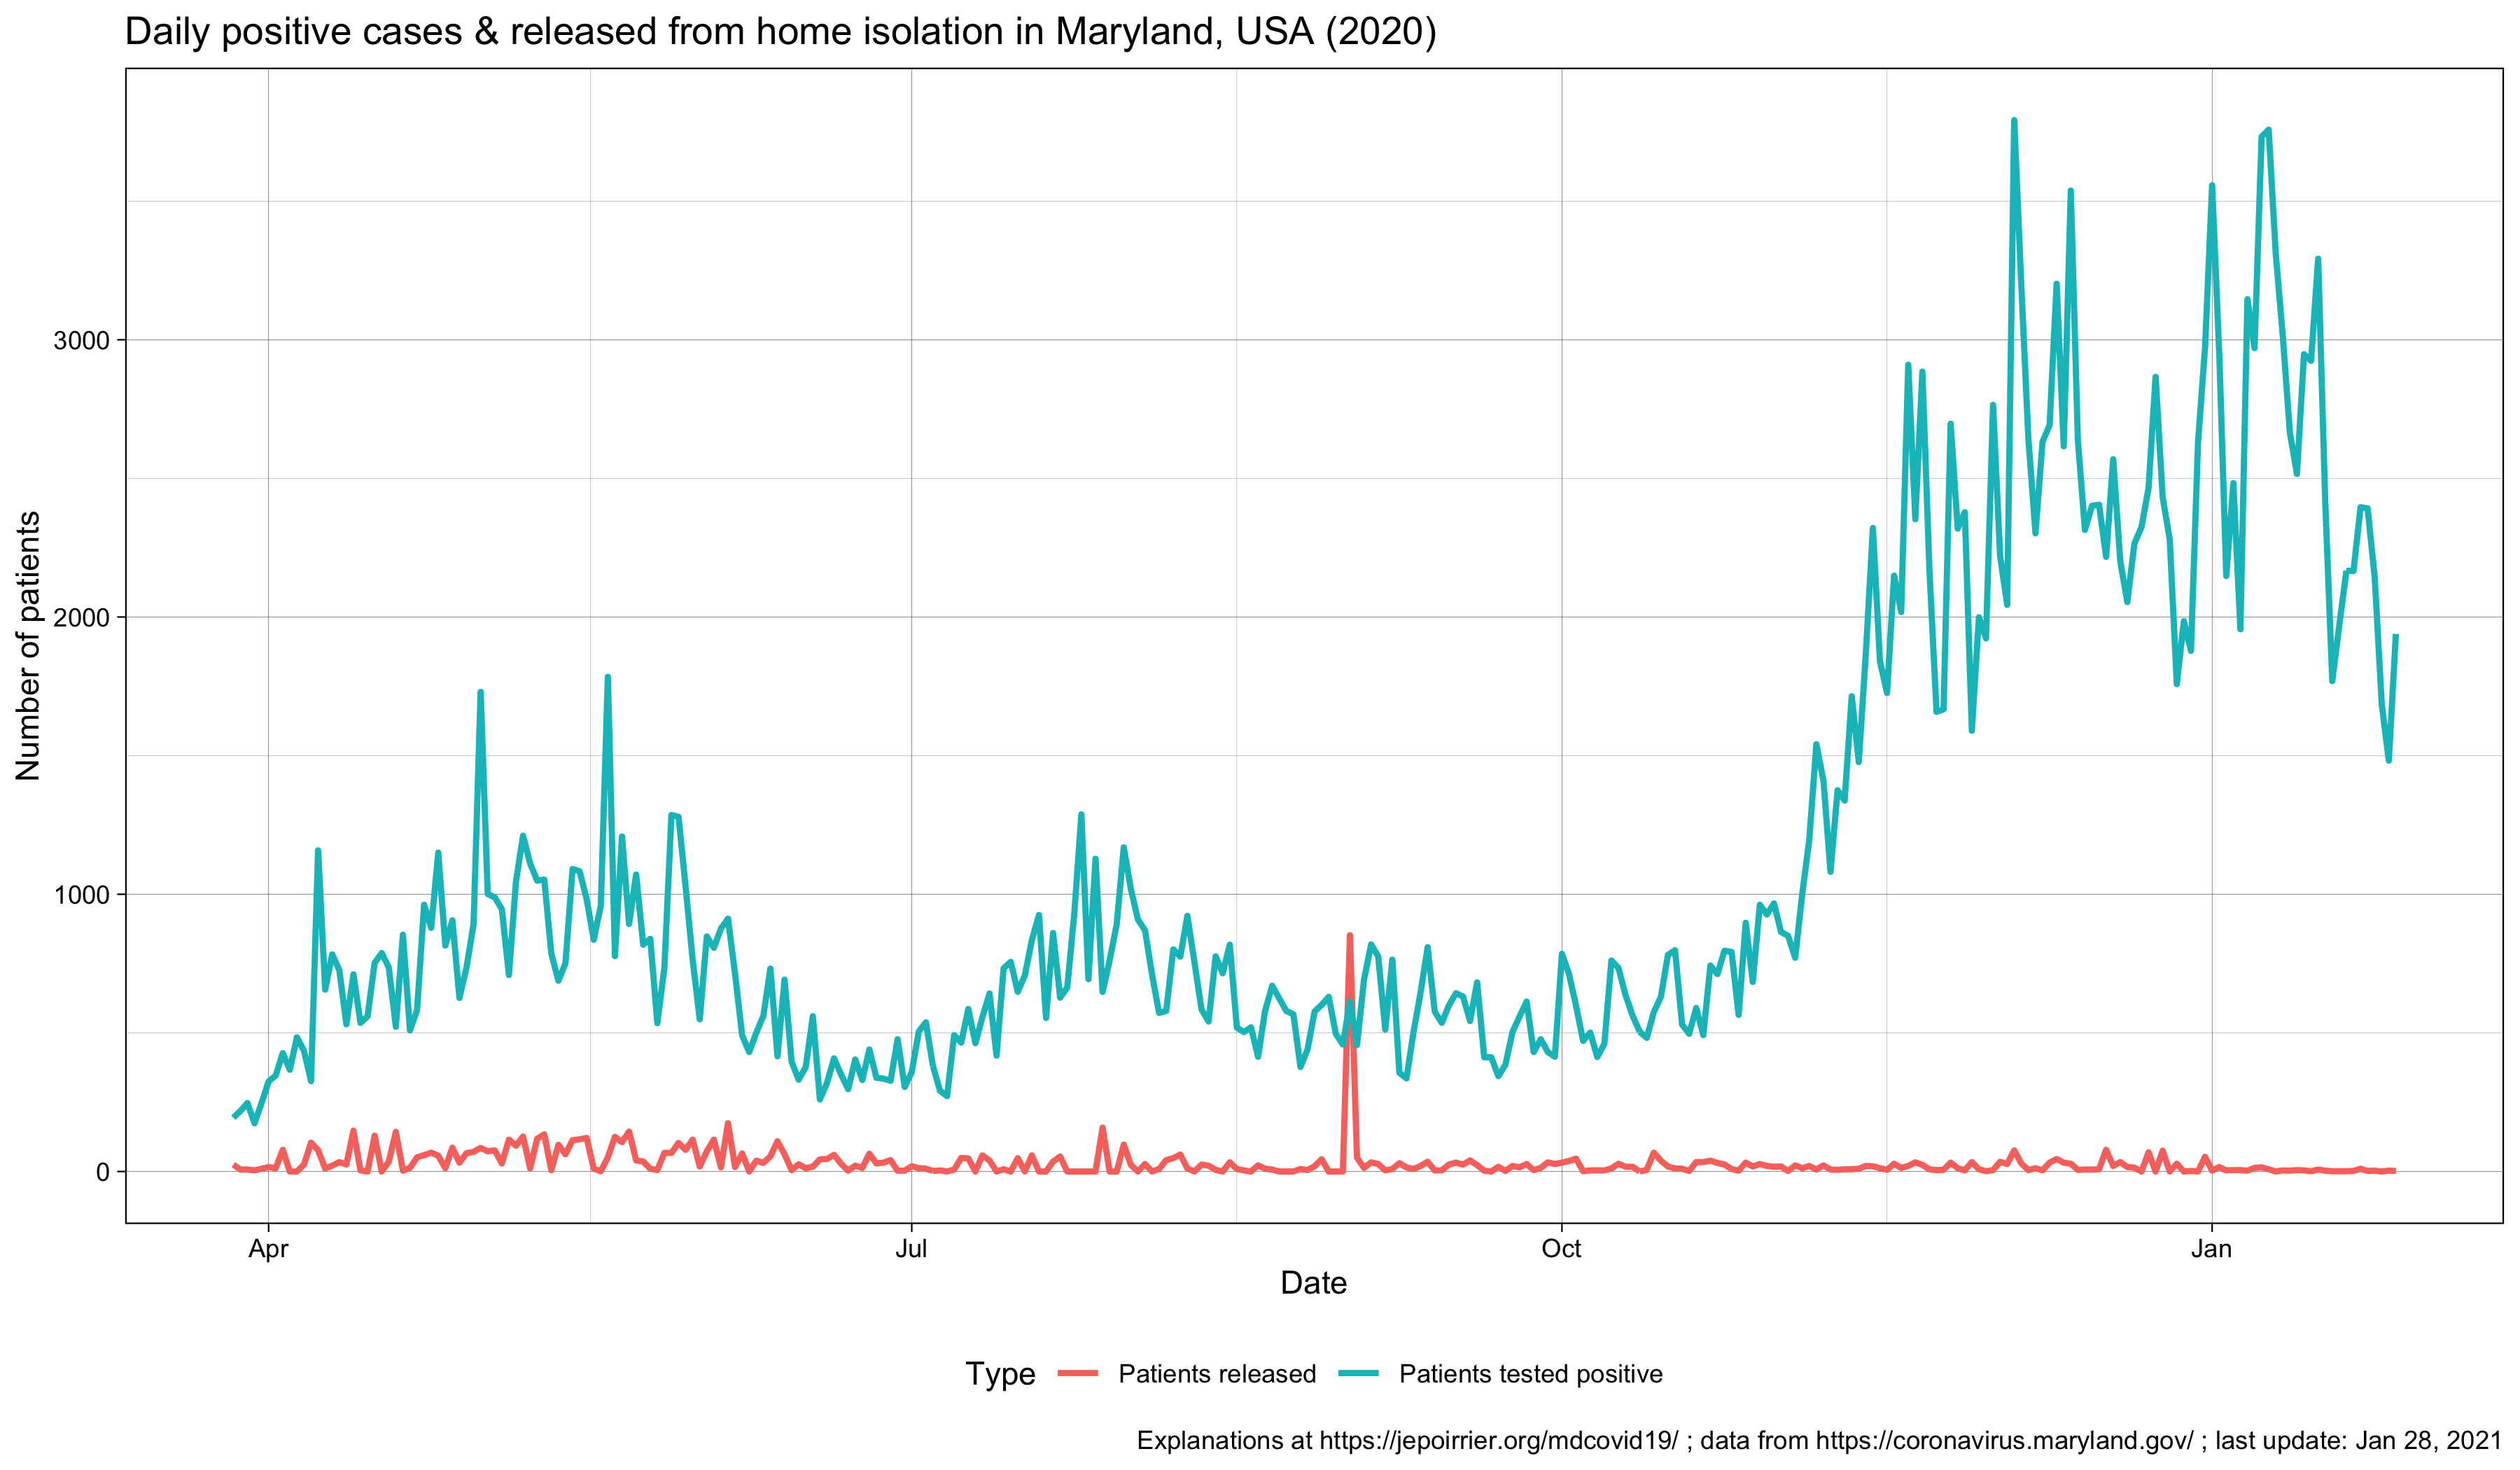
- August 5 - What does release from home isolation mean in Maryland?
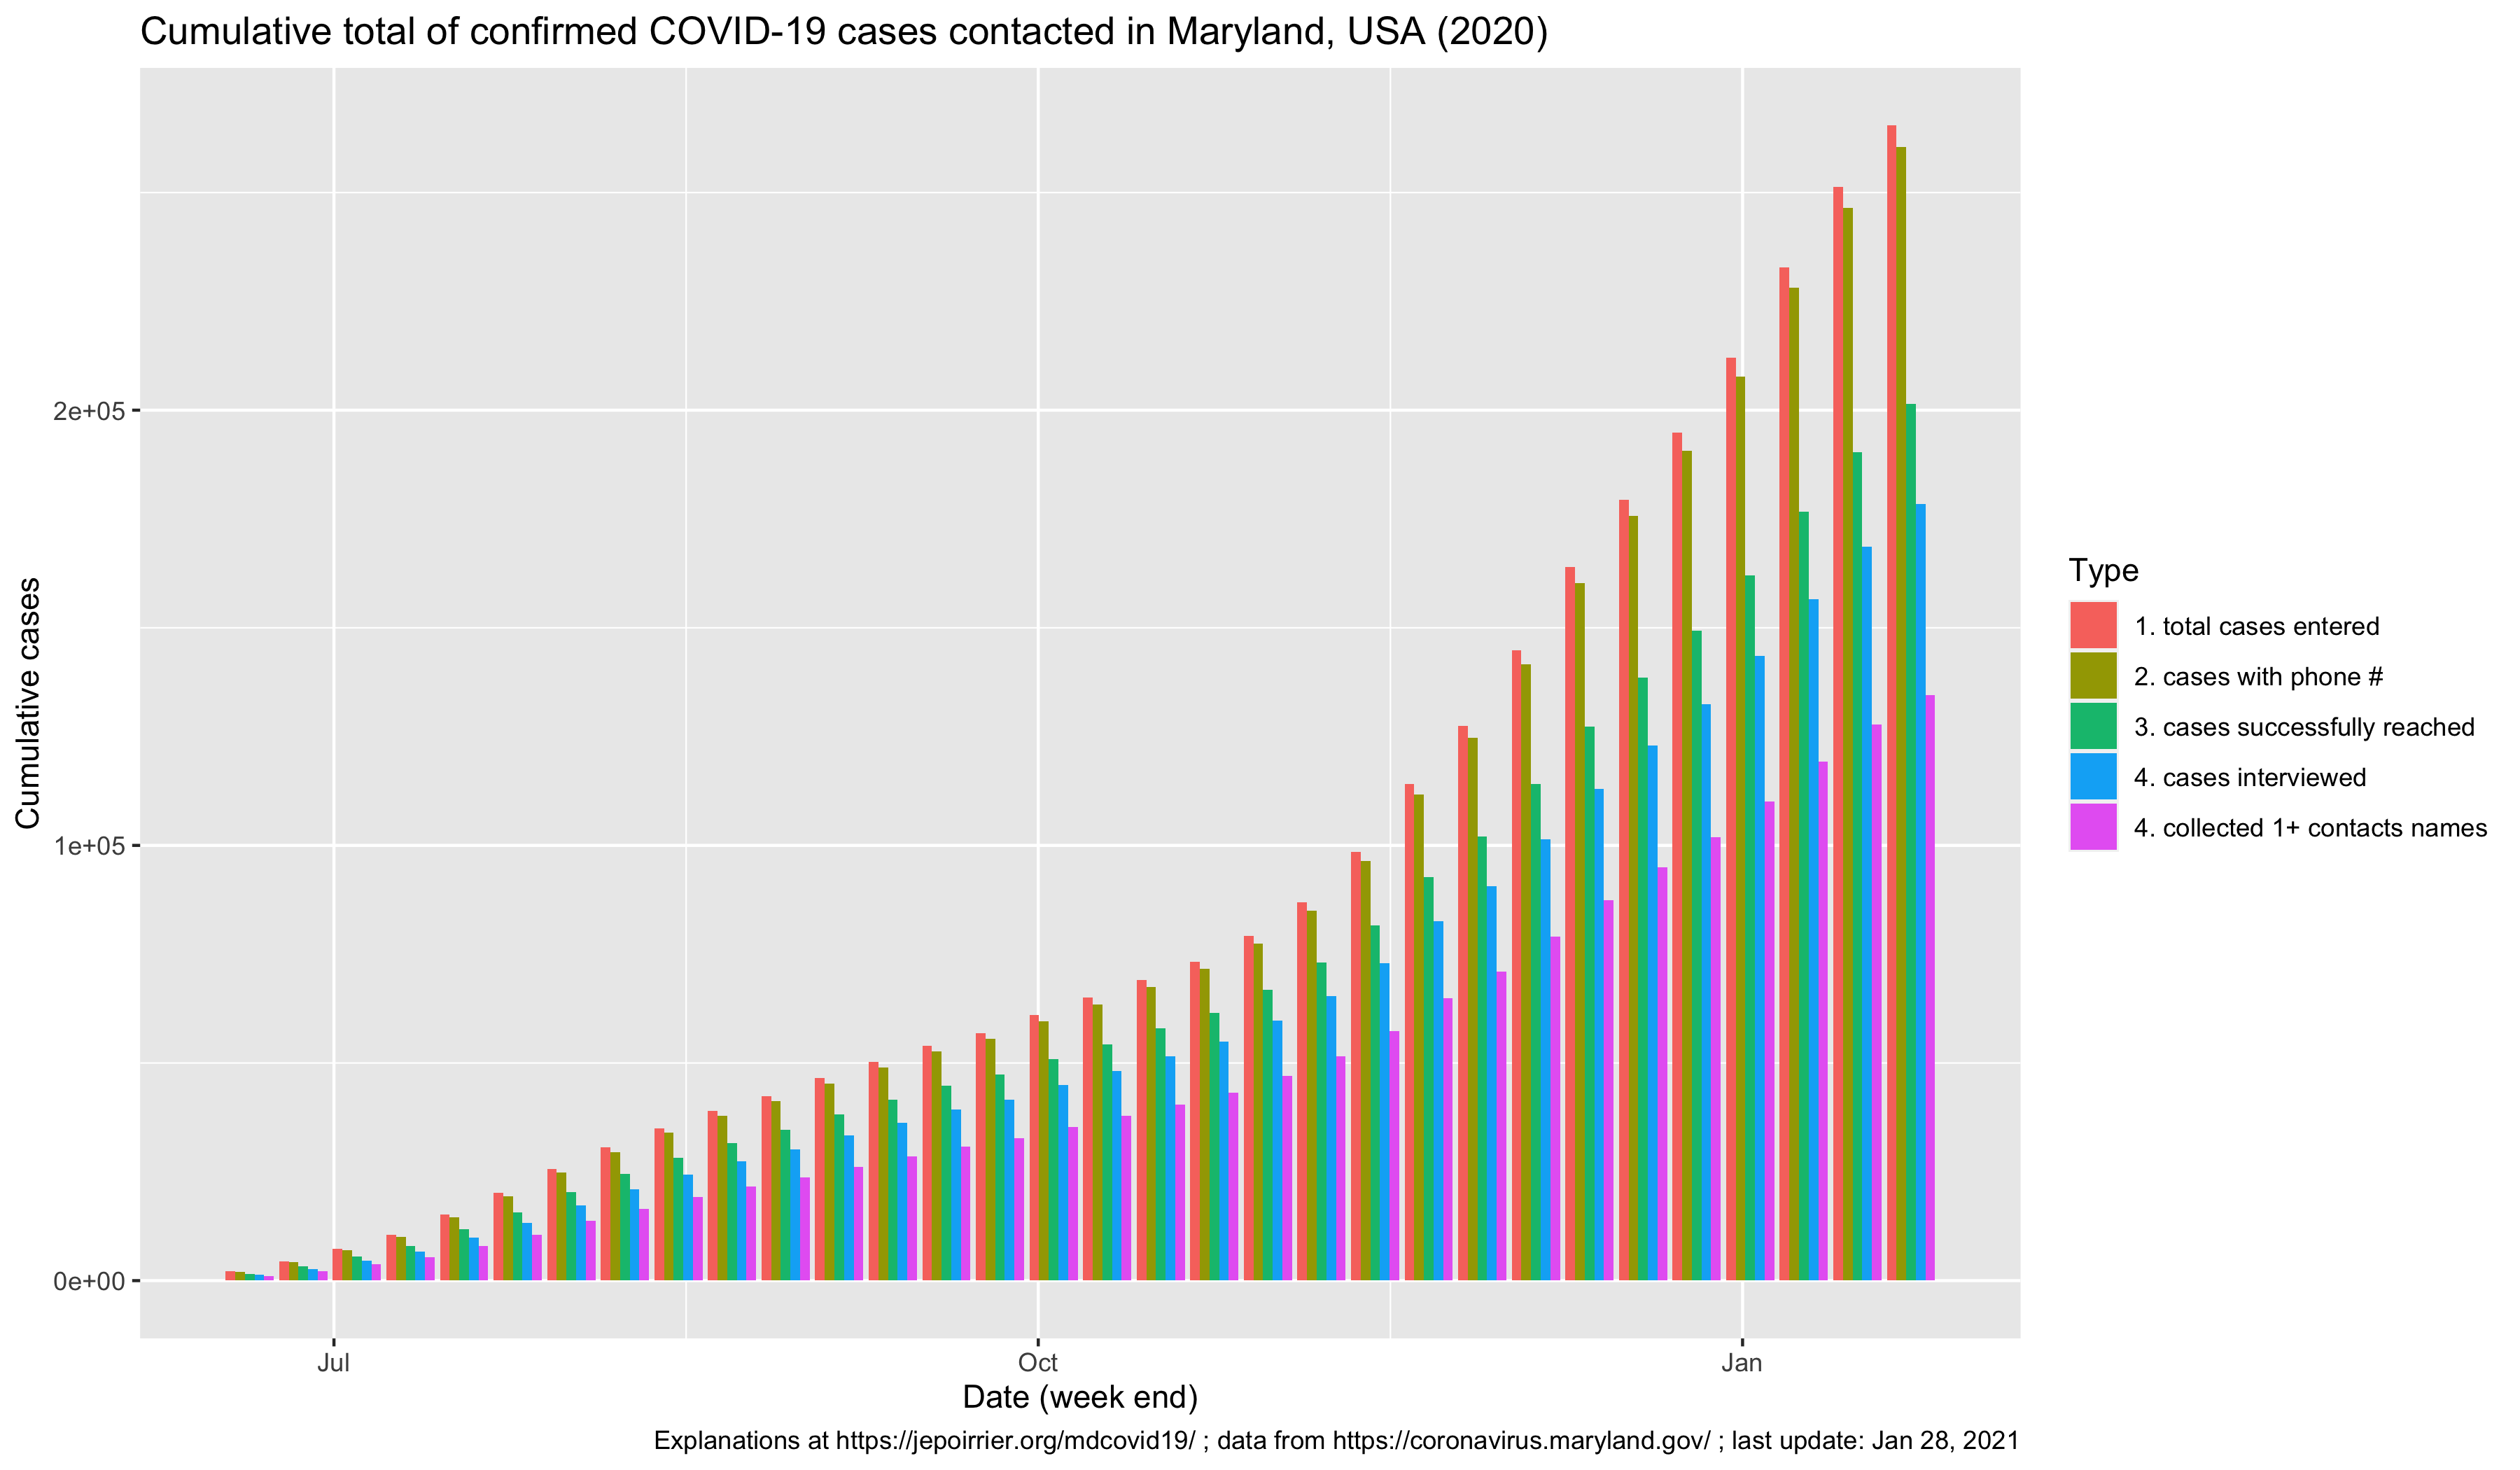
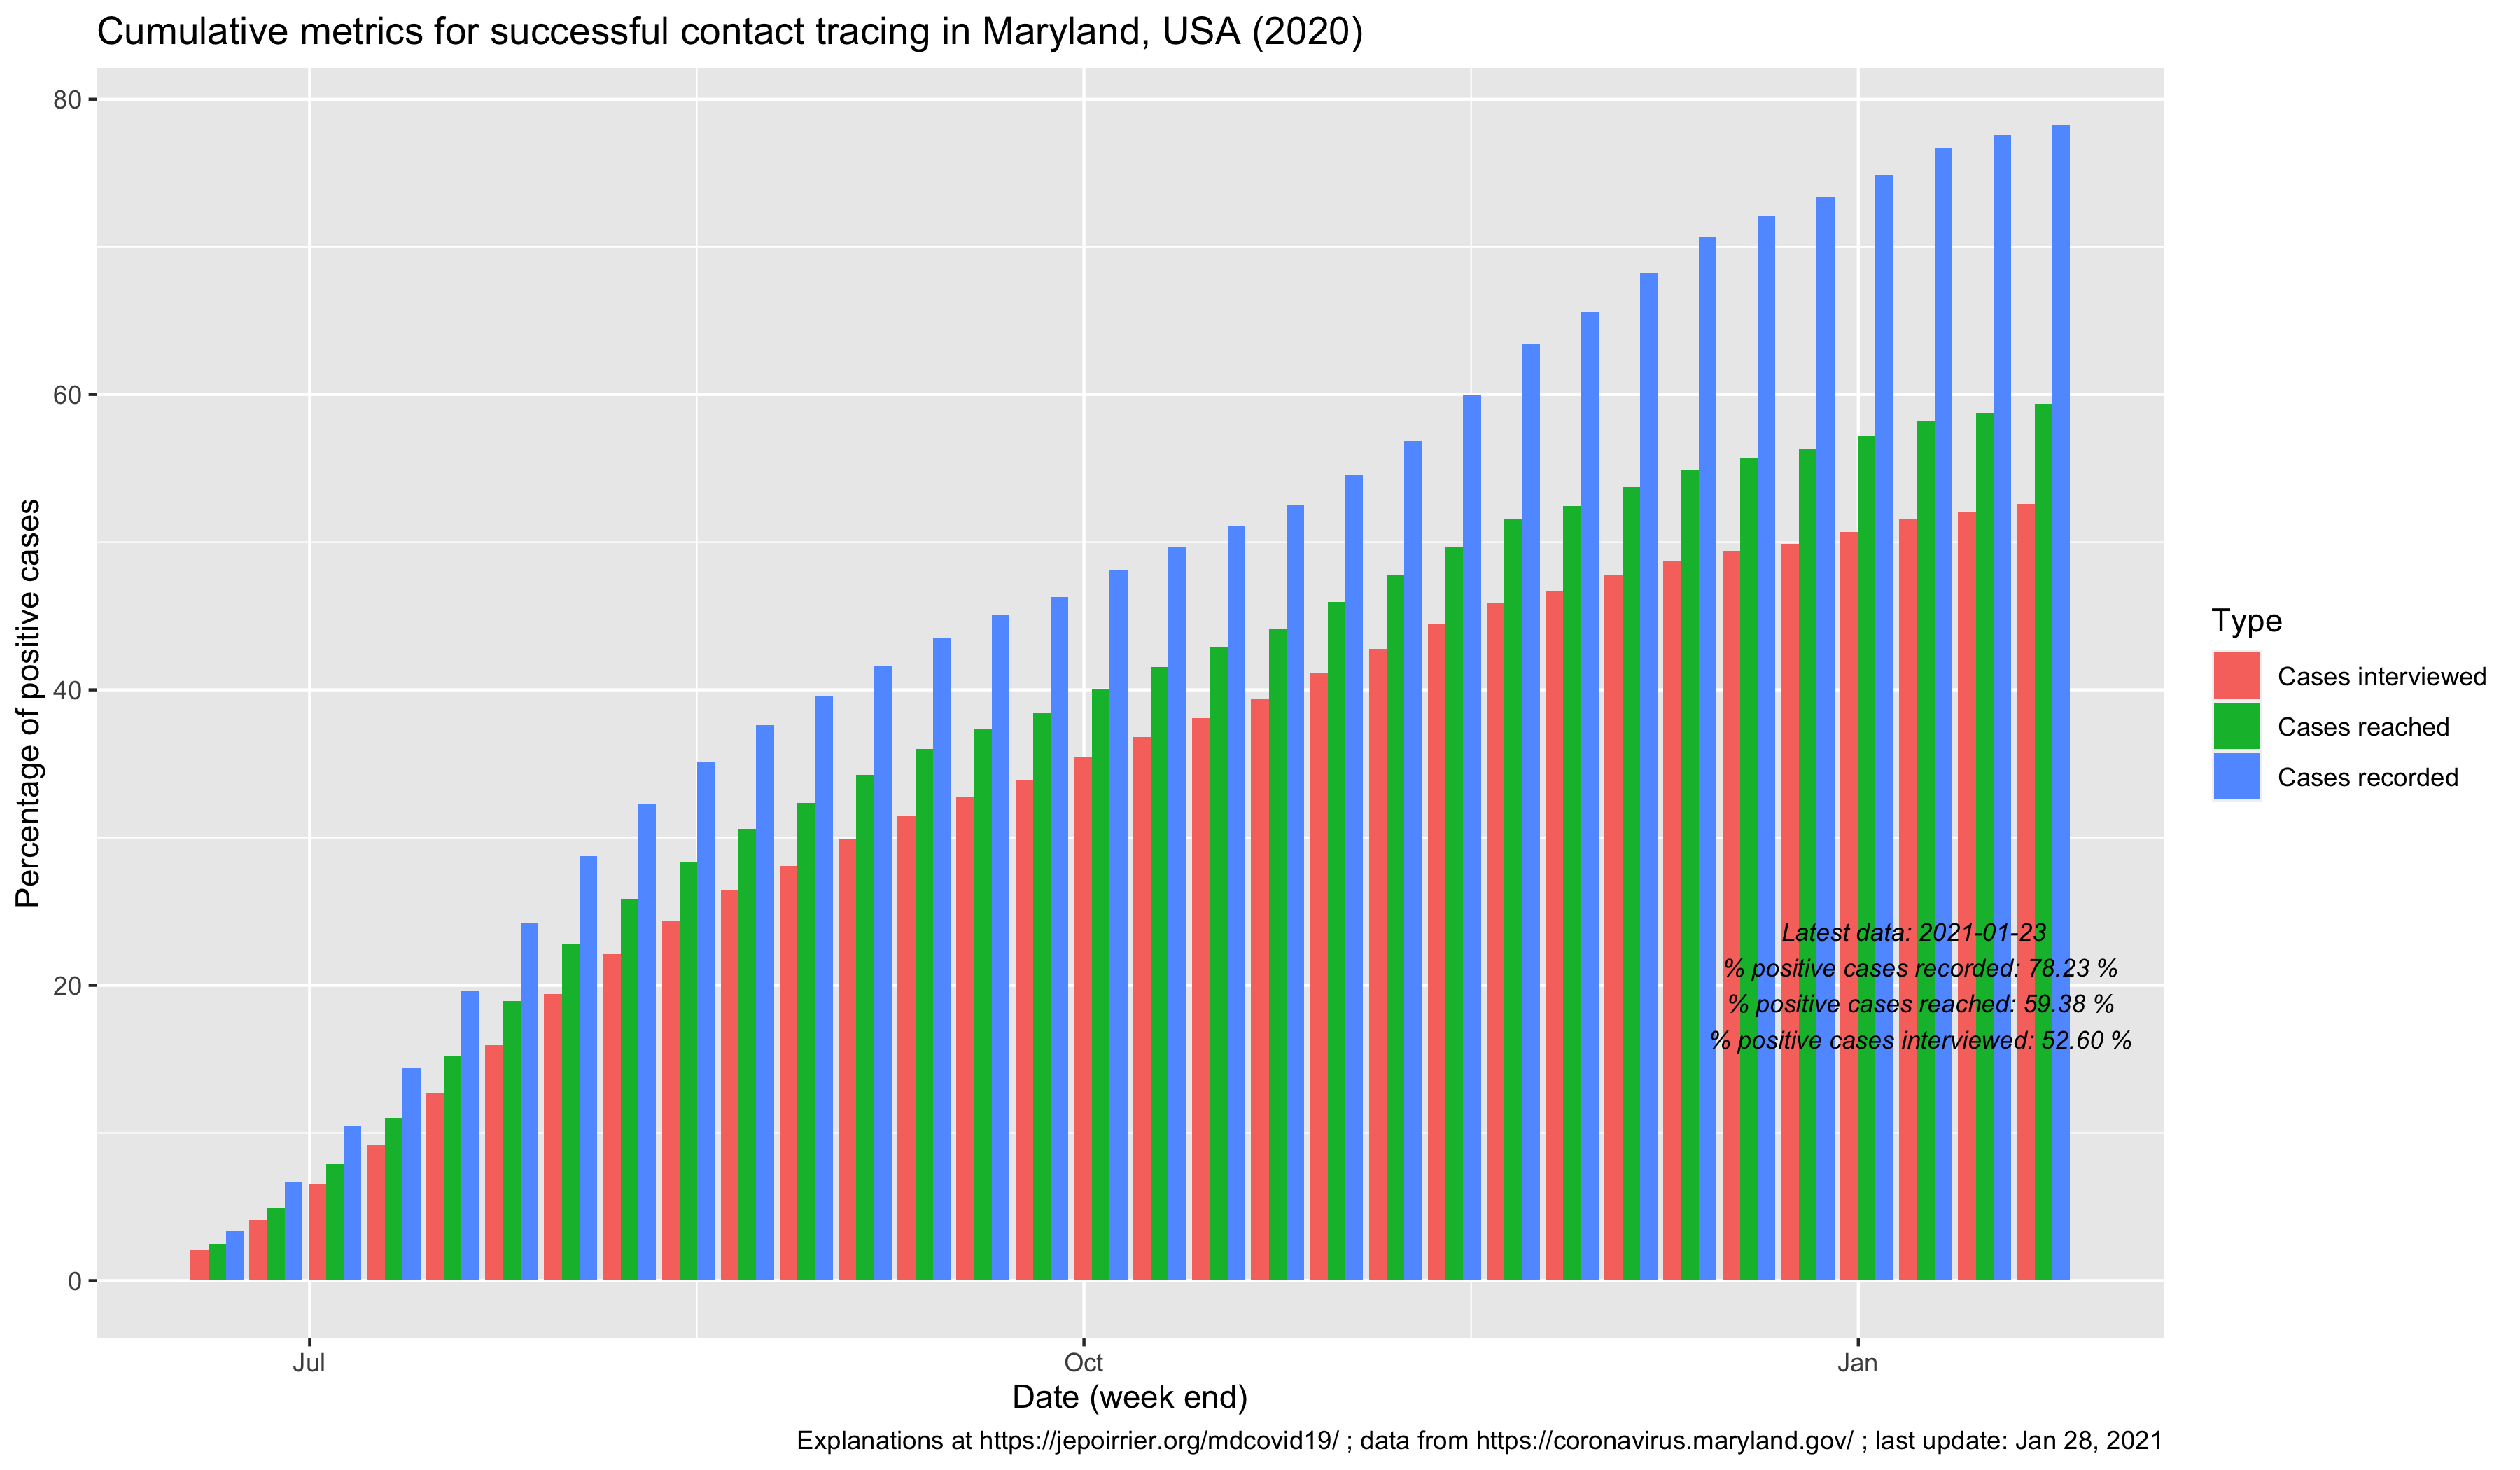
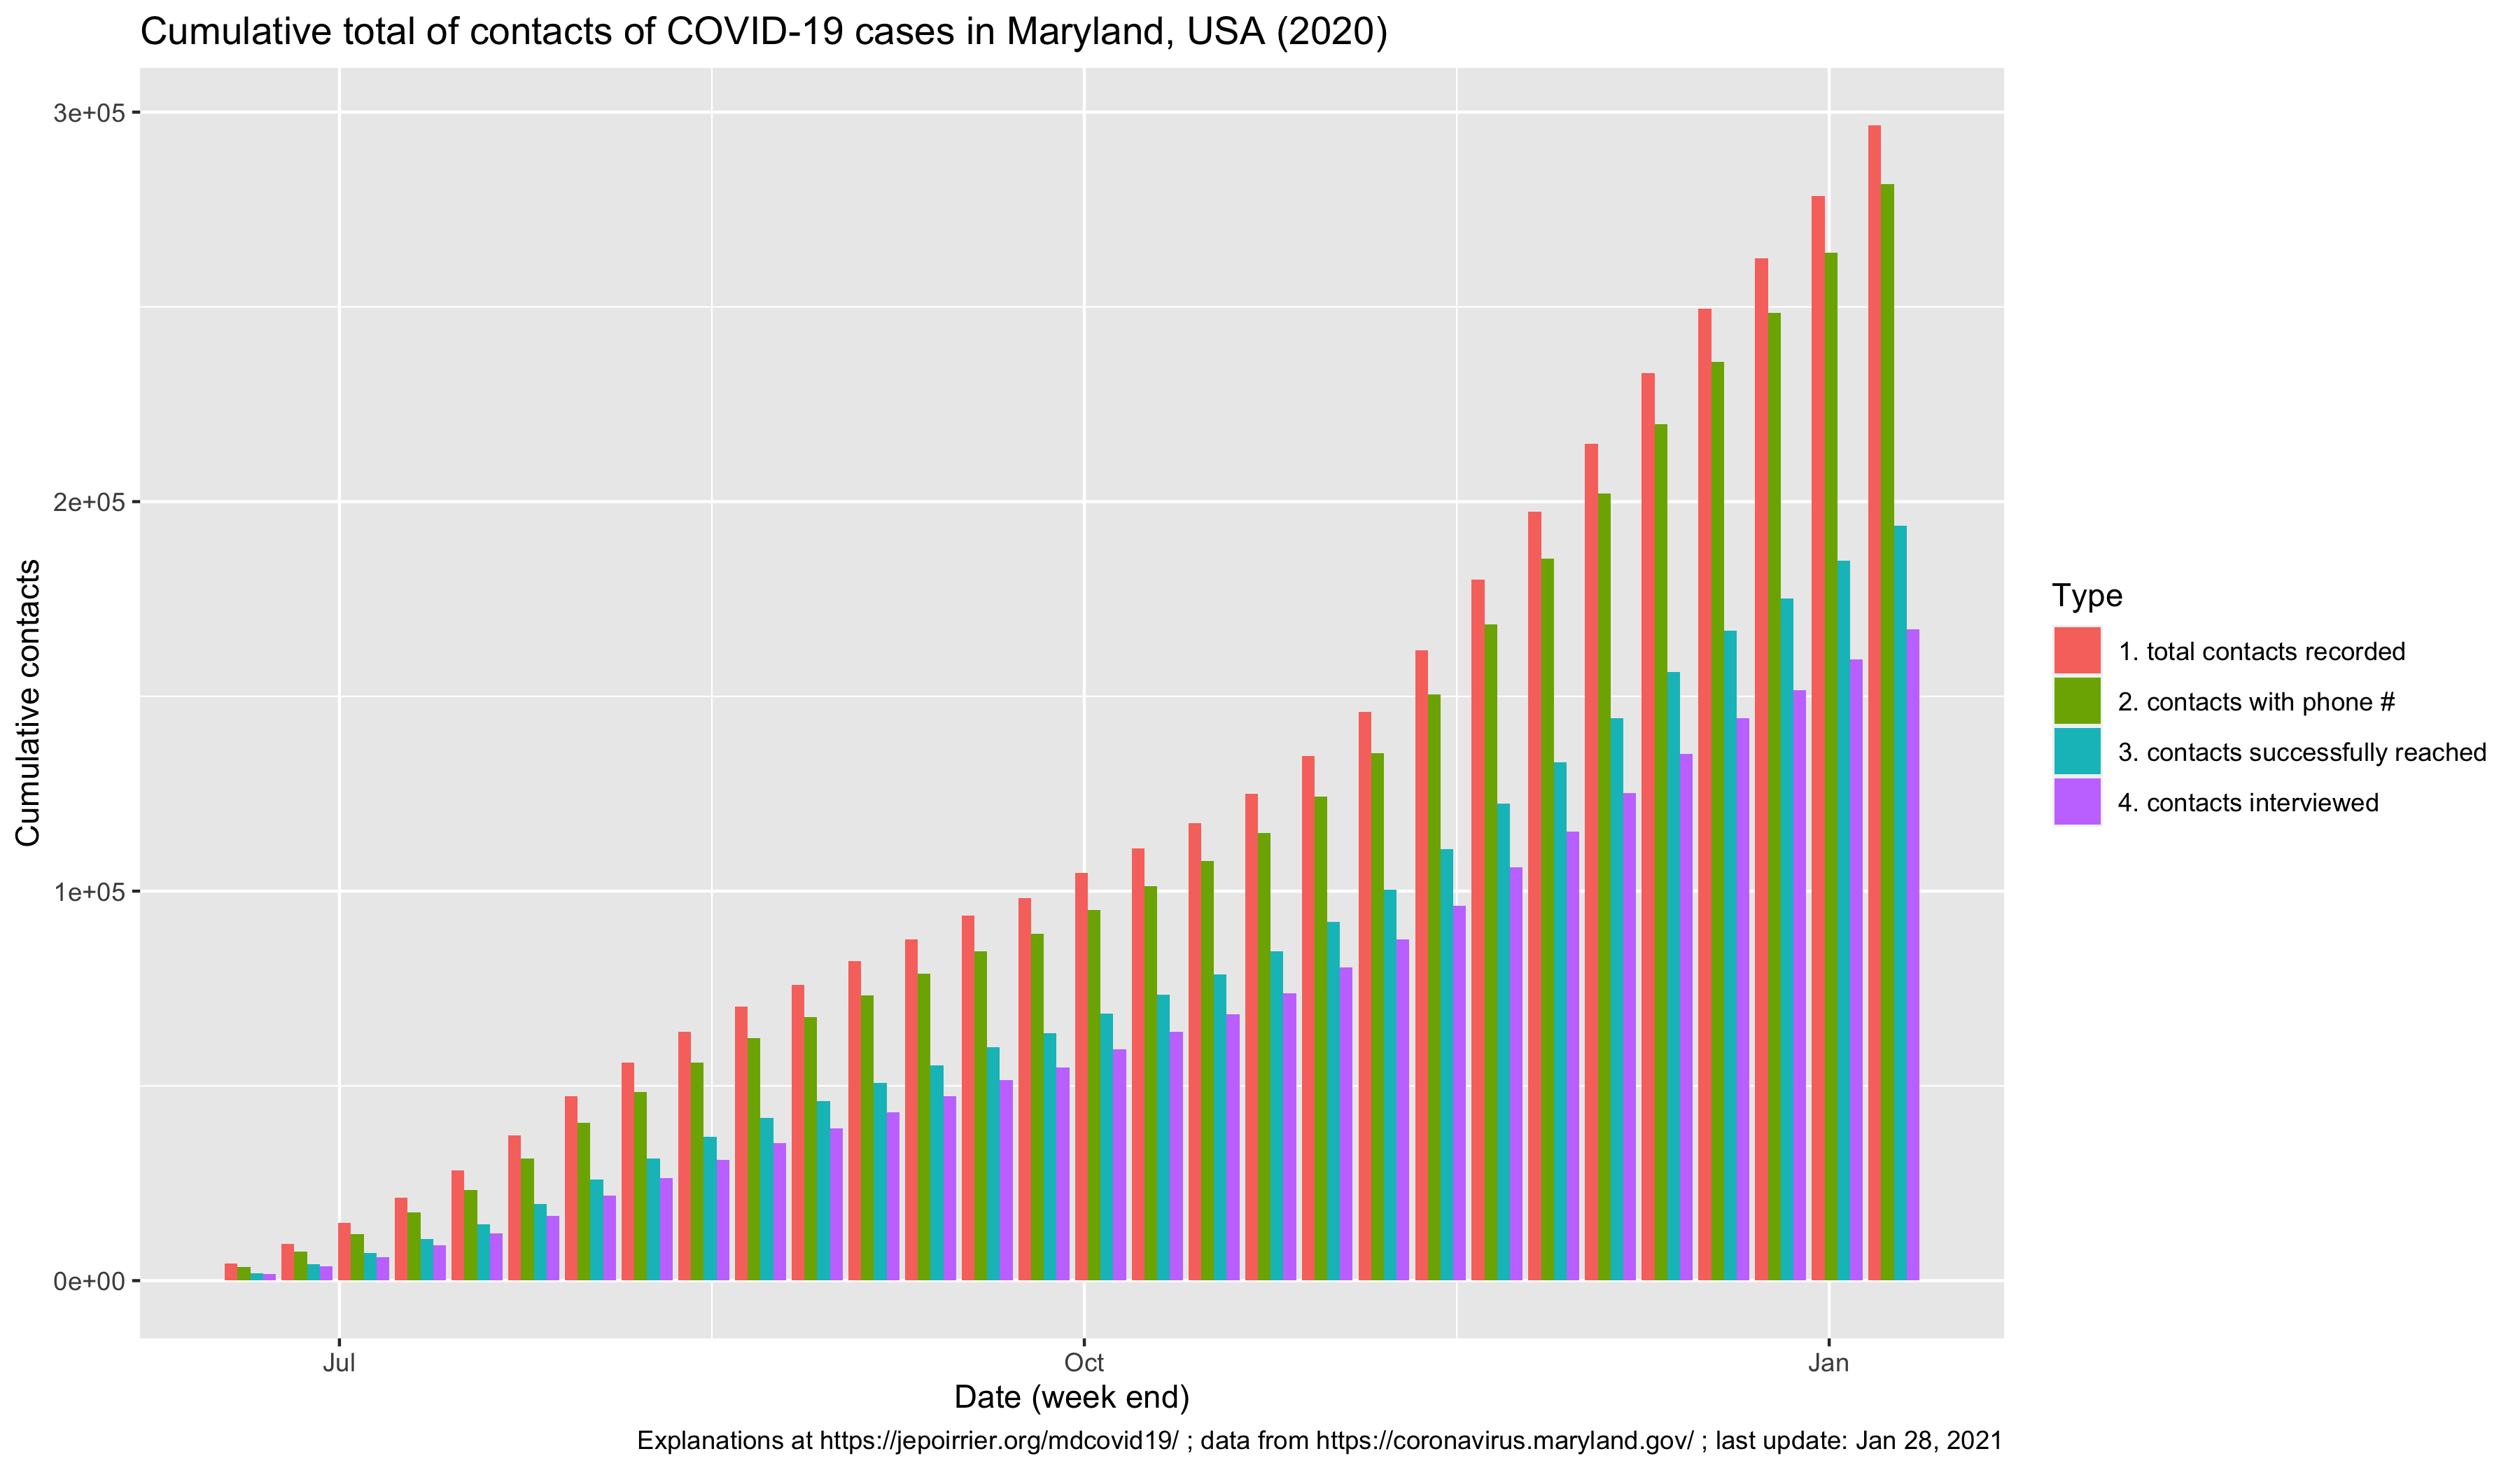
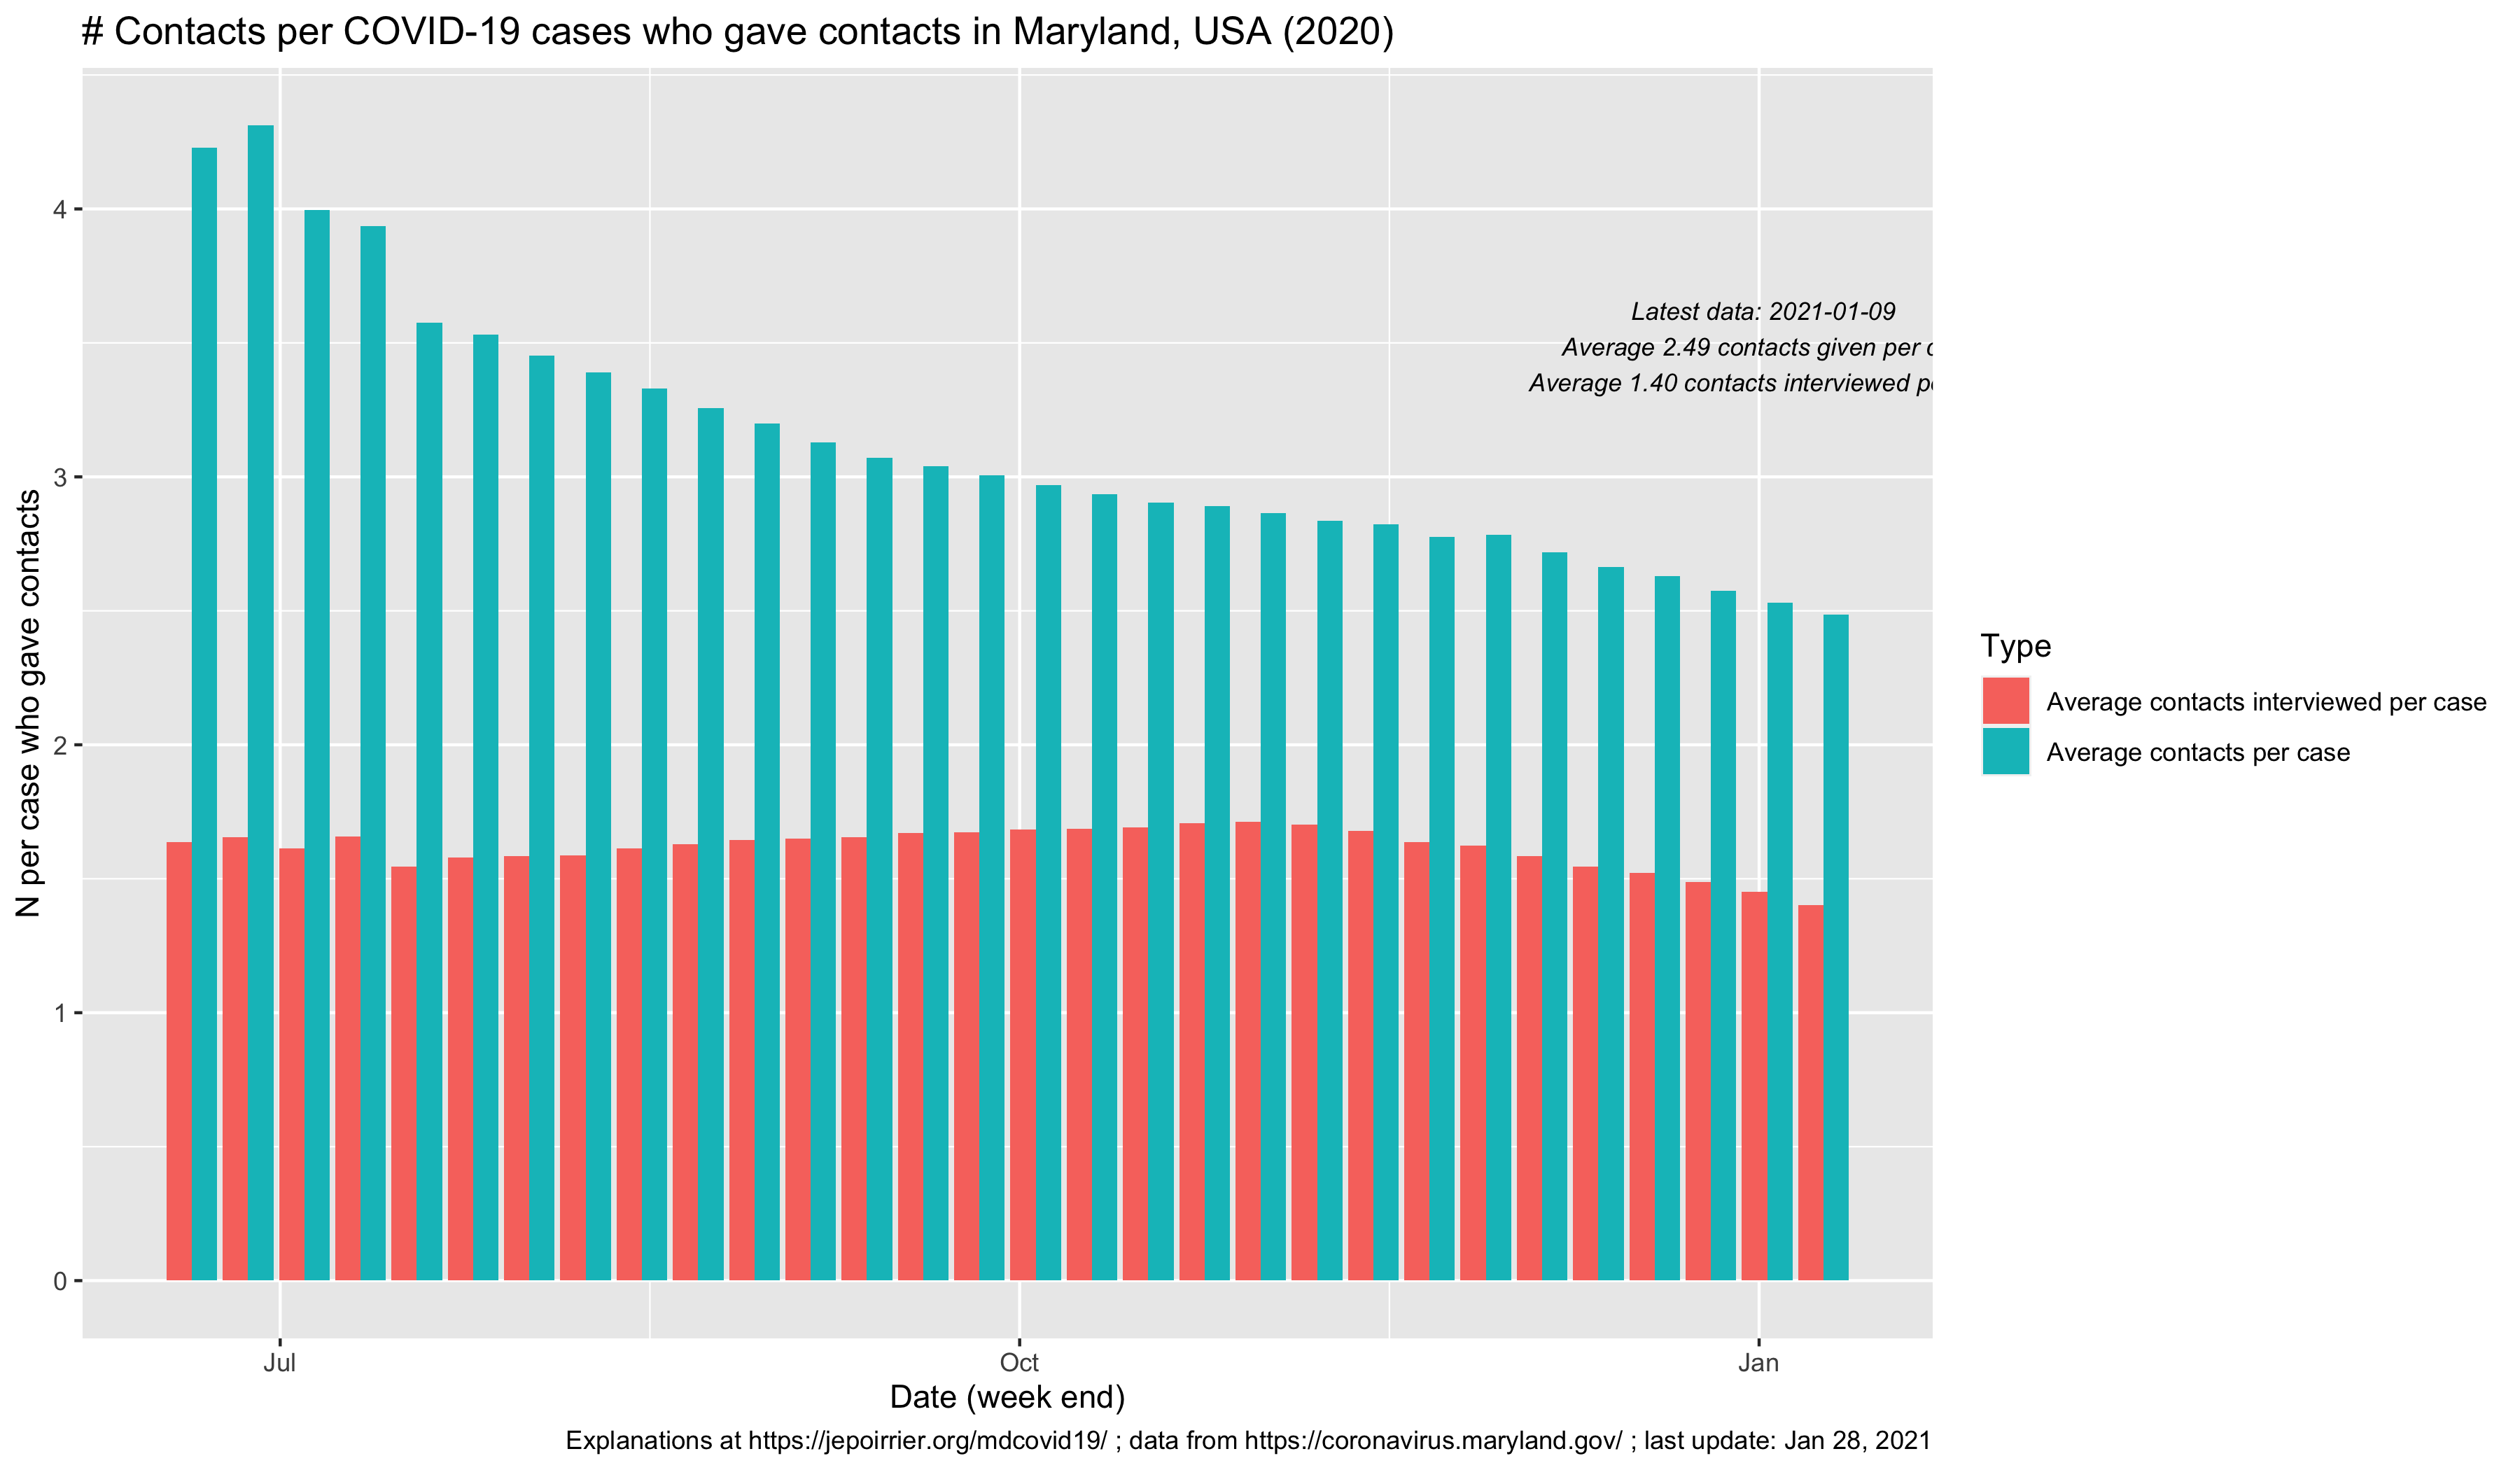
- August 3 - A first insight on COVID-19 contact tracing in Maryland
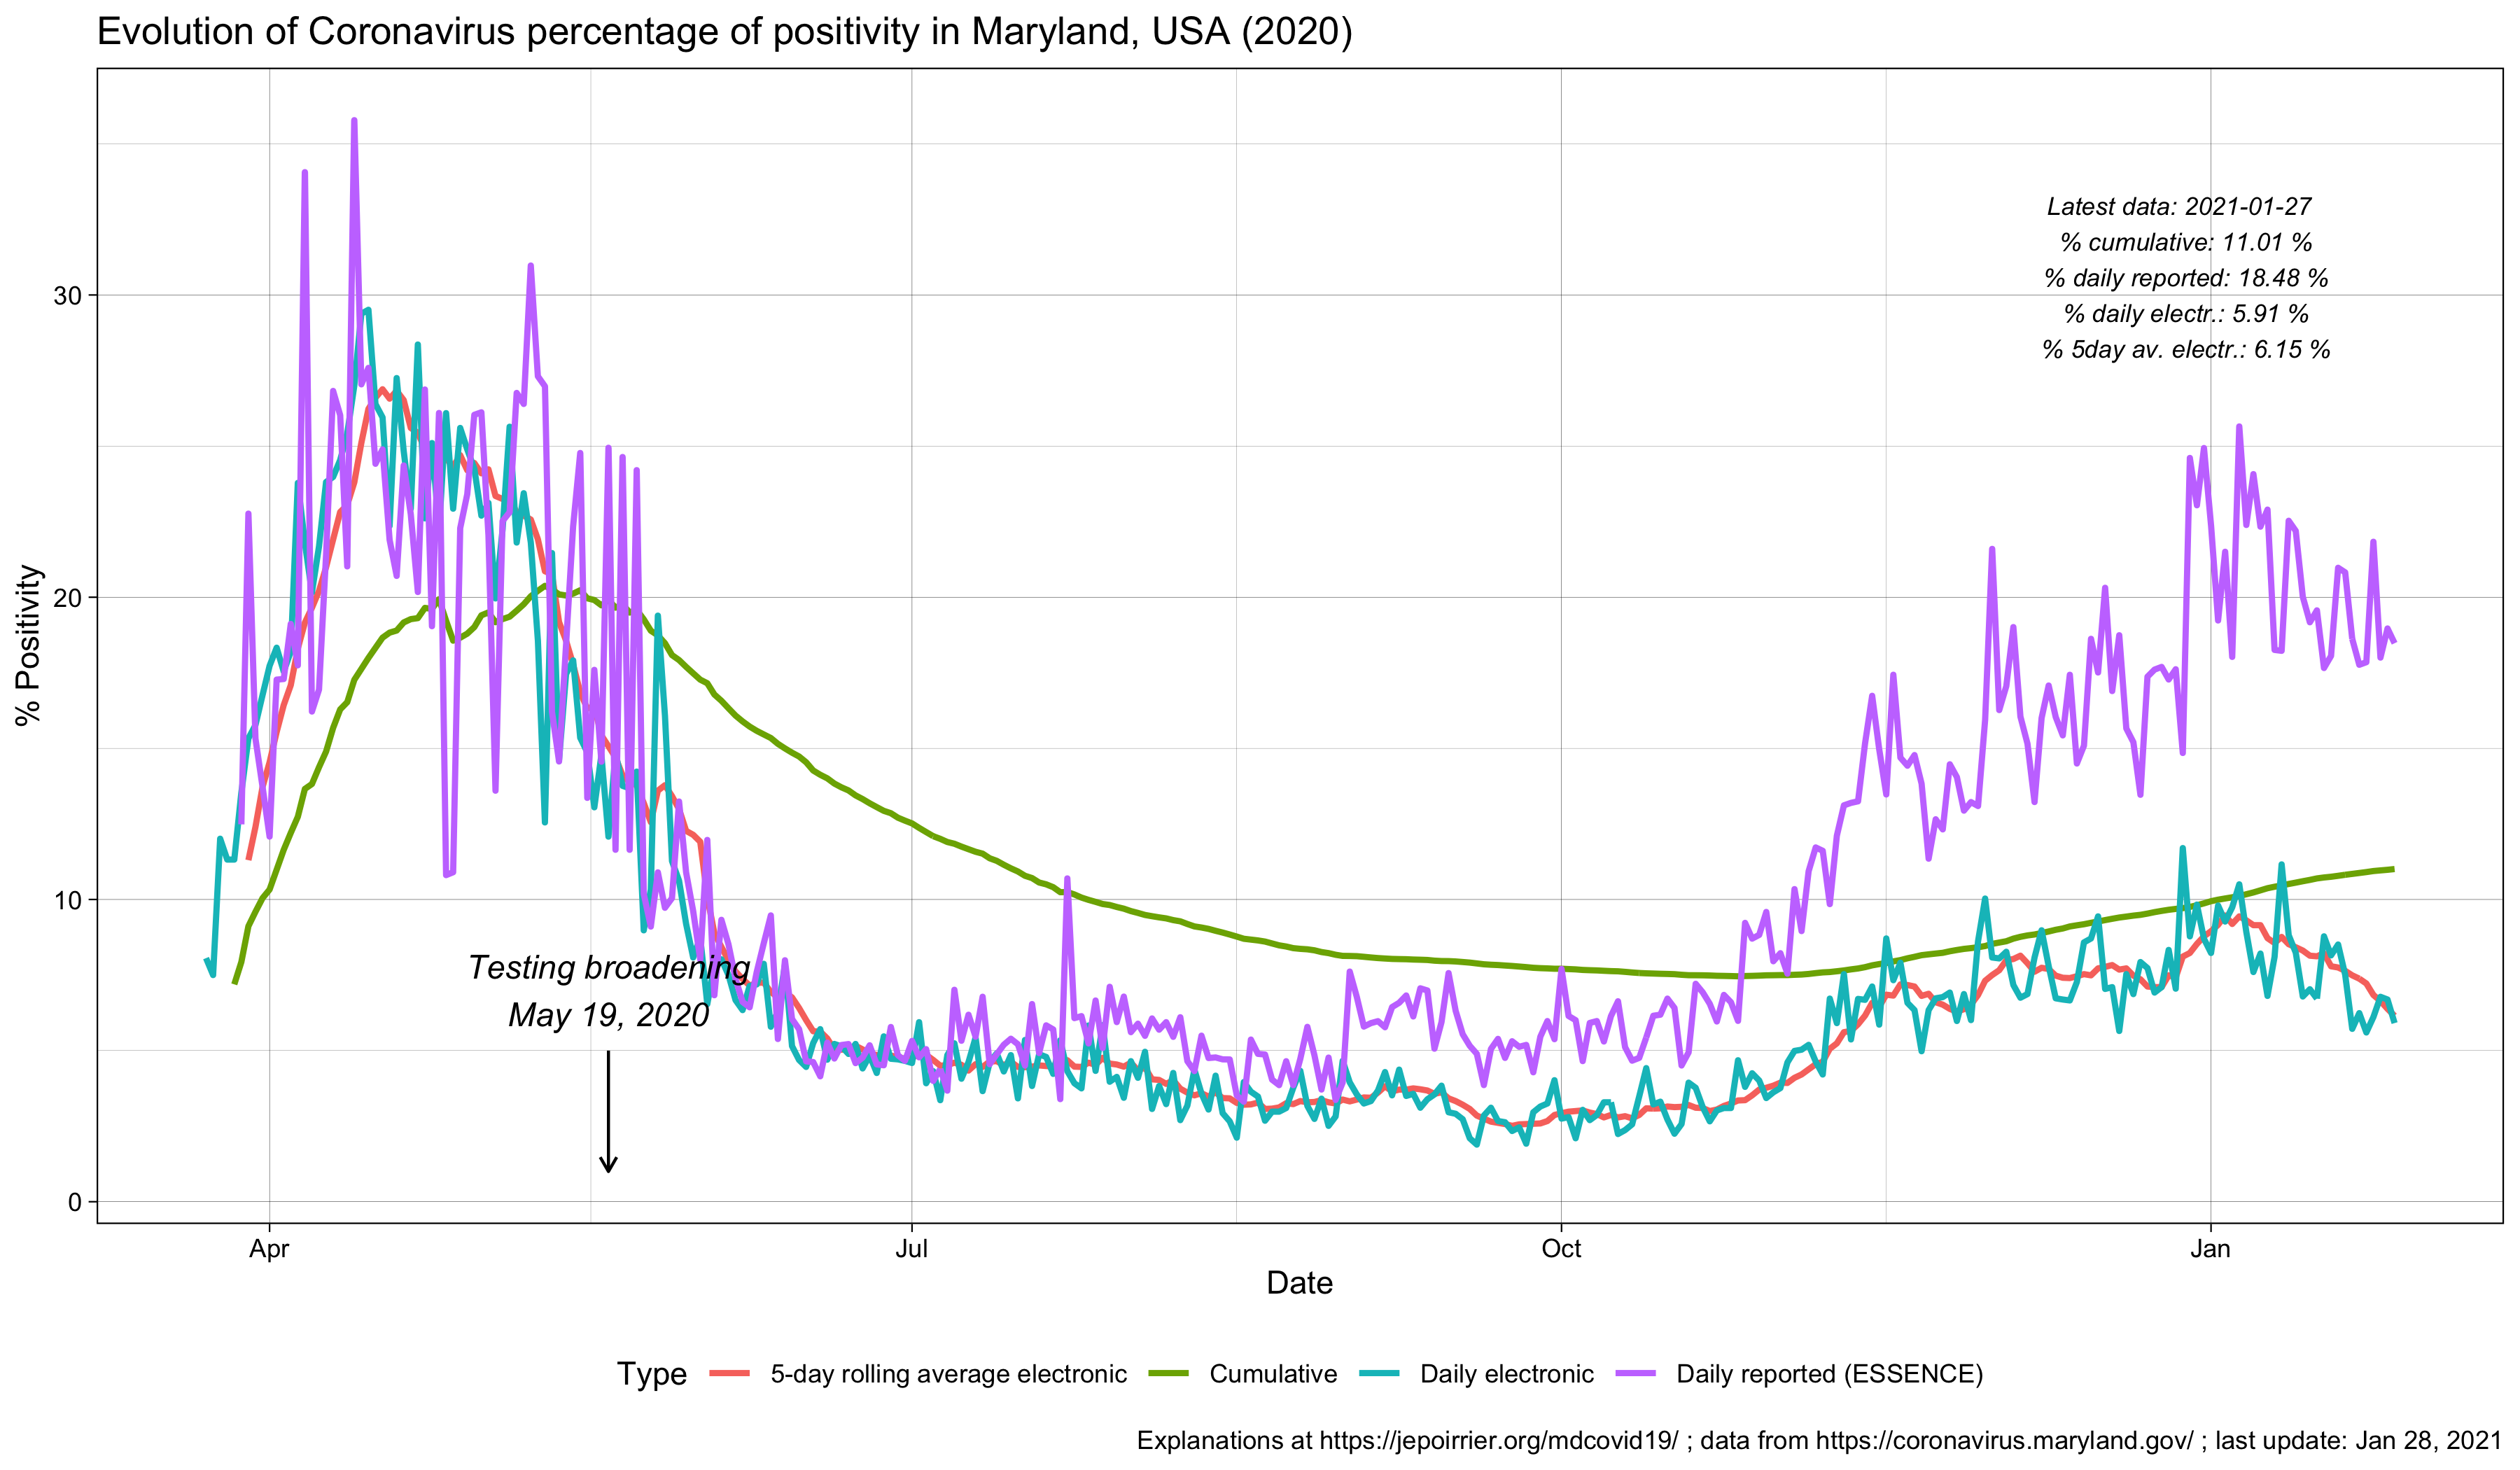
- July 26 - What is the COVID-19 positivity rate in Maryland?
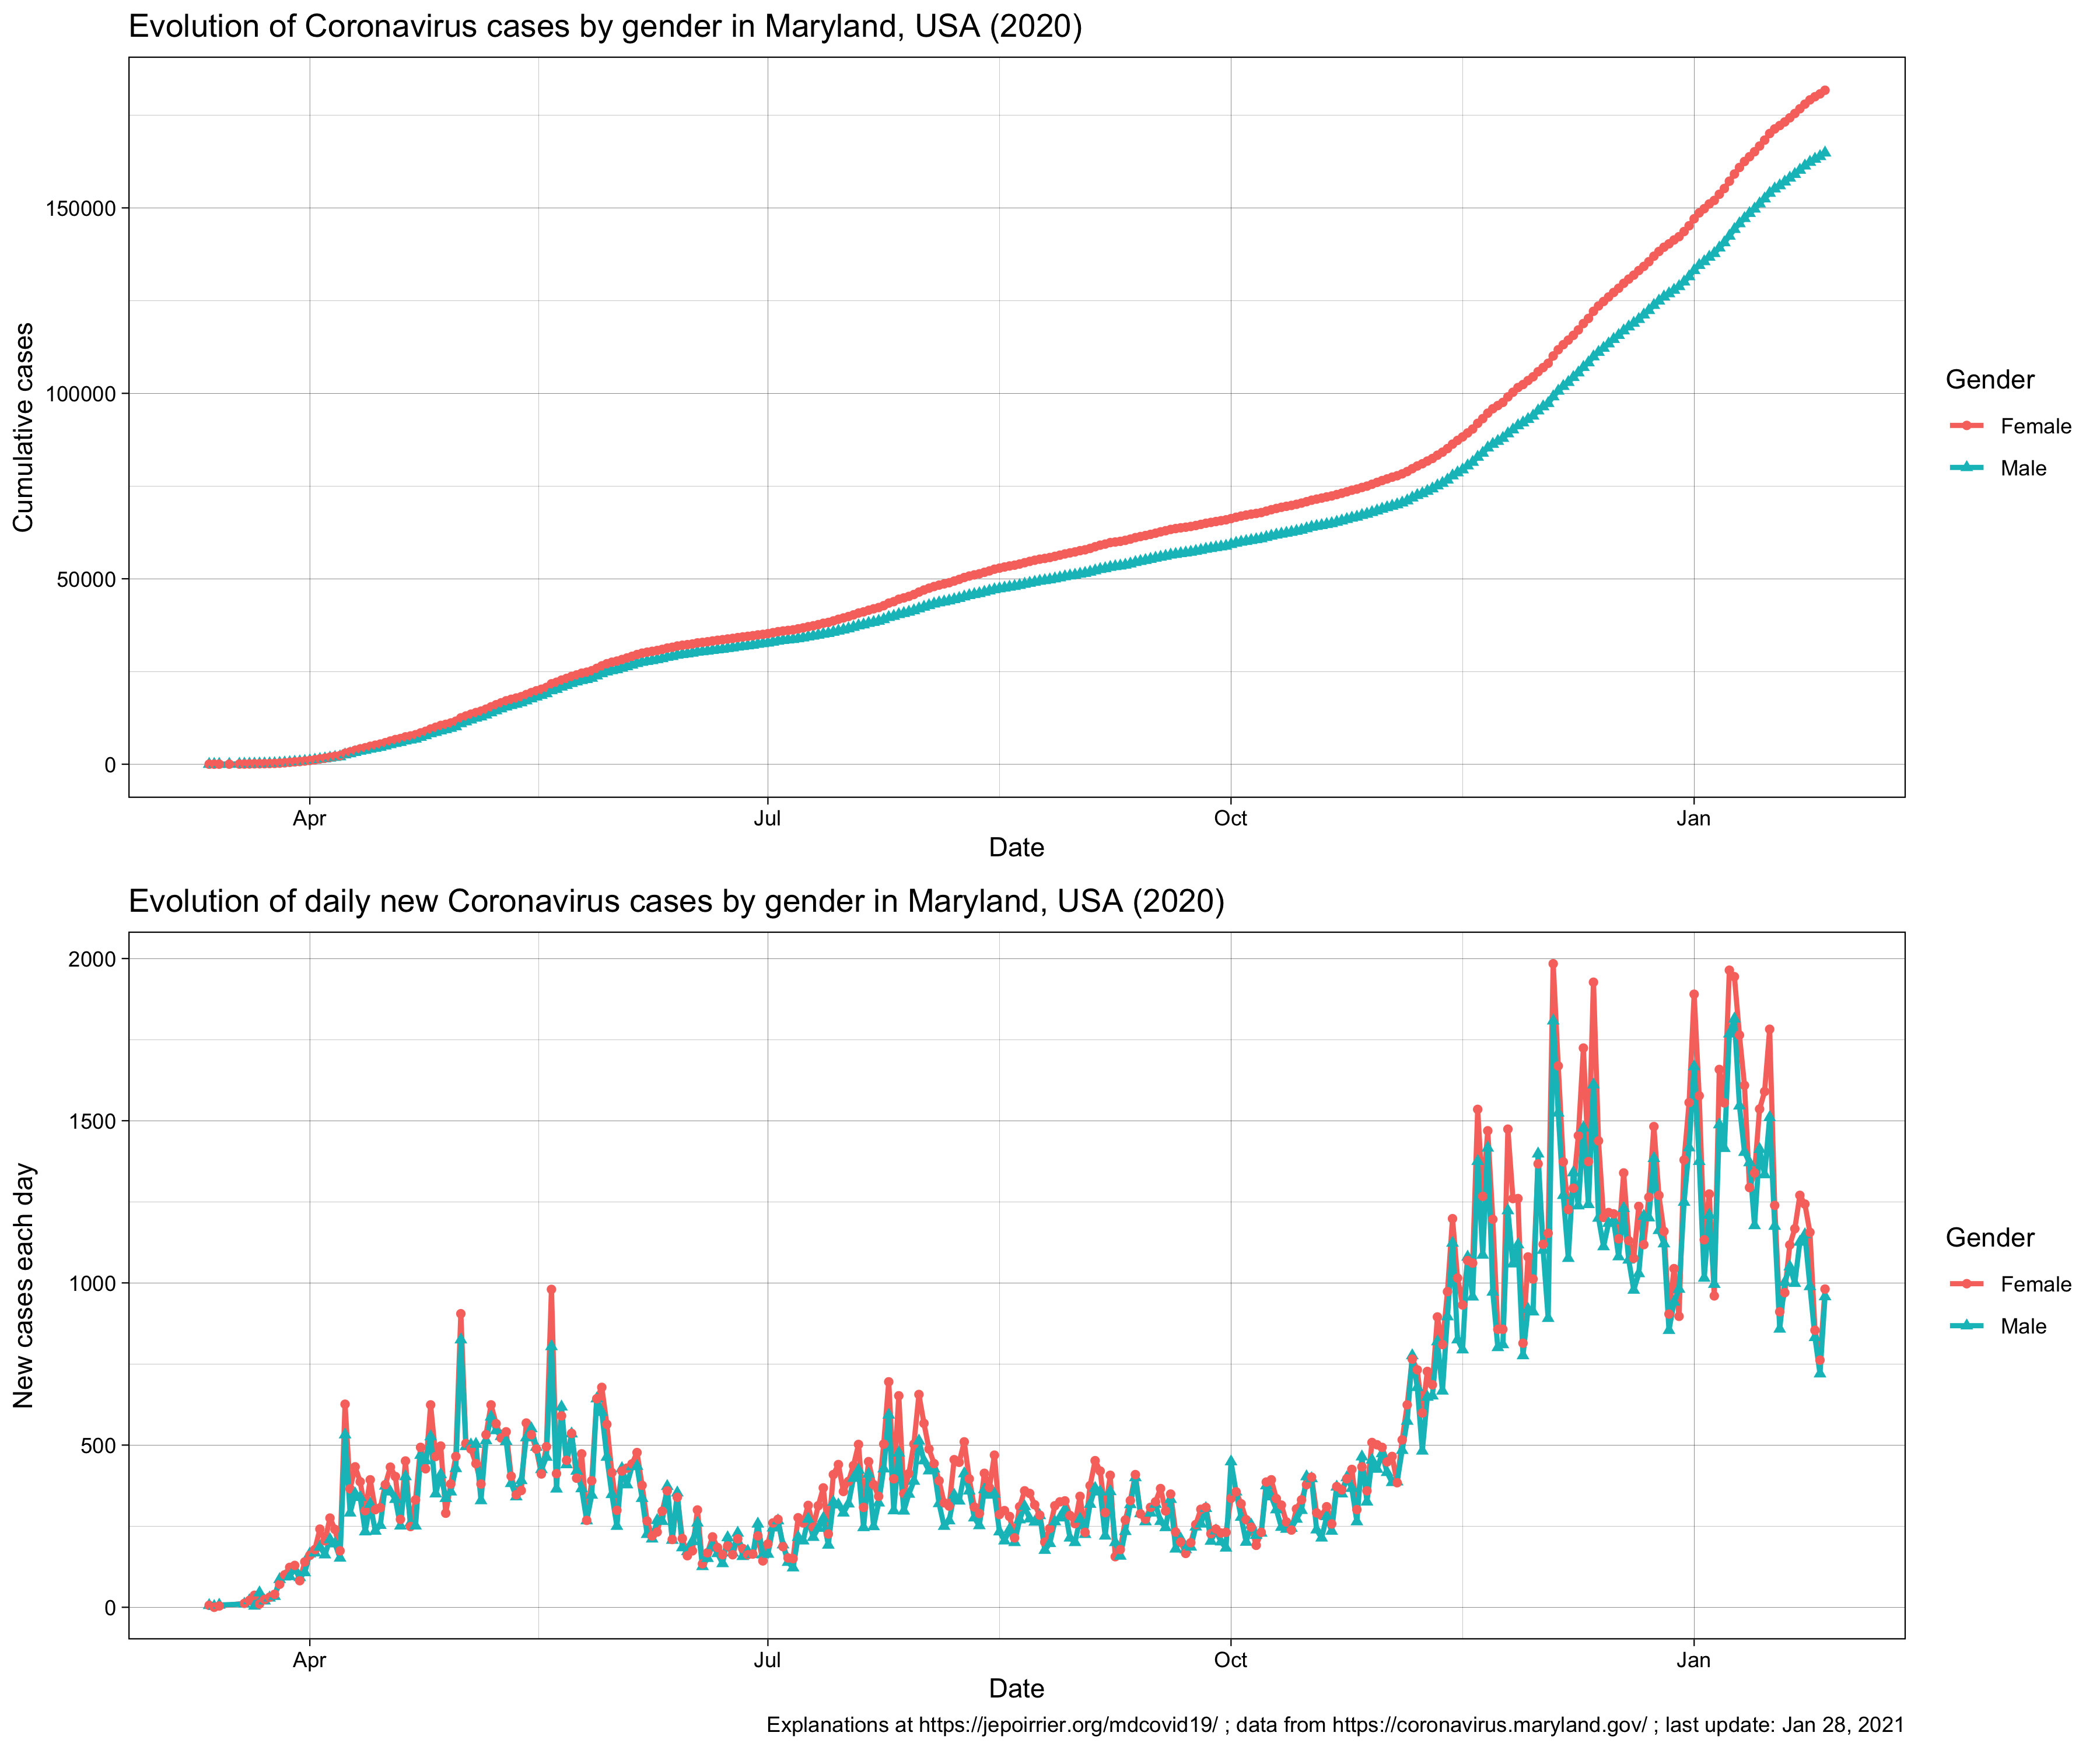
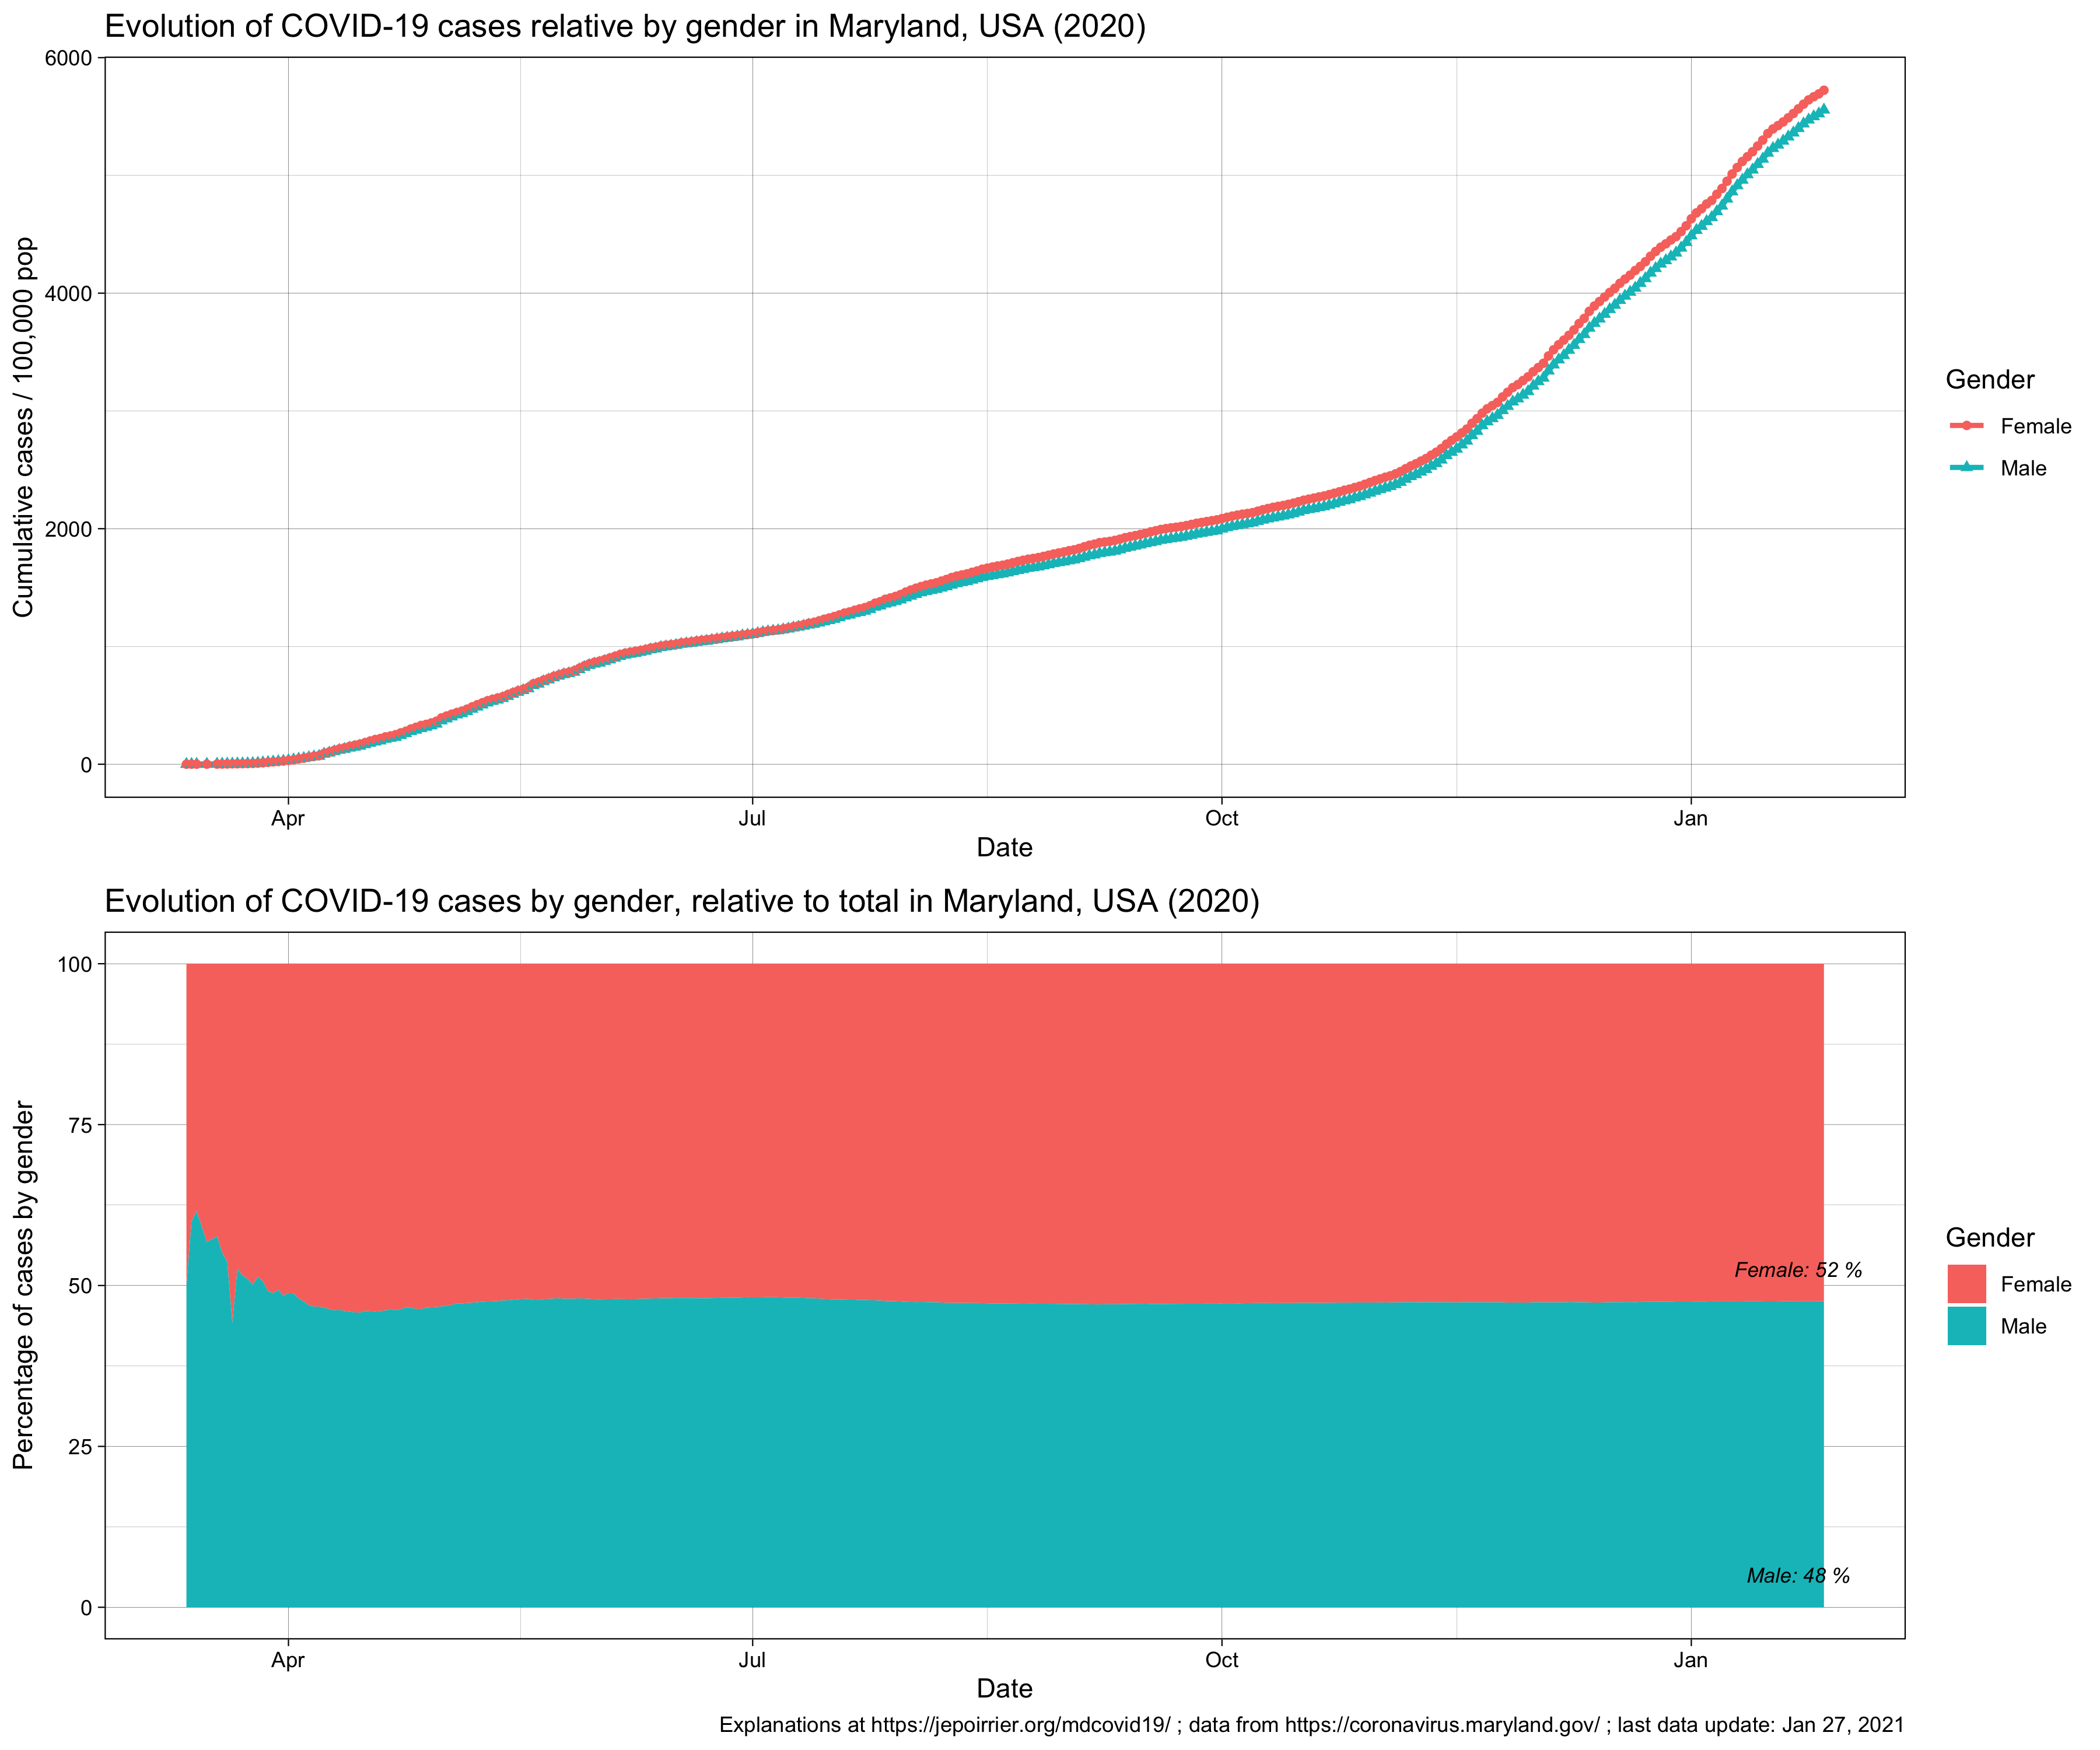
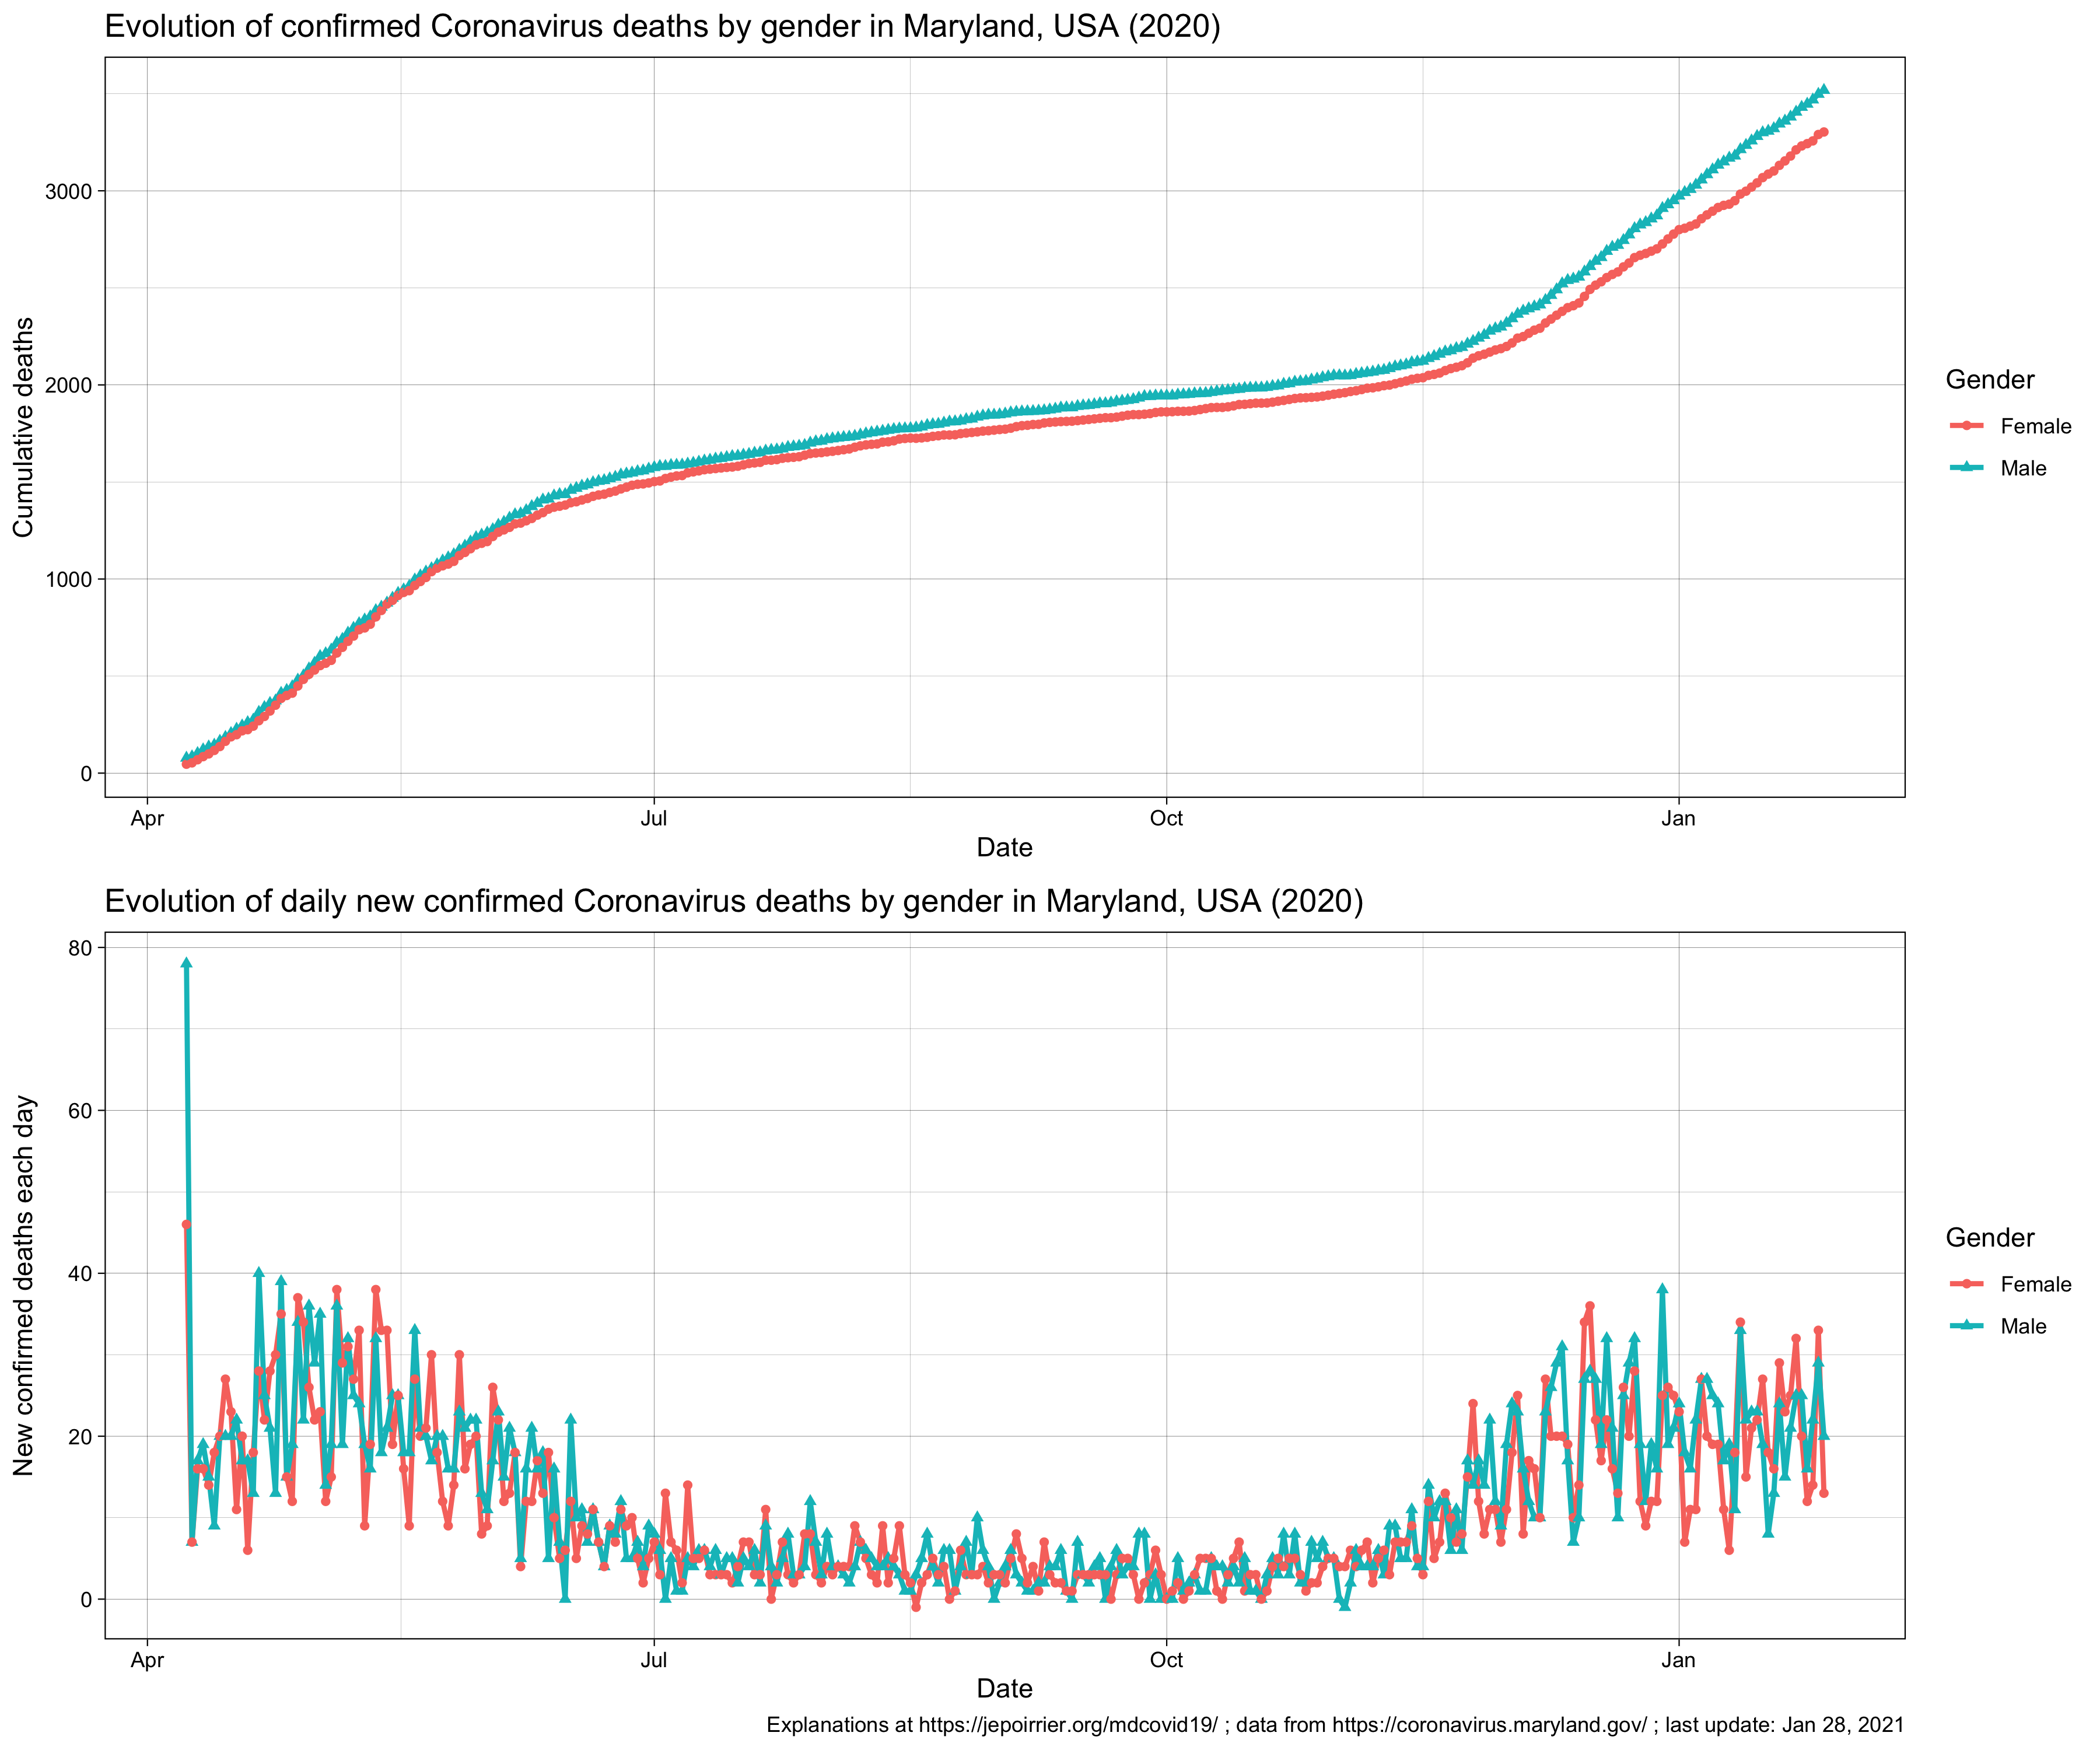
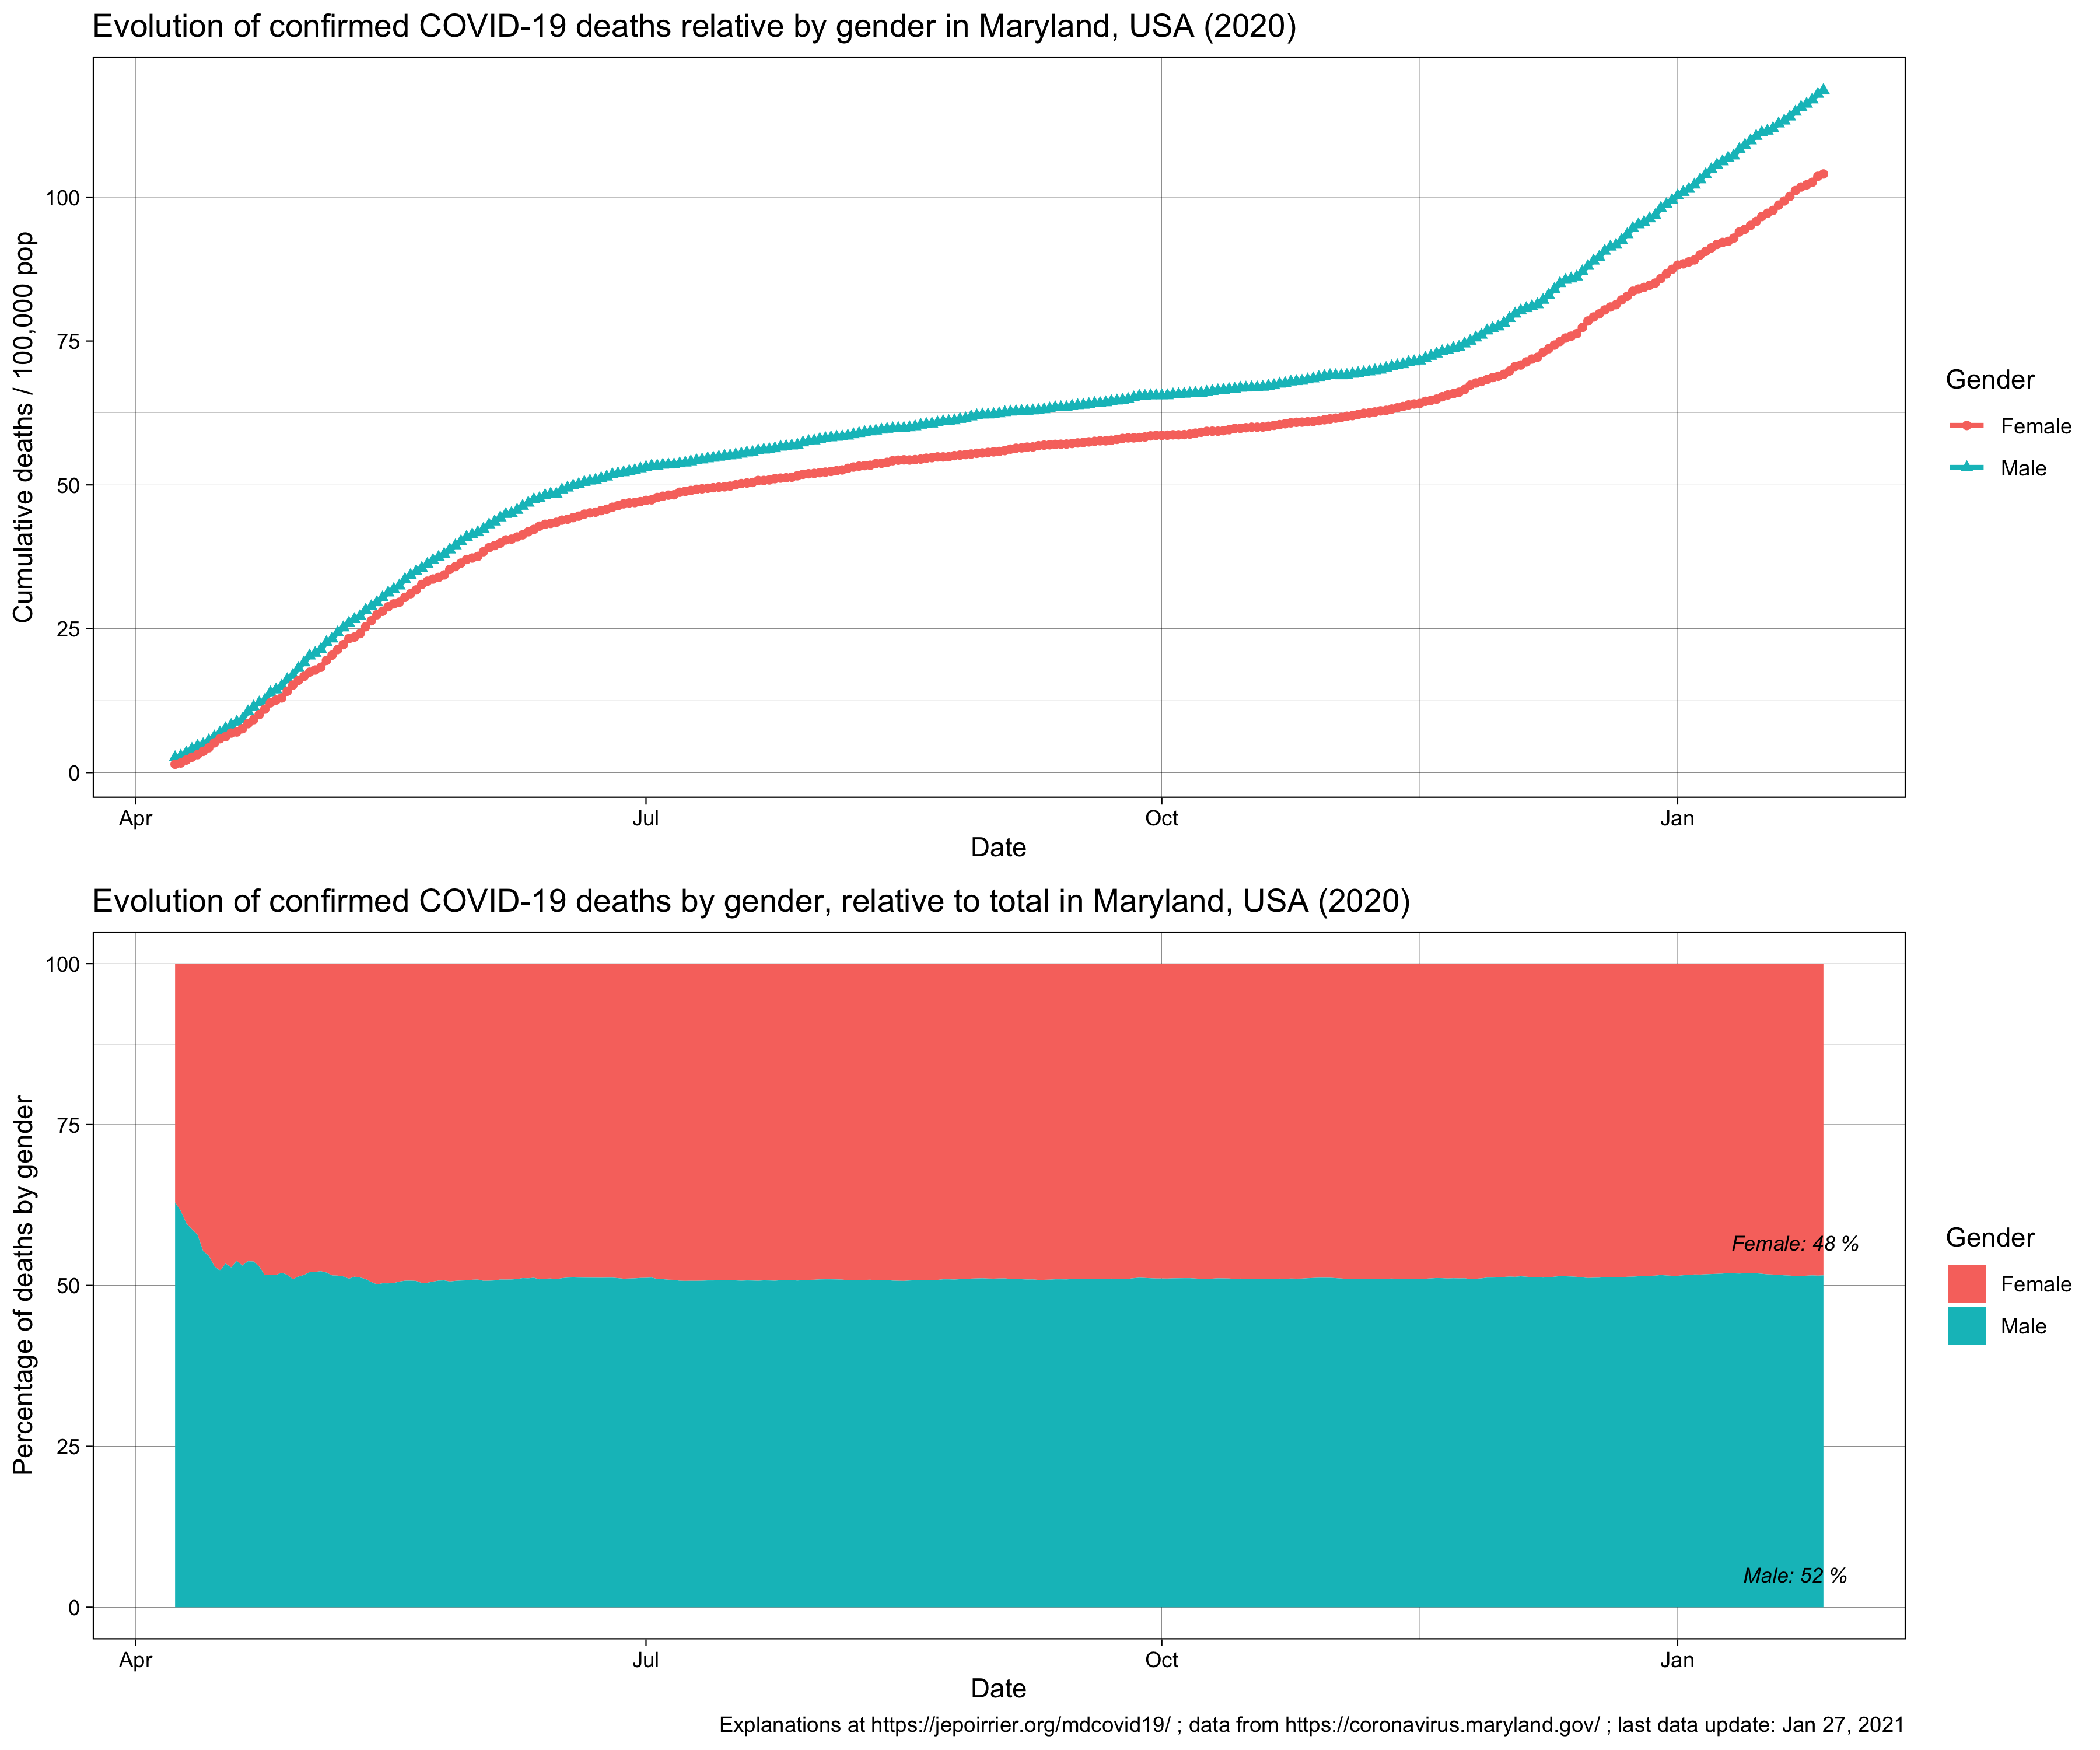
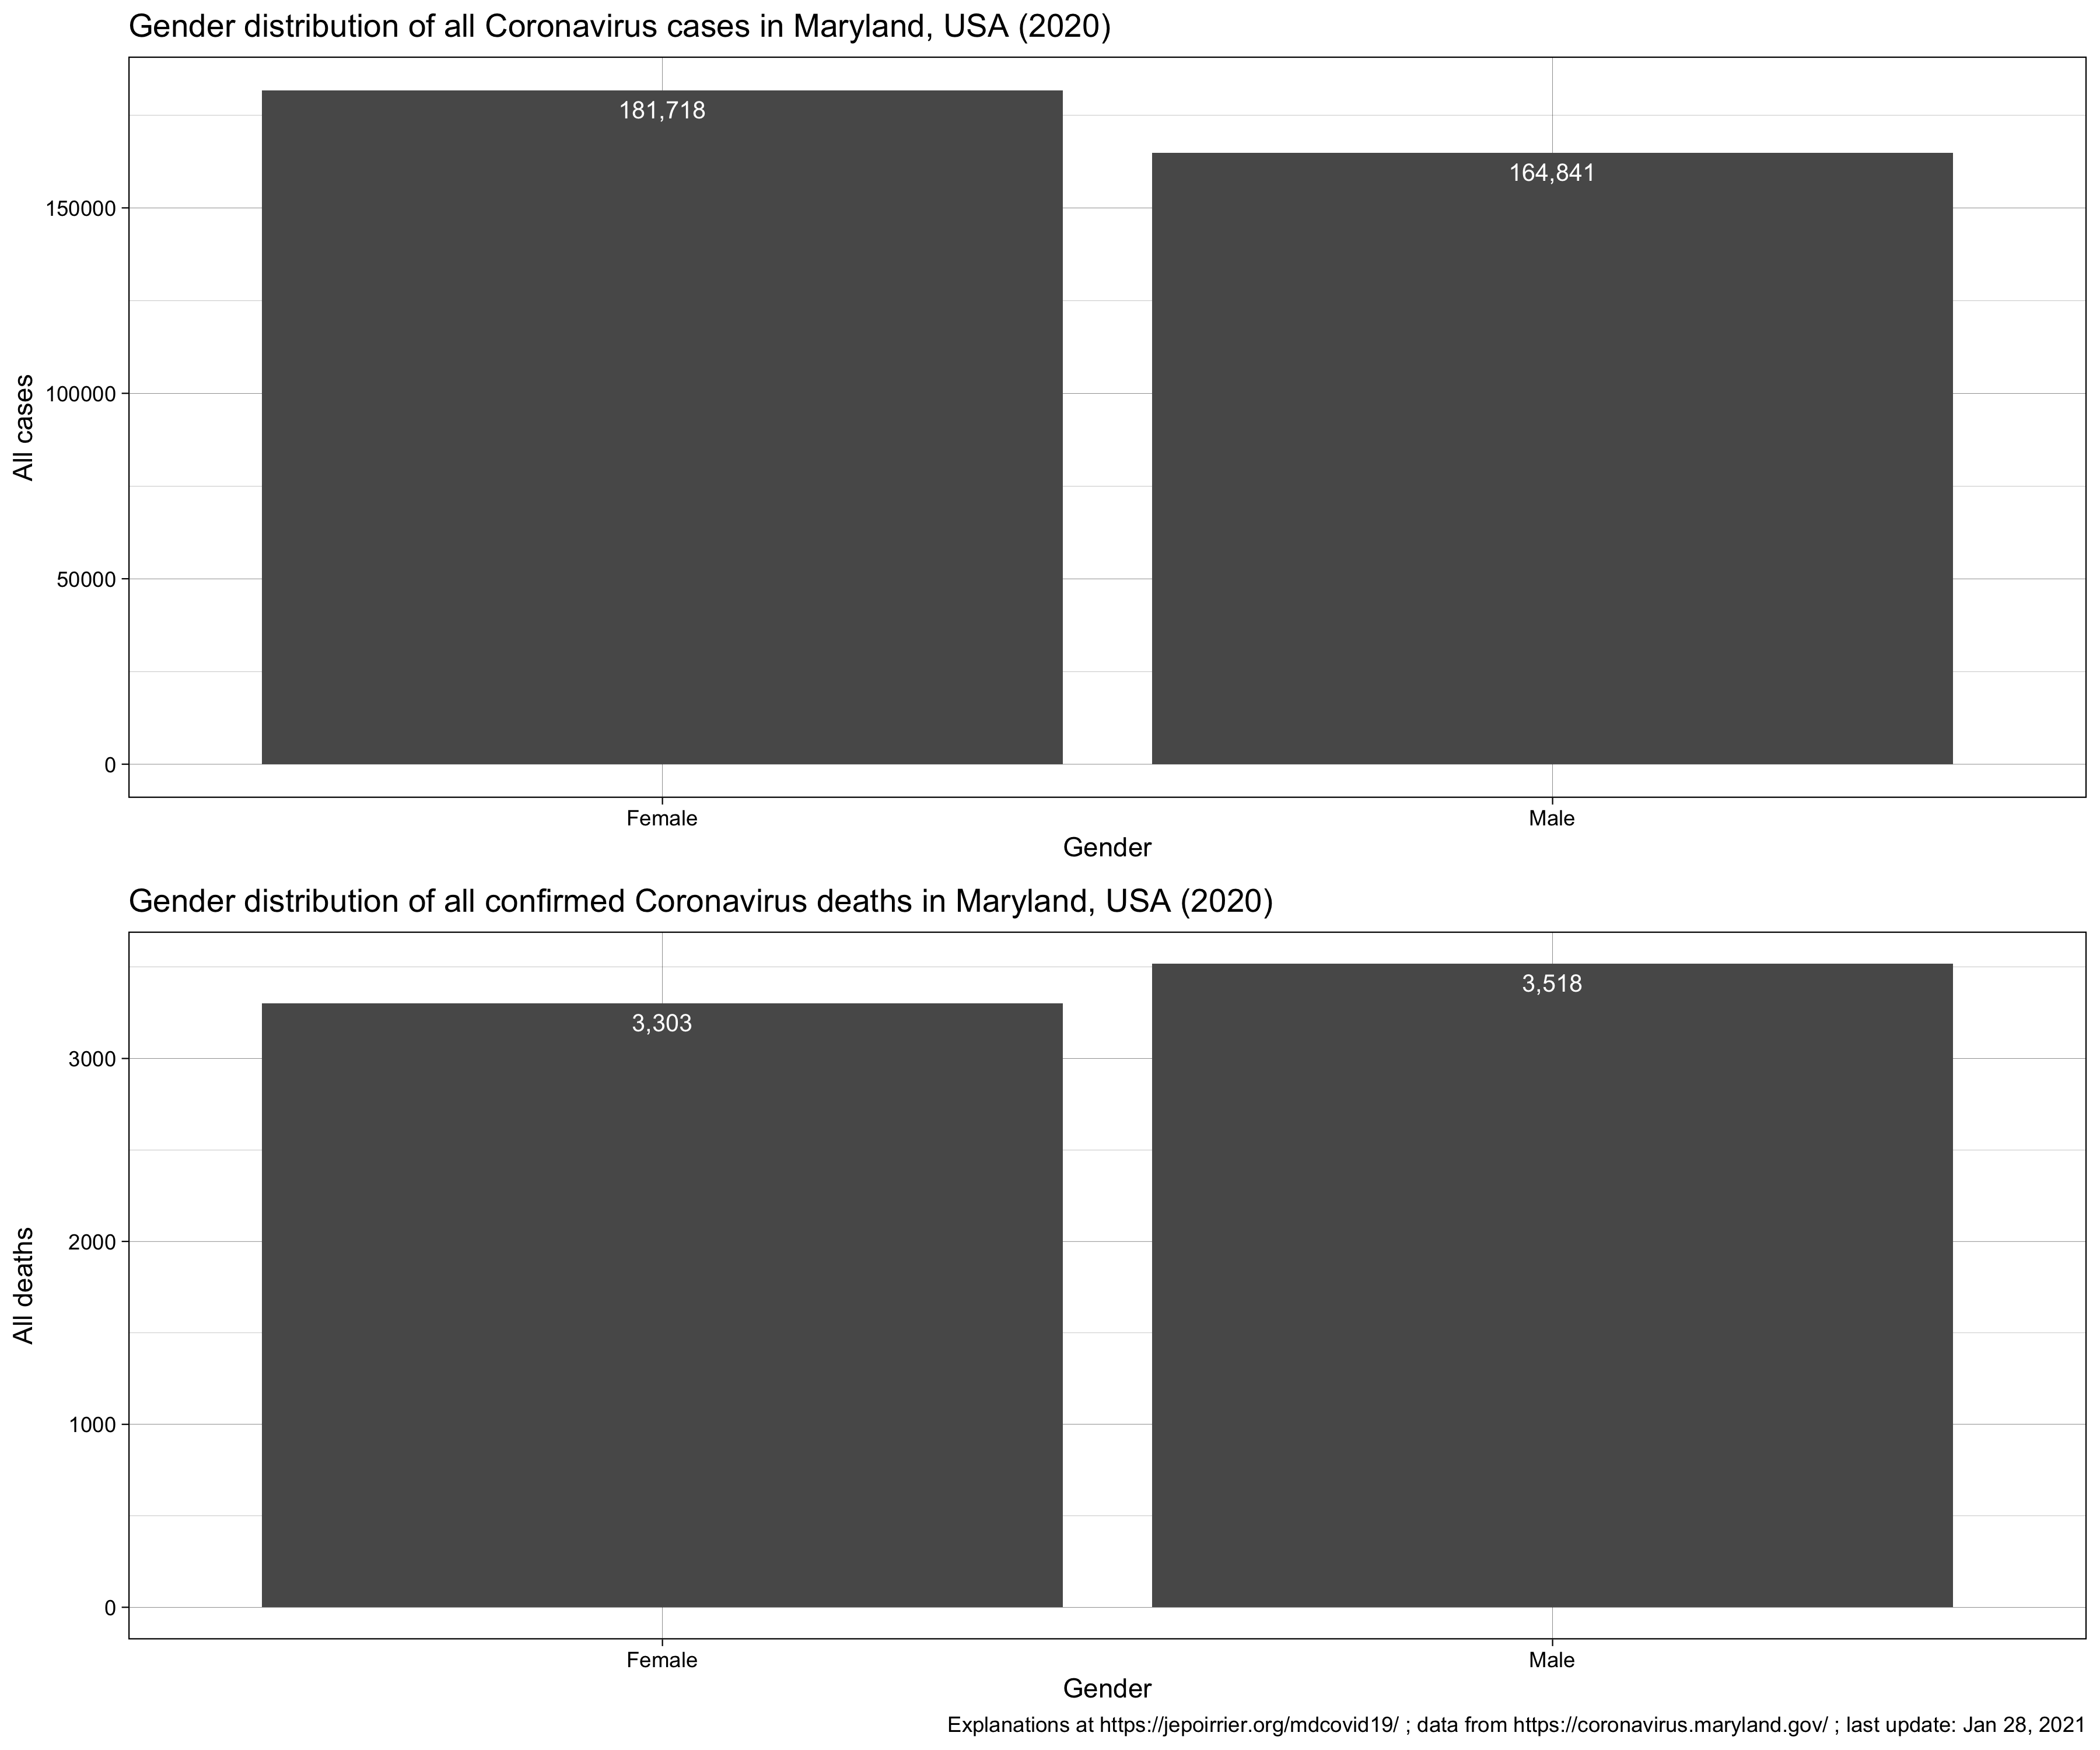
- July 14 - Gender of COVID-19 cases & deaths in Maryland
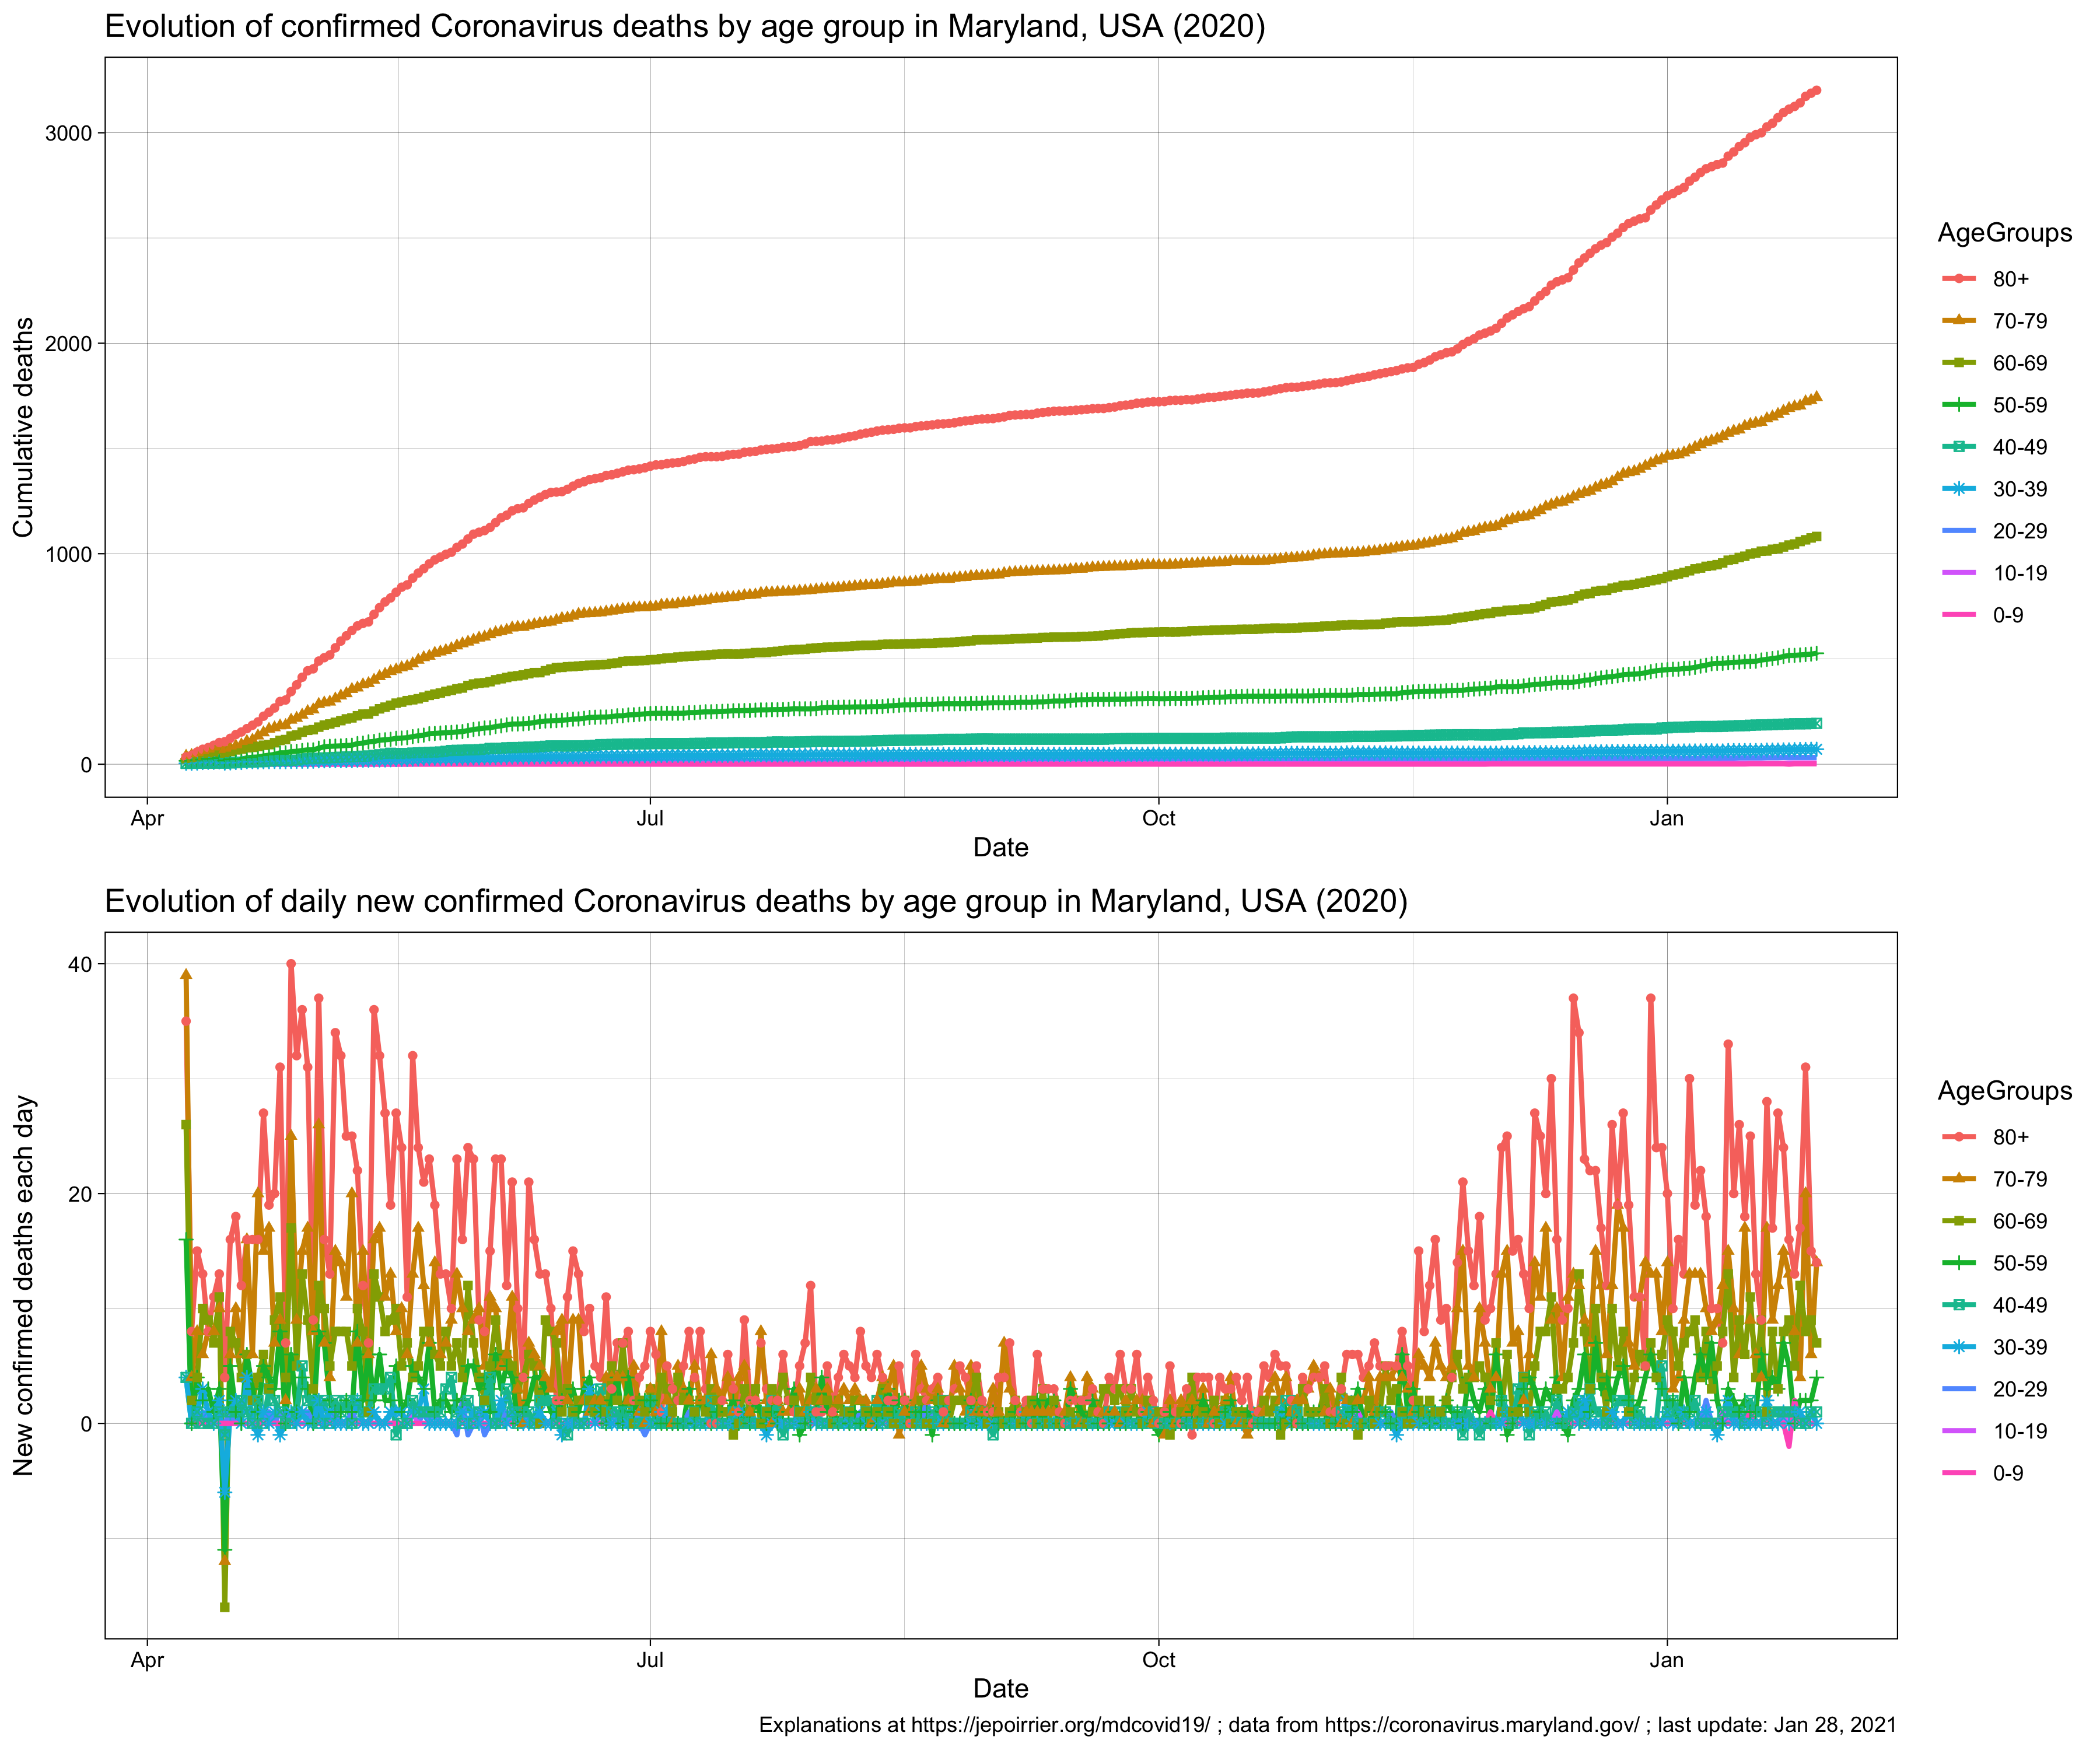
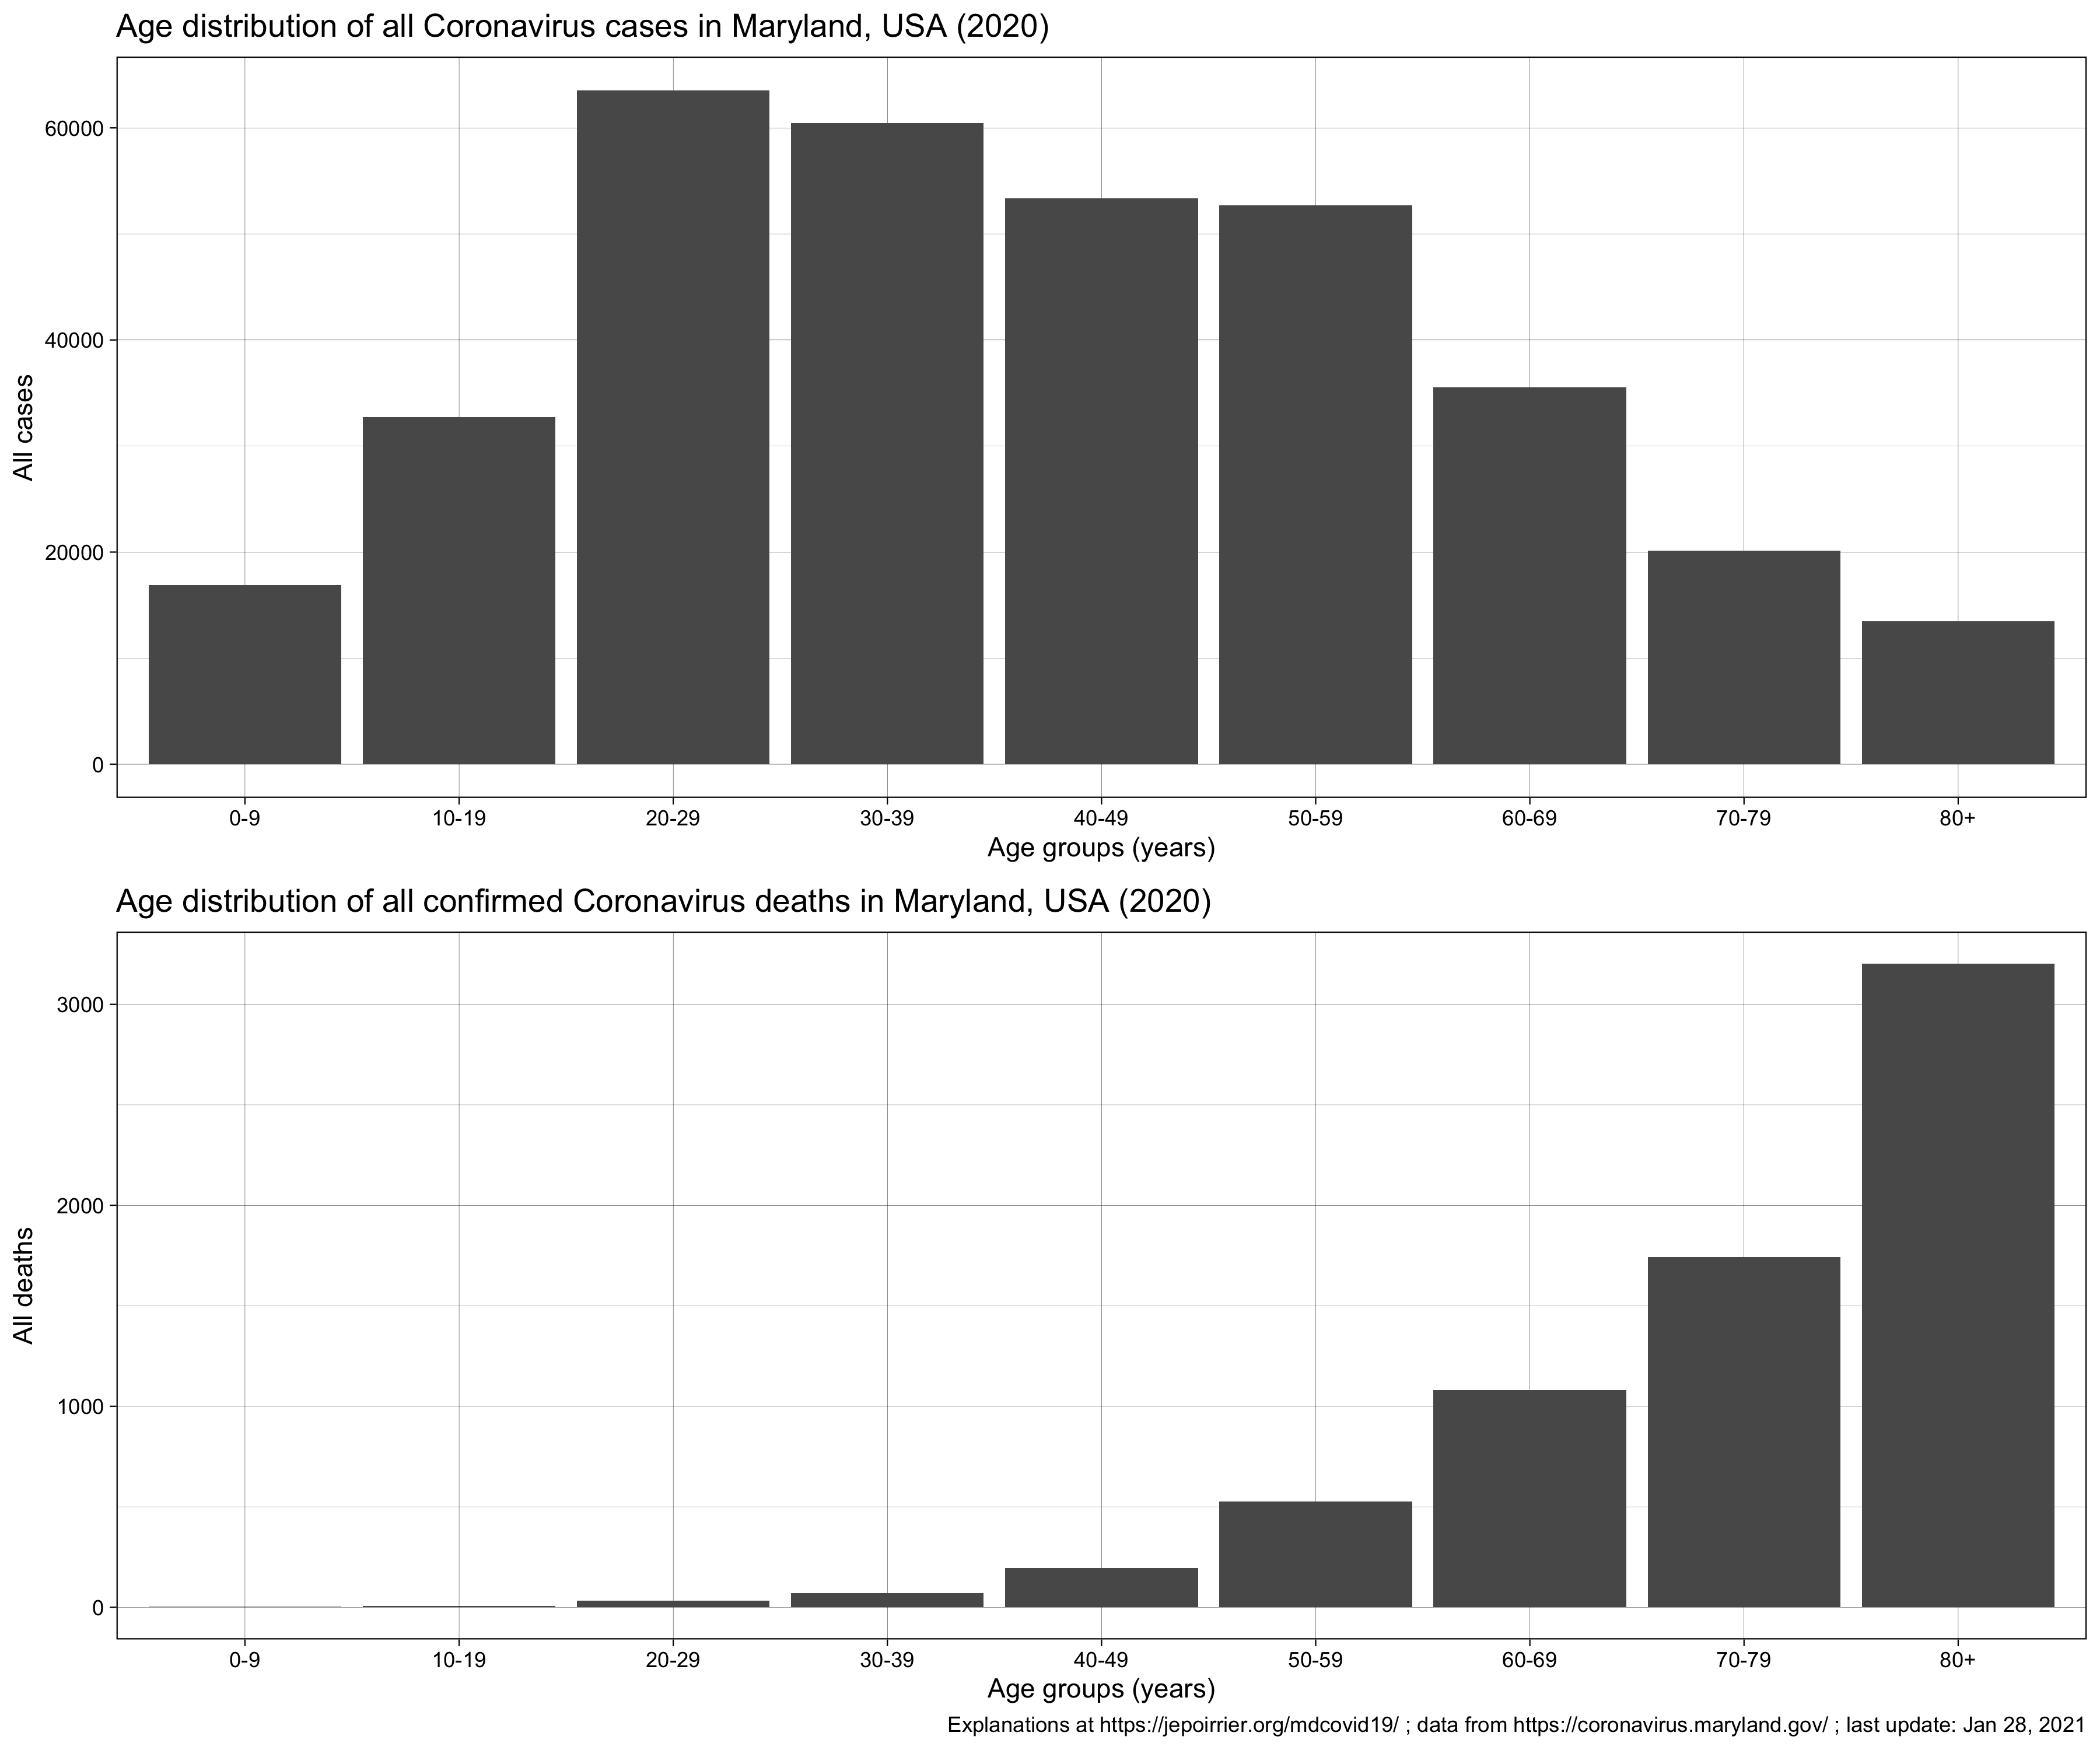
- July 9 - Age of COVID-19 deaths in Maryland
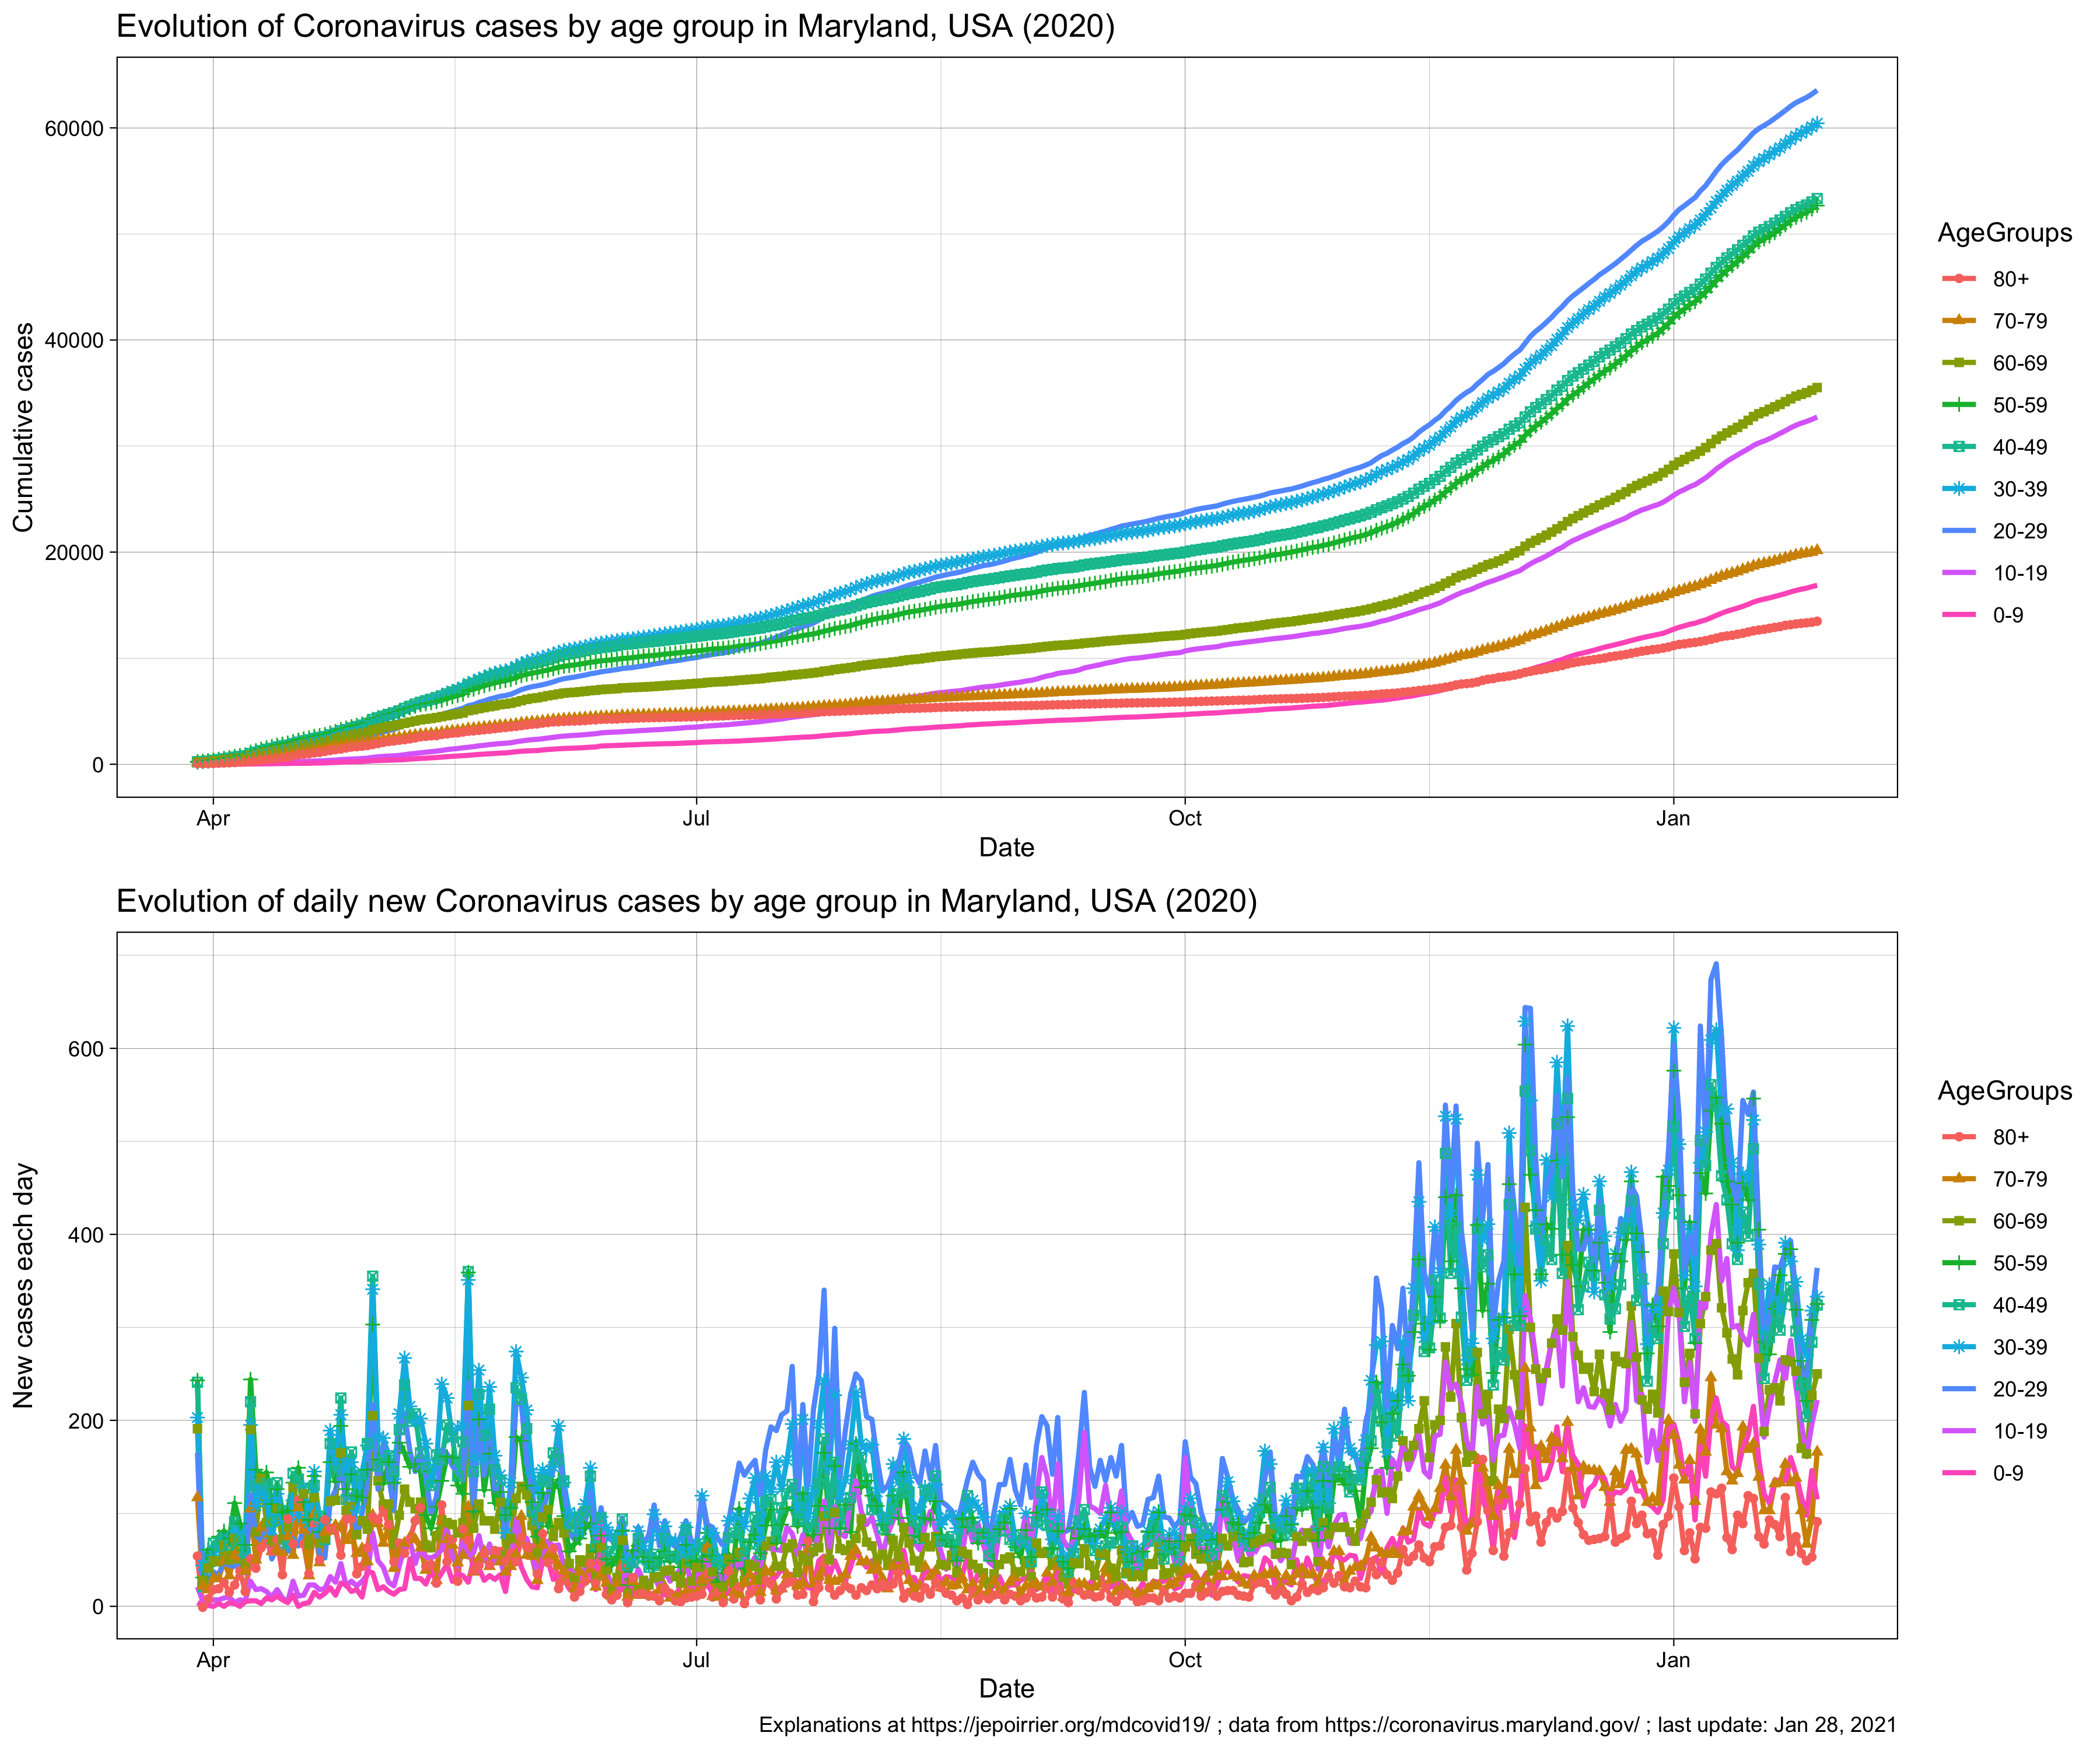
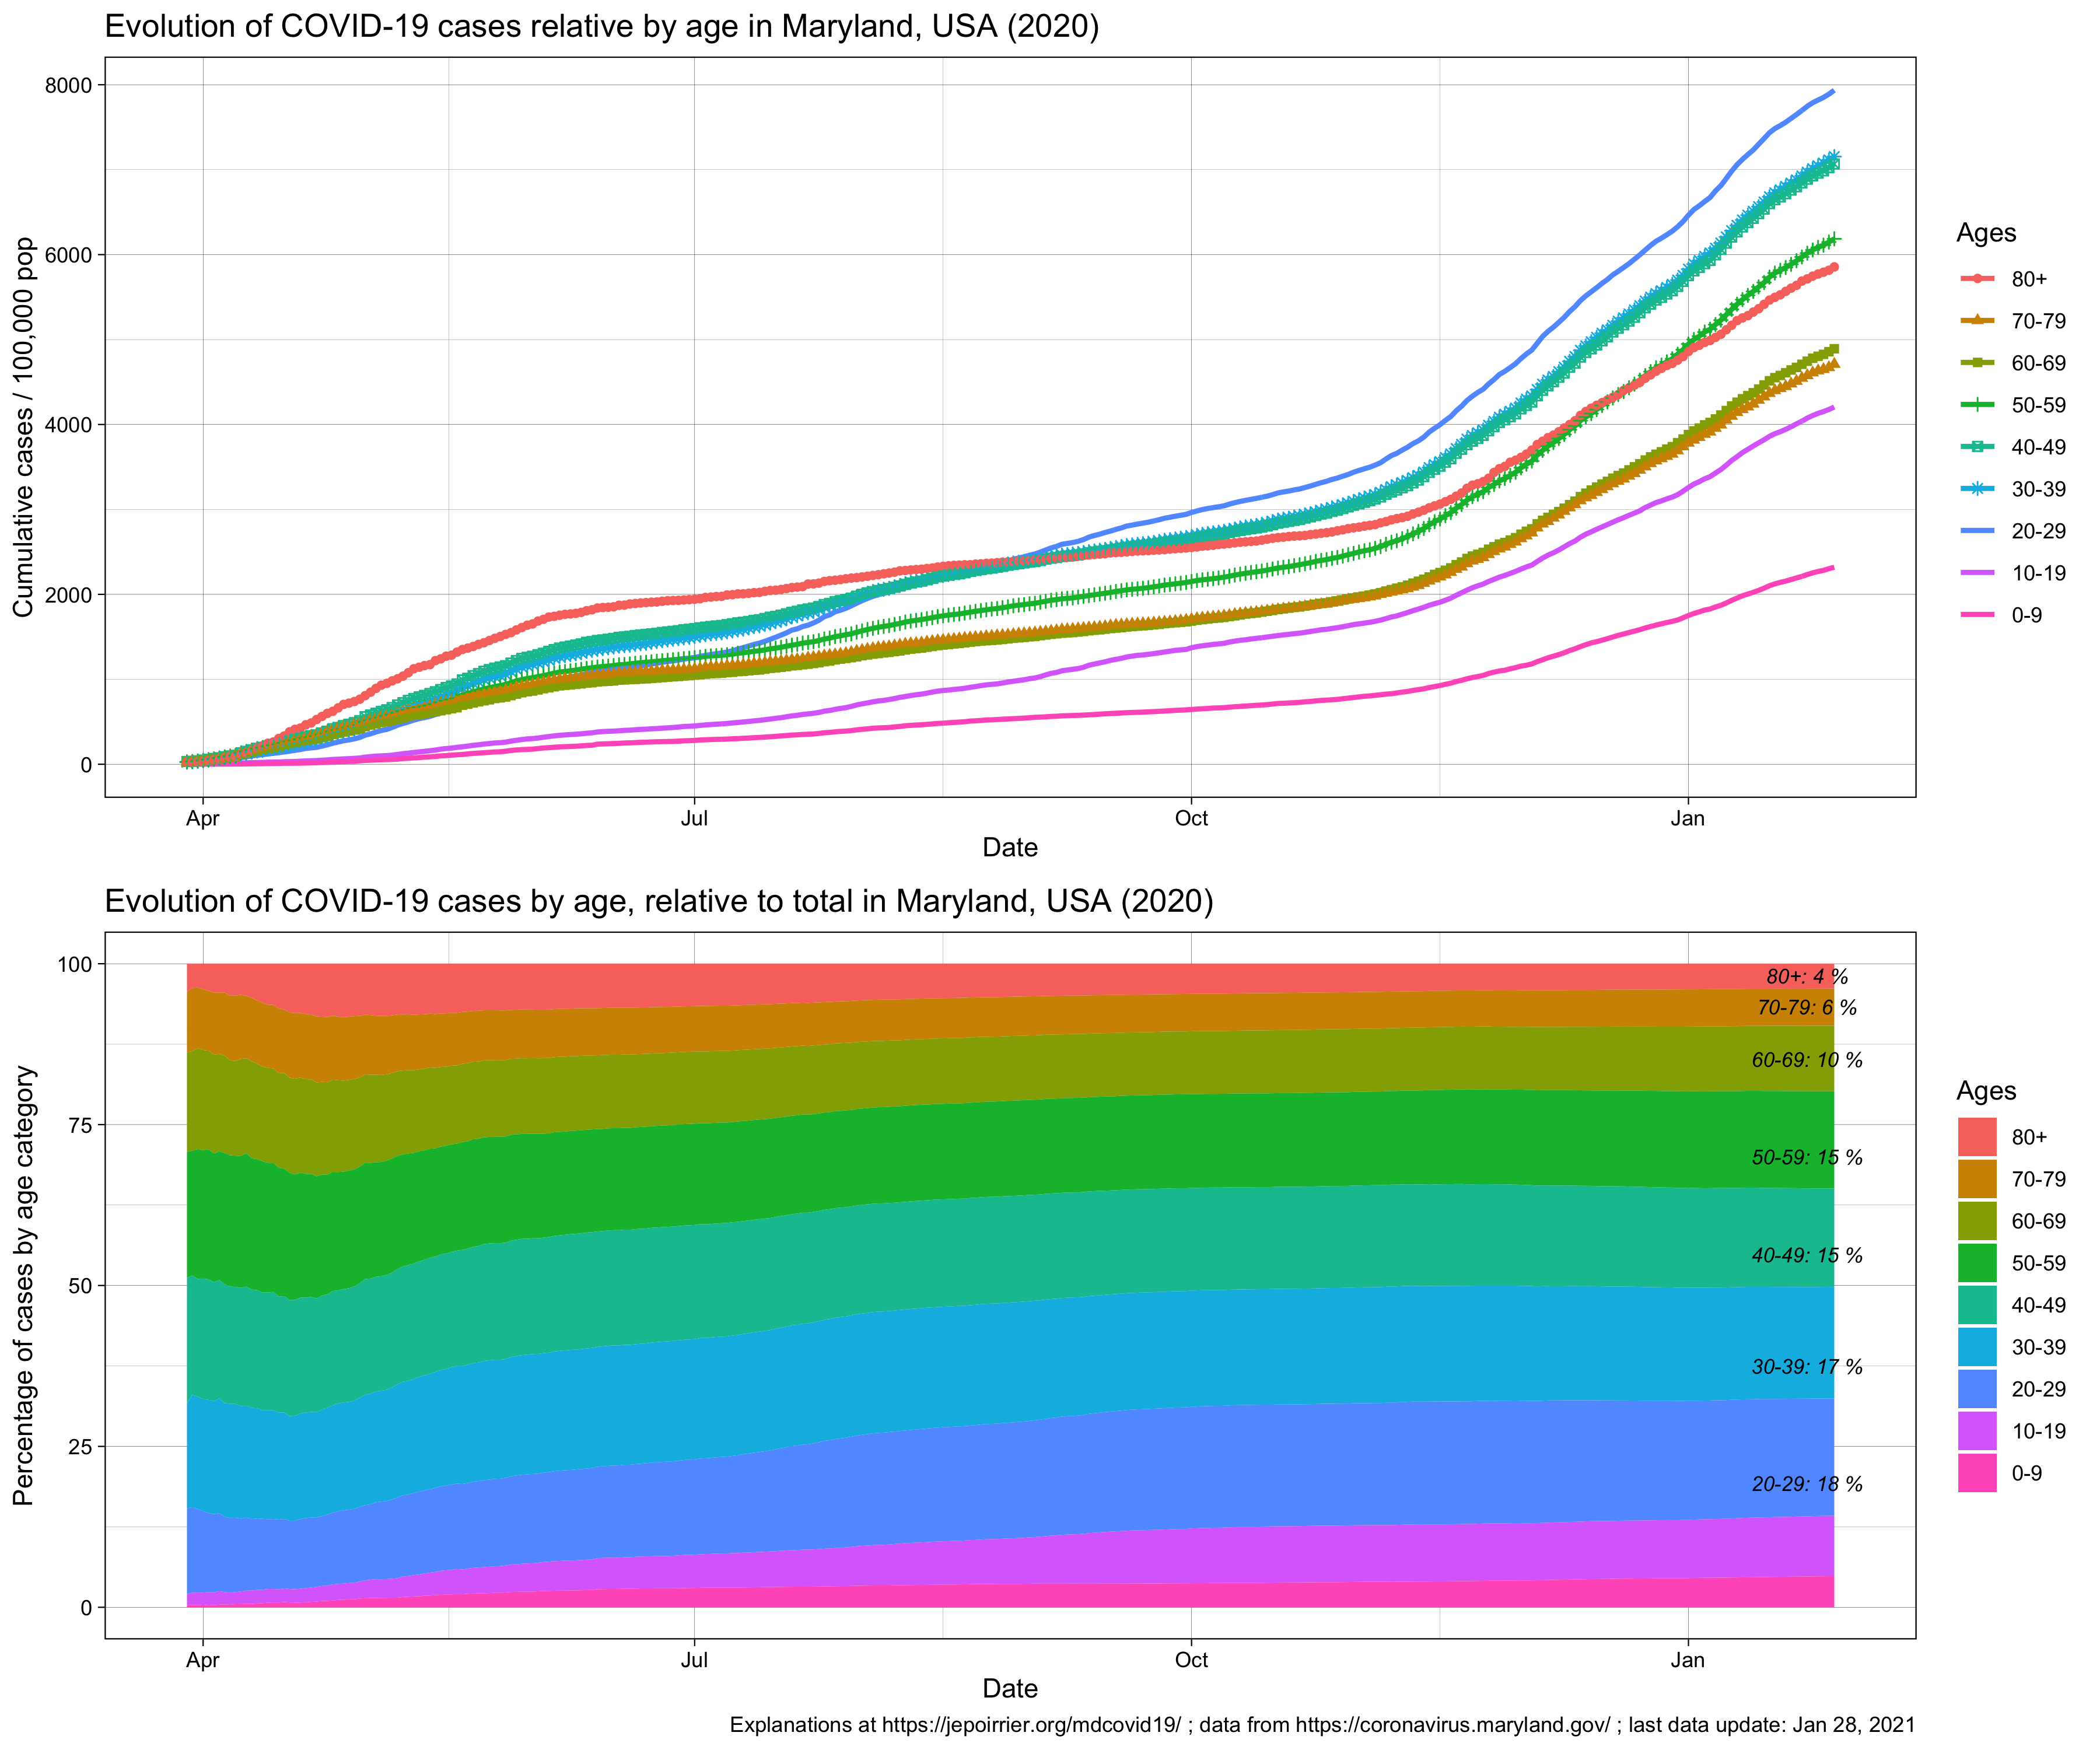
- July 9 - Age of COVID-19 cases in Maryland
- June 25 - Why would Maryland remove COVID-19 cases from nursing homes?
- June 12 - COVID-19 inequalities in Maryland
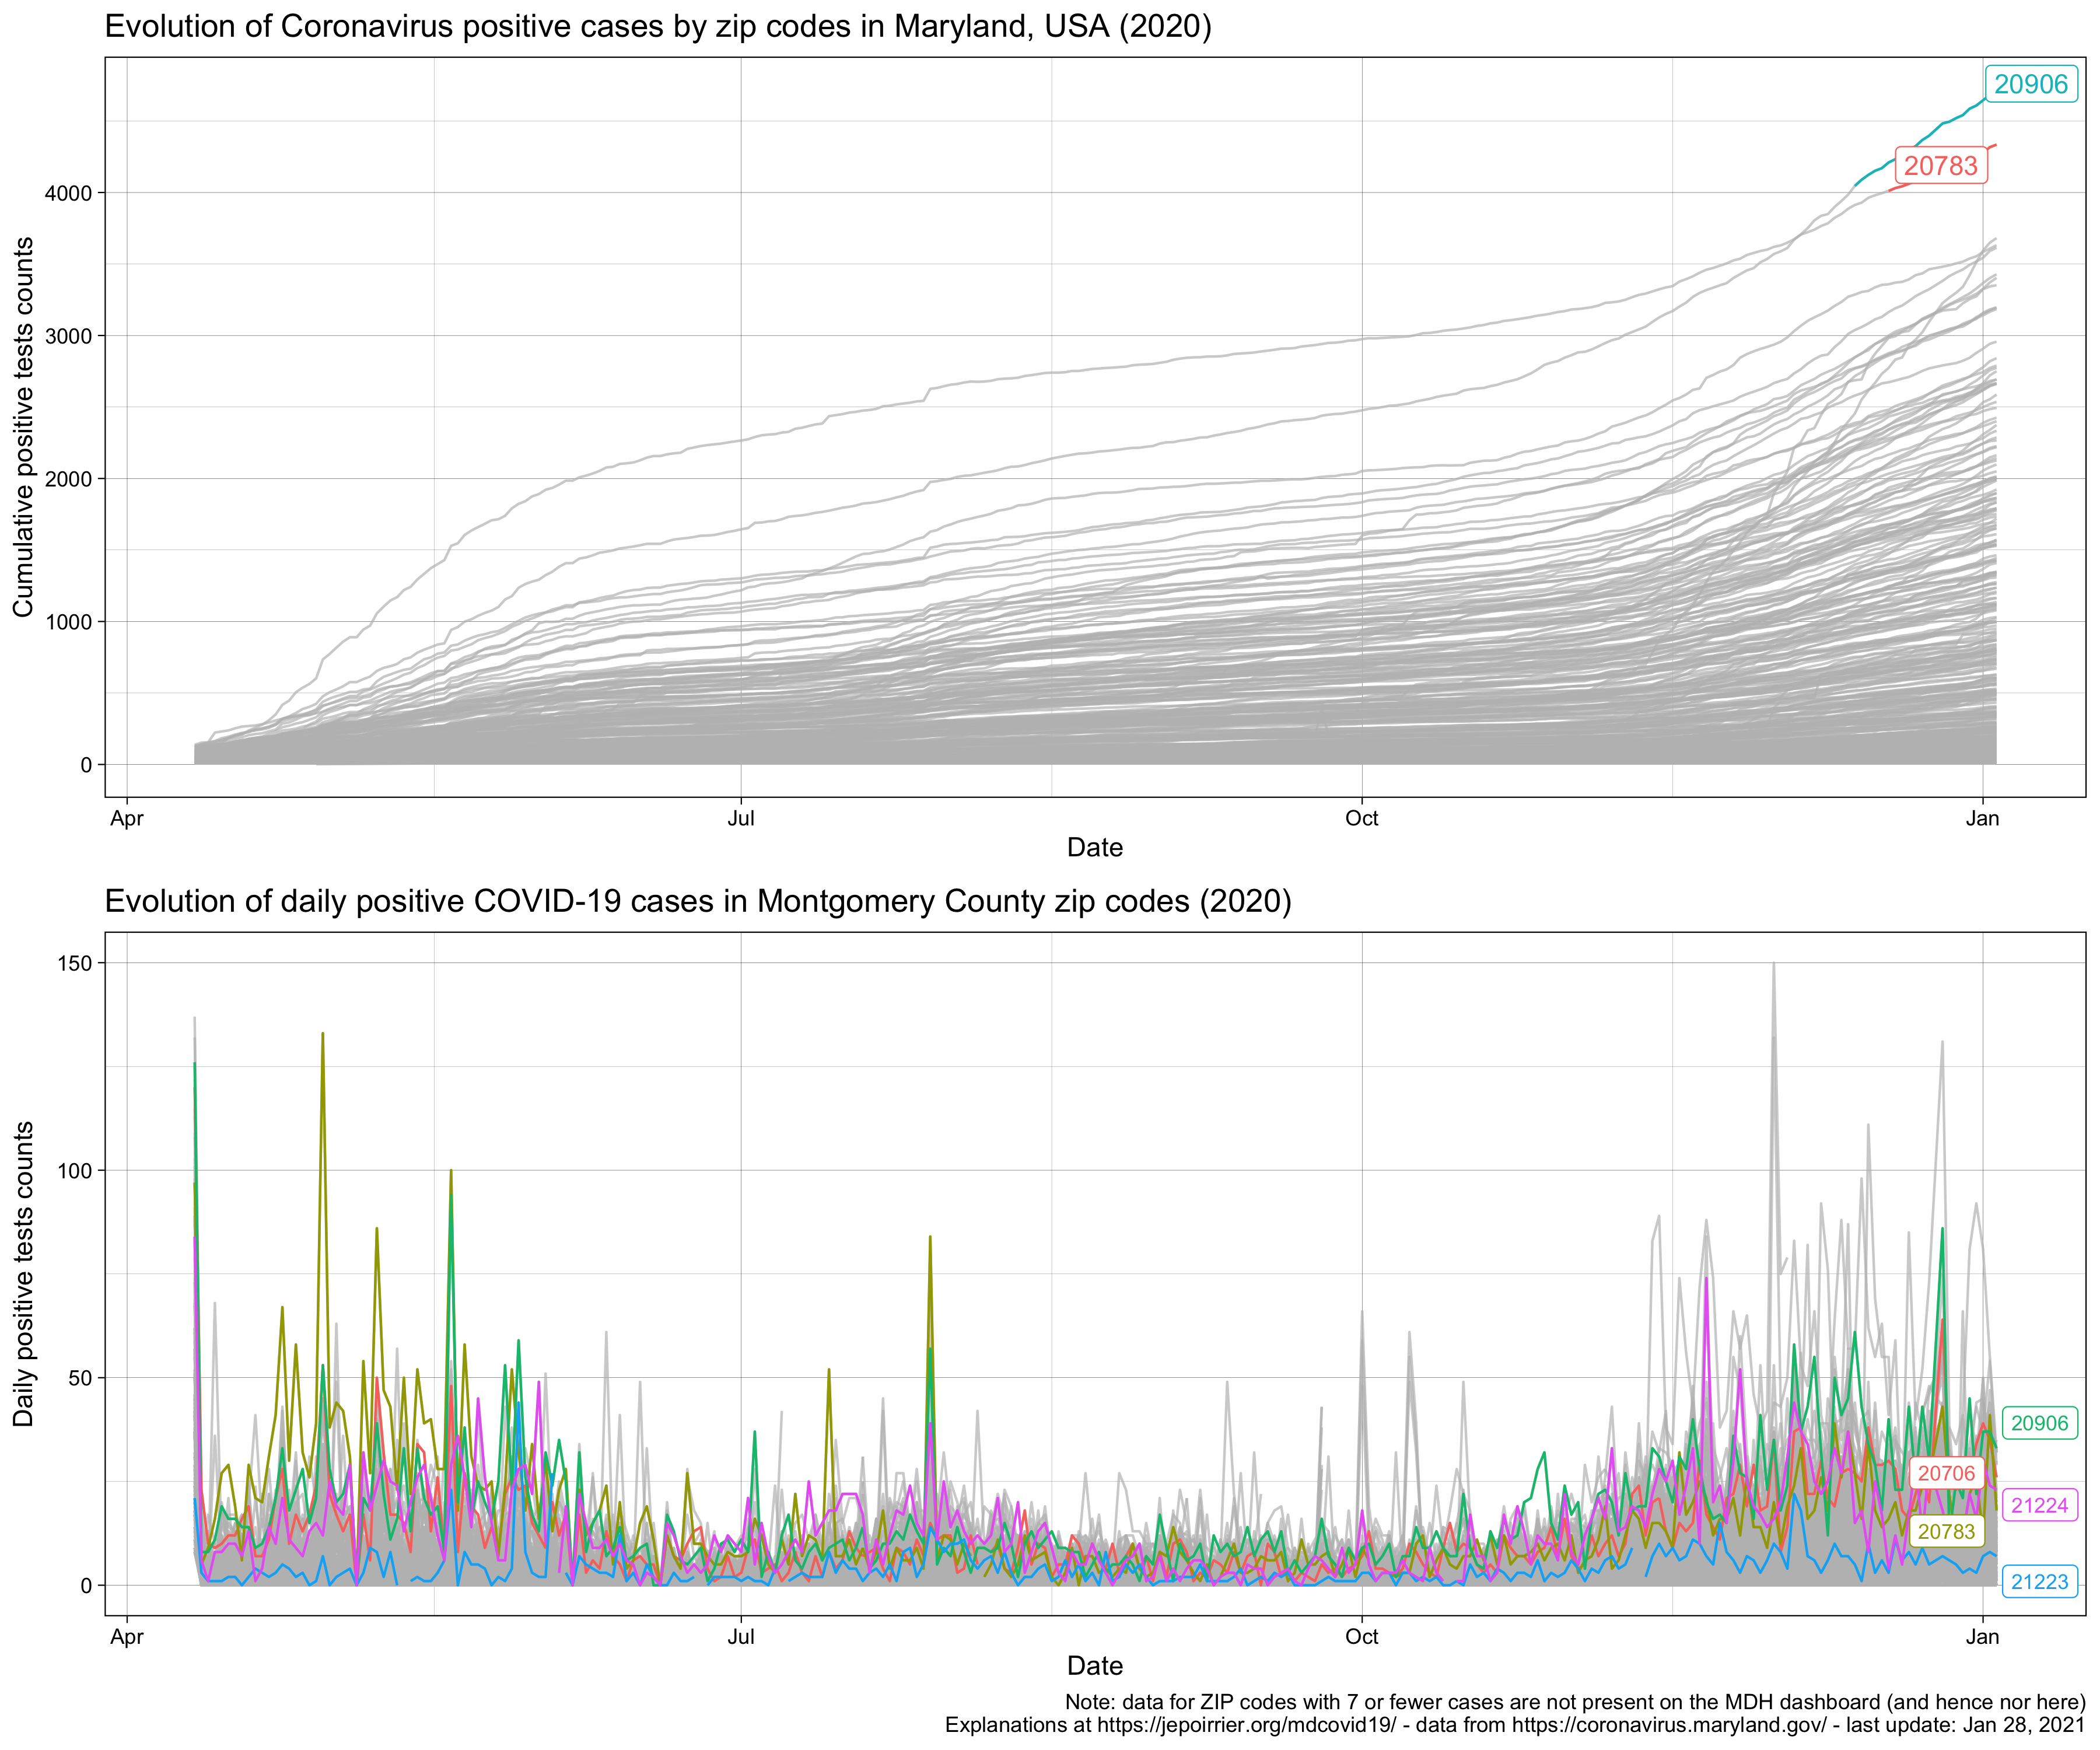
- May 30 - A glimpse at COVID-19 cases in some Maryland ZIP codes
- May 30 - Will it be the end of Stage 1 in Maryland?
- May 21 - No visible impact yet of different COVID-19 Stage 1 strategies in Maryland
- May 16 - Is Maryland ready to reopen? A visual analysis of the decision to enter Stage 1 of reopening Maryland
- May 16 - MD counties COVID-19-specific death rate
- May 12 - MD counties COVID-19 cases adjusted for population
- April 27 - Trend in Coronavirus cases in Maryland (3) including some metrics on how/when Maryland would “reopen”
- April 26: Trend in COVID-19 cases by Zip code in Maryland
- March 28 - April 26: Trend in Coronavirus cases in Maryland, USA (2)
- March 16-27: Trend in Coronavirus cases in Maryland, USA
Tools:
- Dashboard allowing the exploration of cases per zip codes
- Github repository with data and R scripts
Figures. These figures are all on the Github repo, in the figures/ directory. While they are not too many, I’ll link them below (they are updated automatically). You may click on them to better see details.
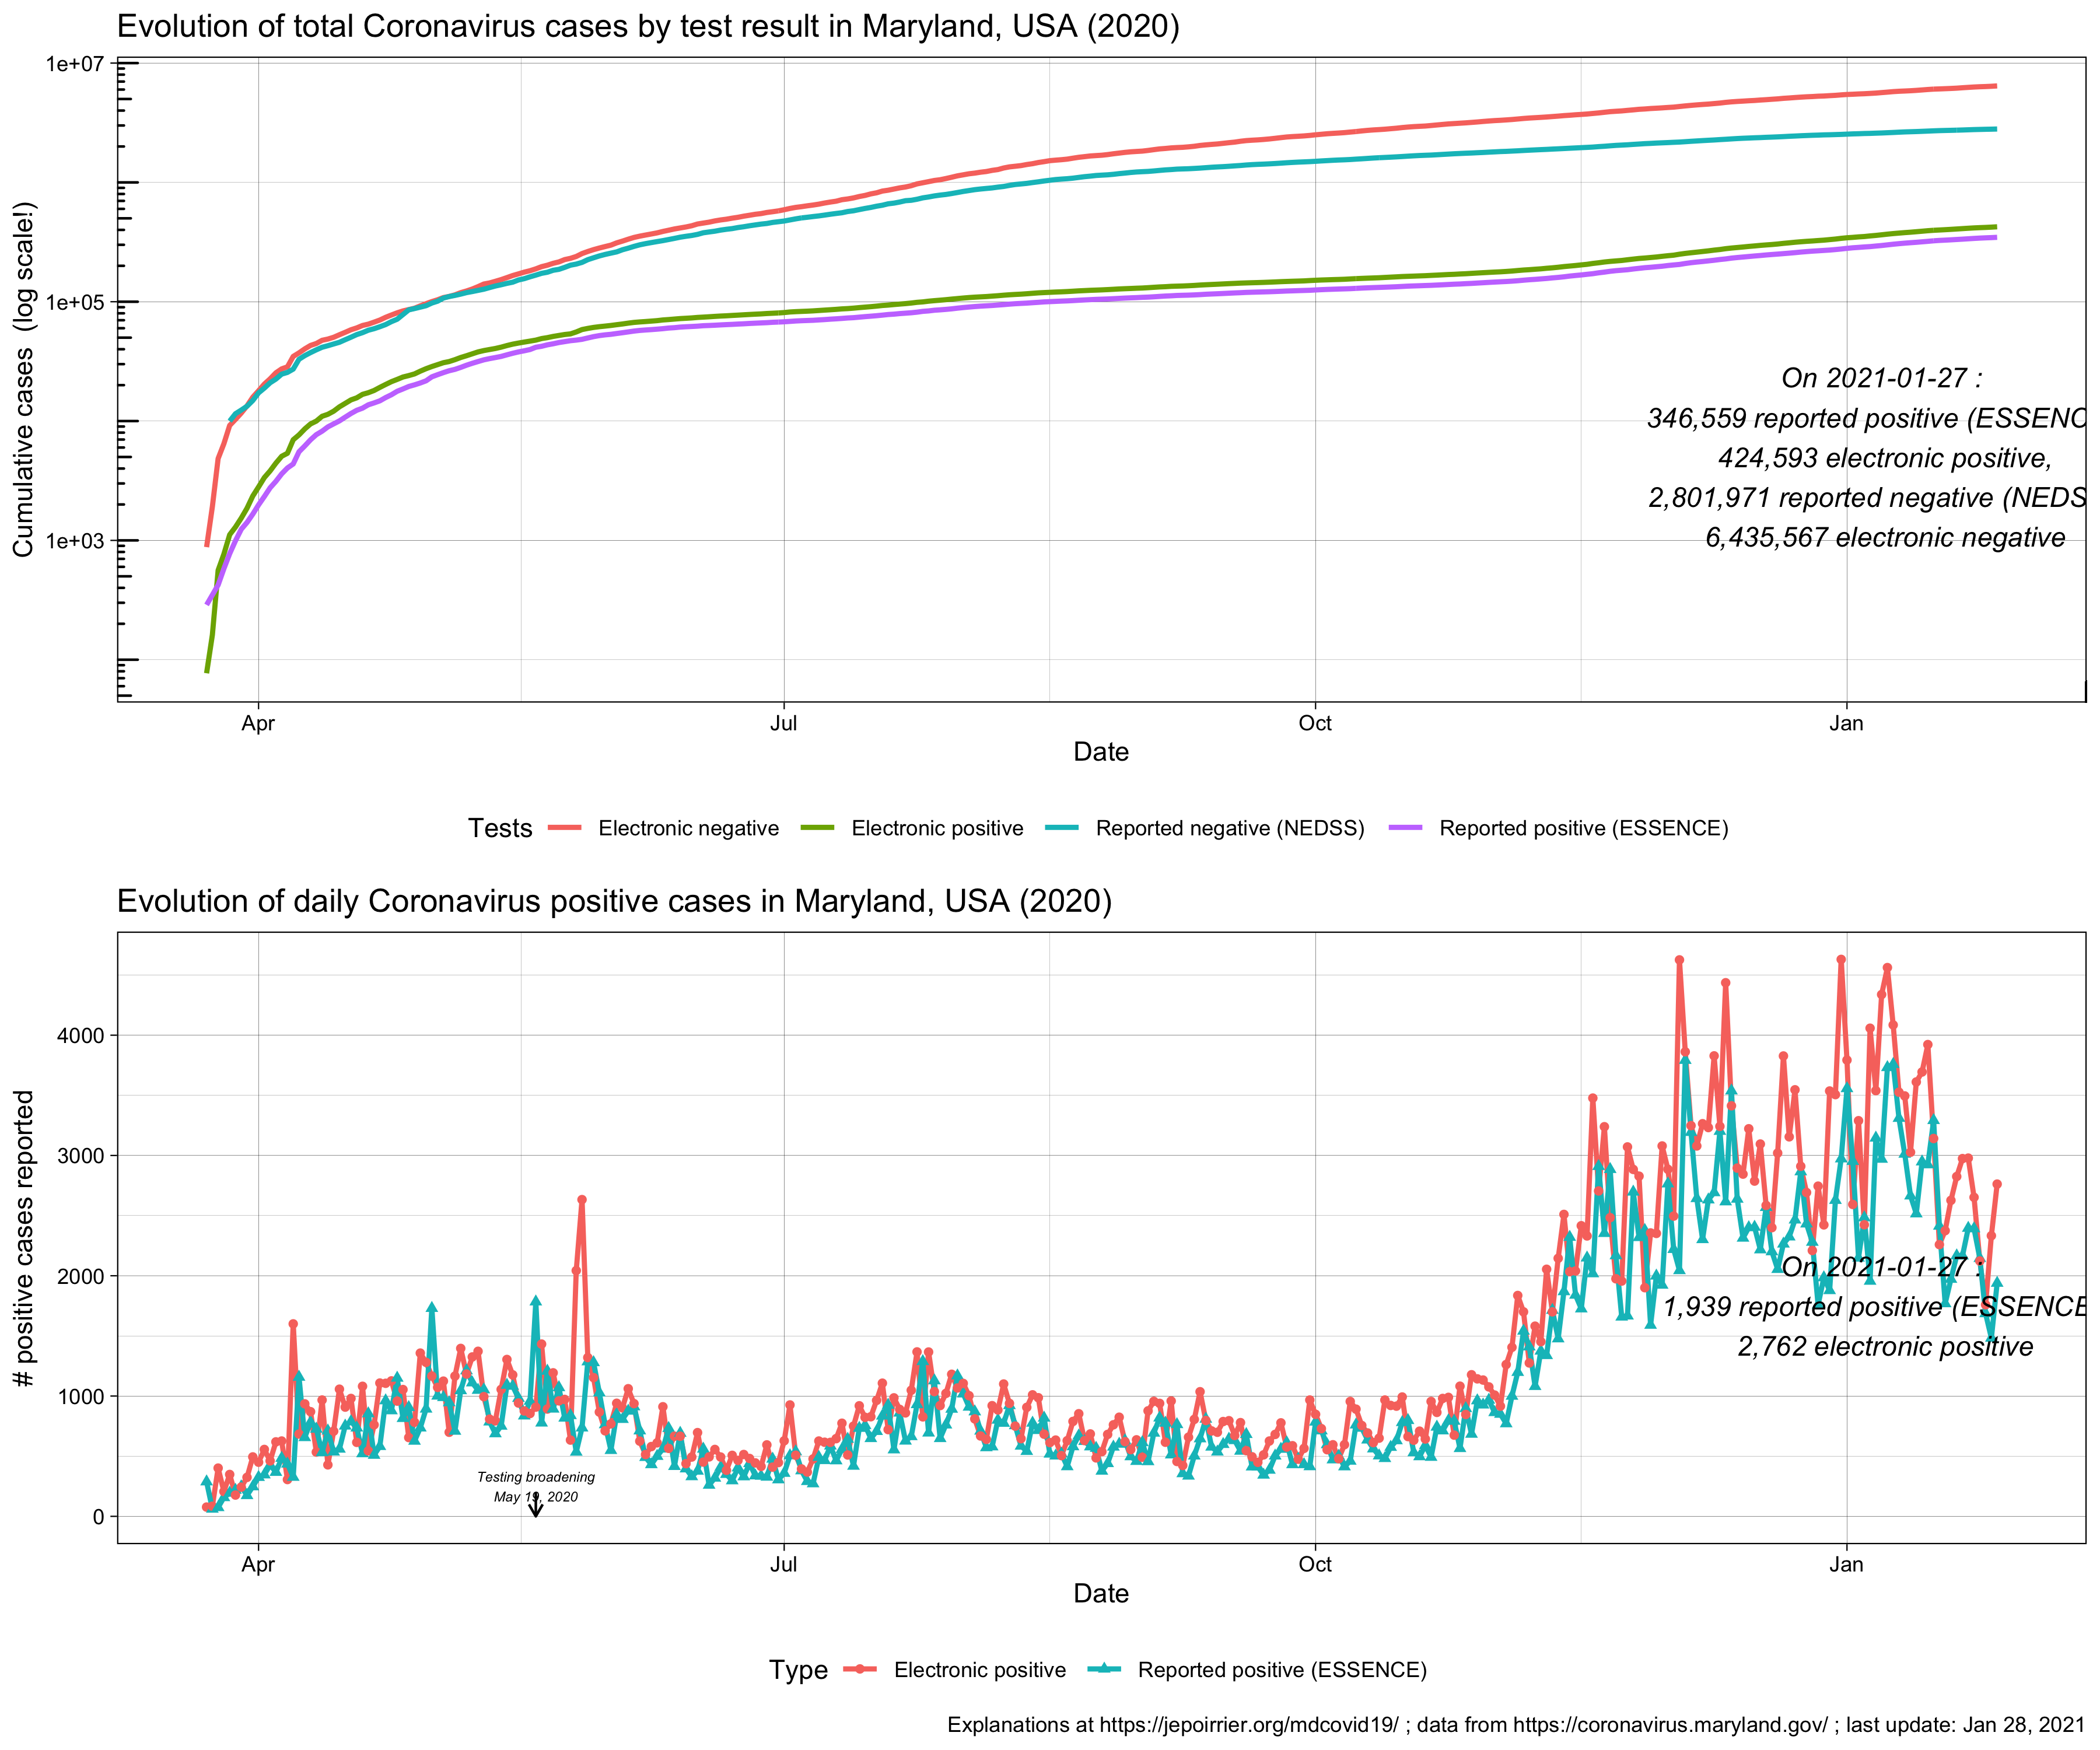
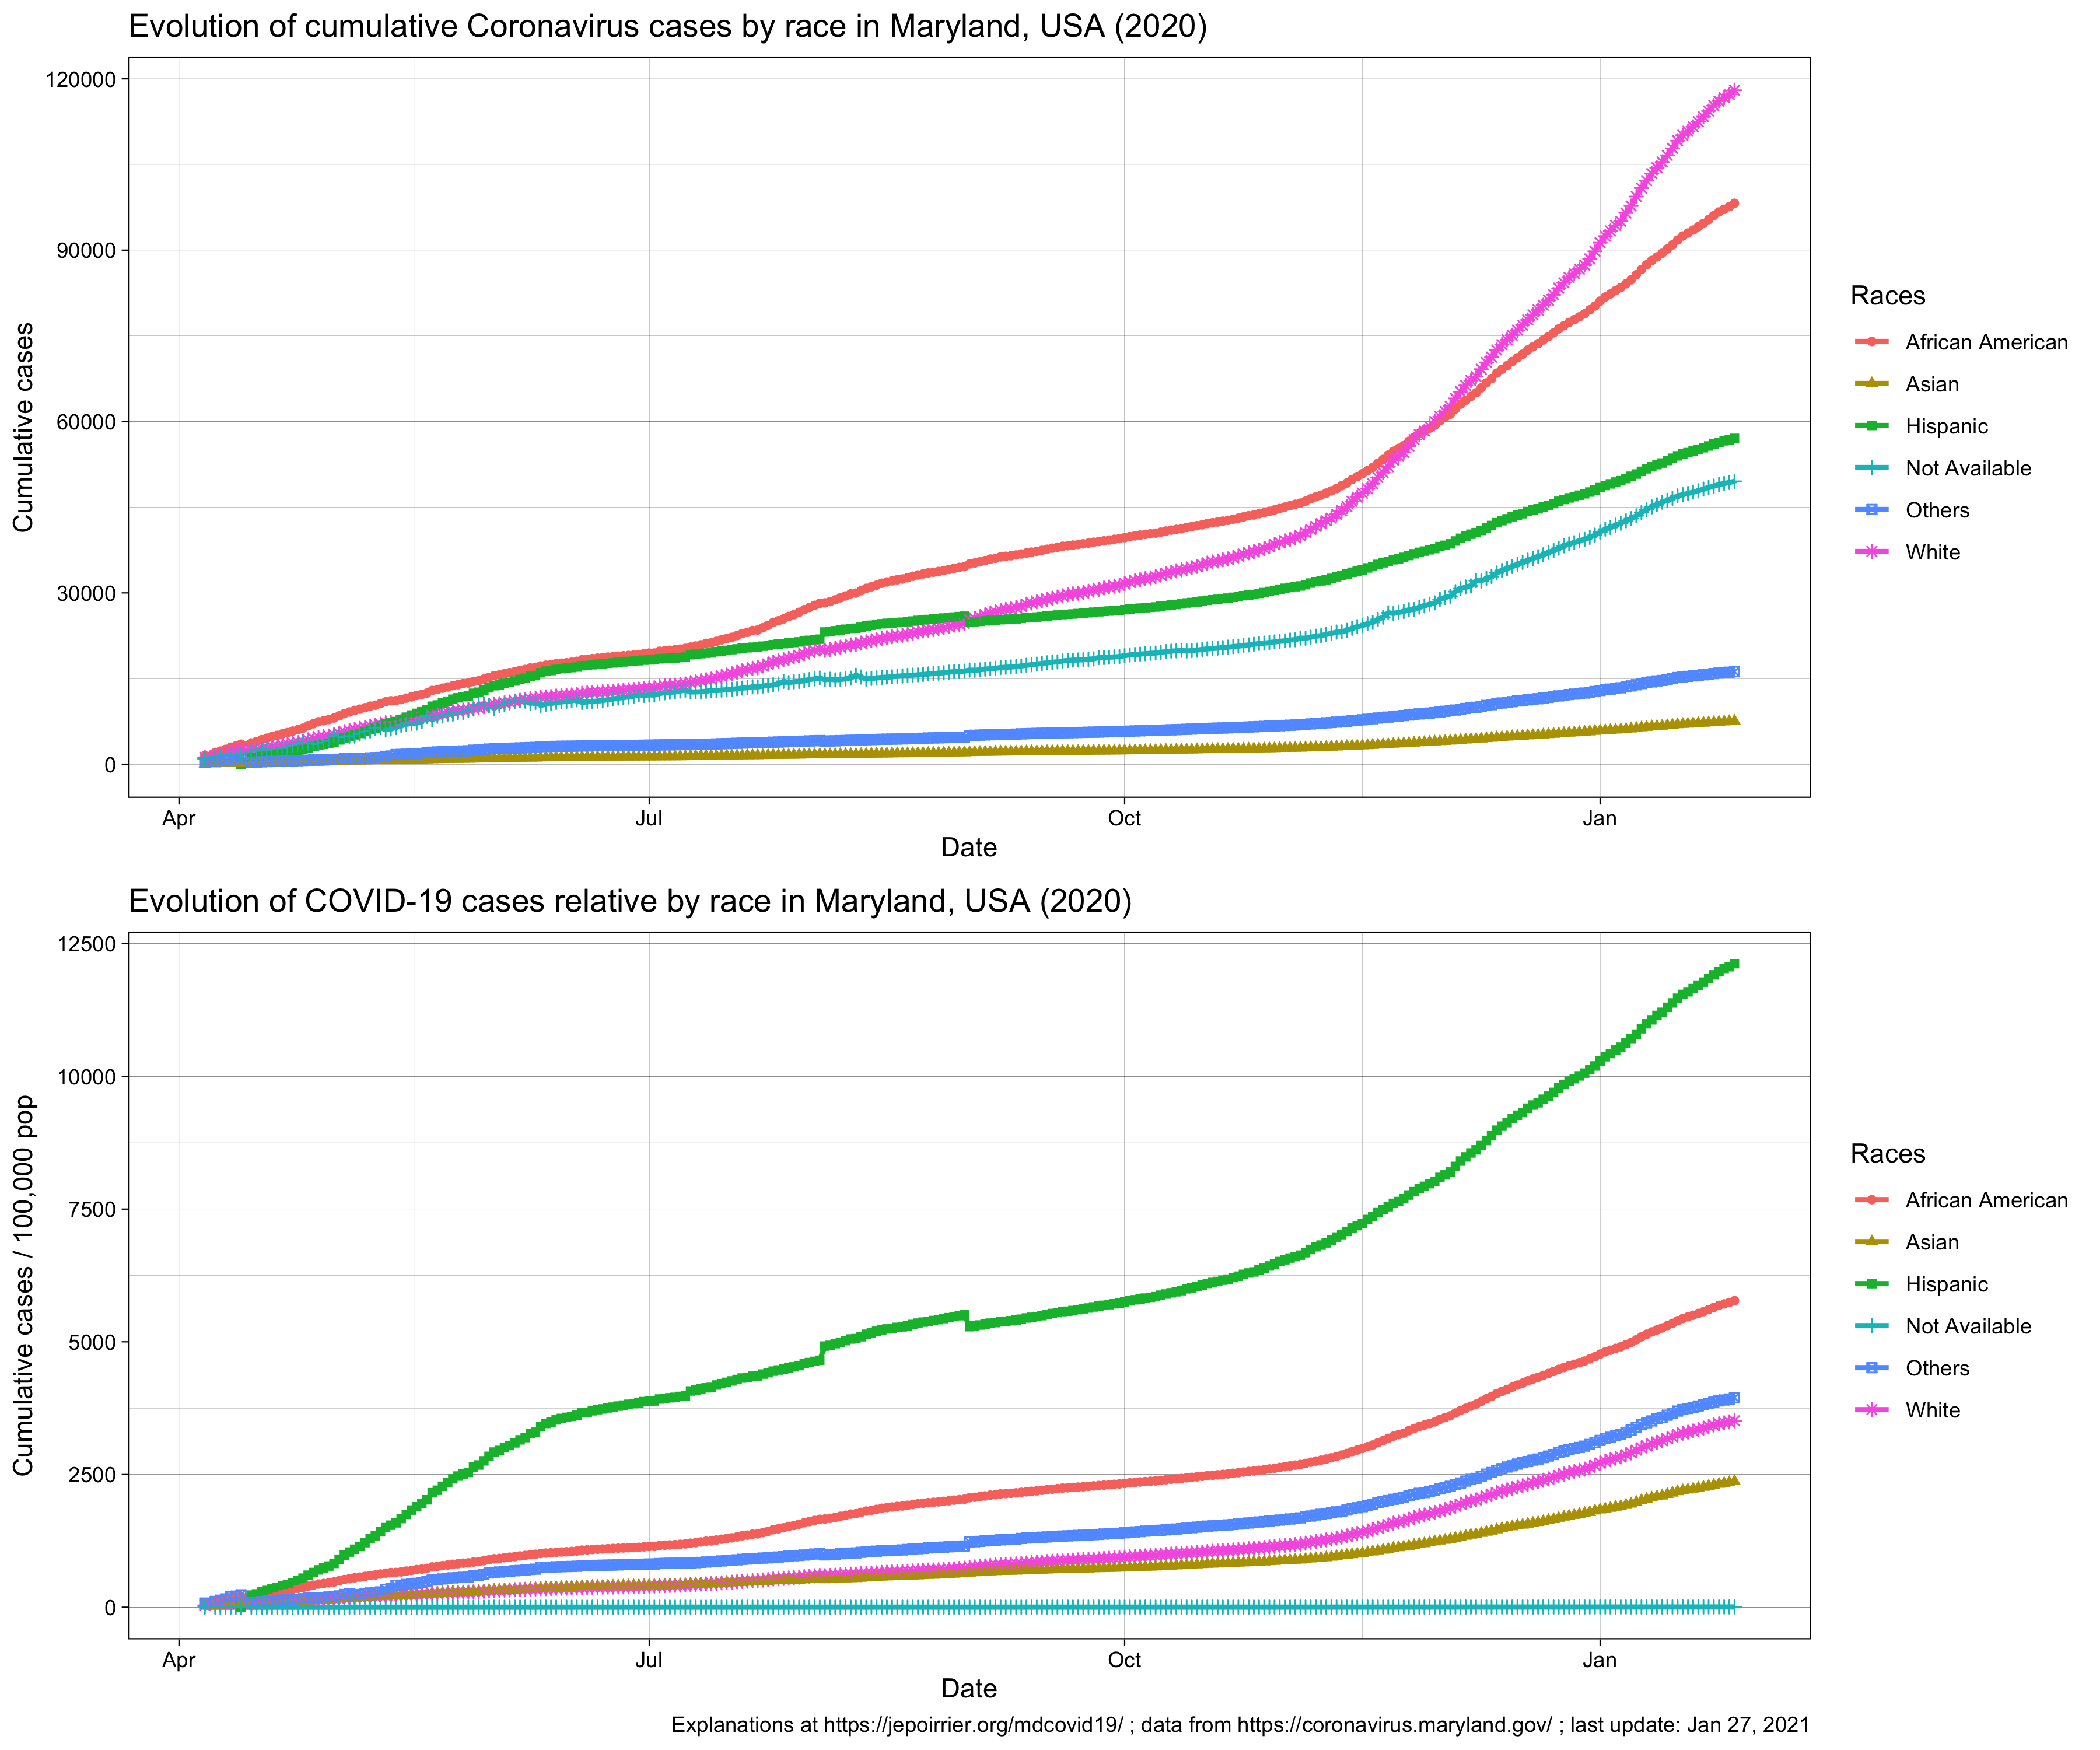
Cases
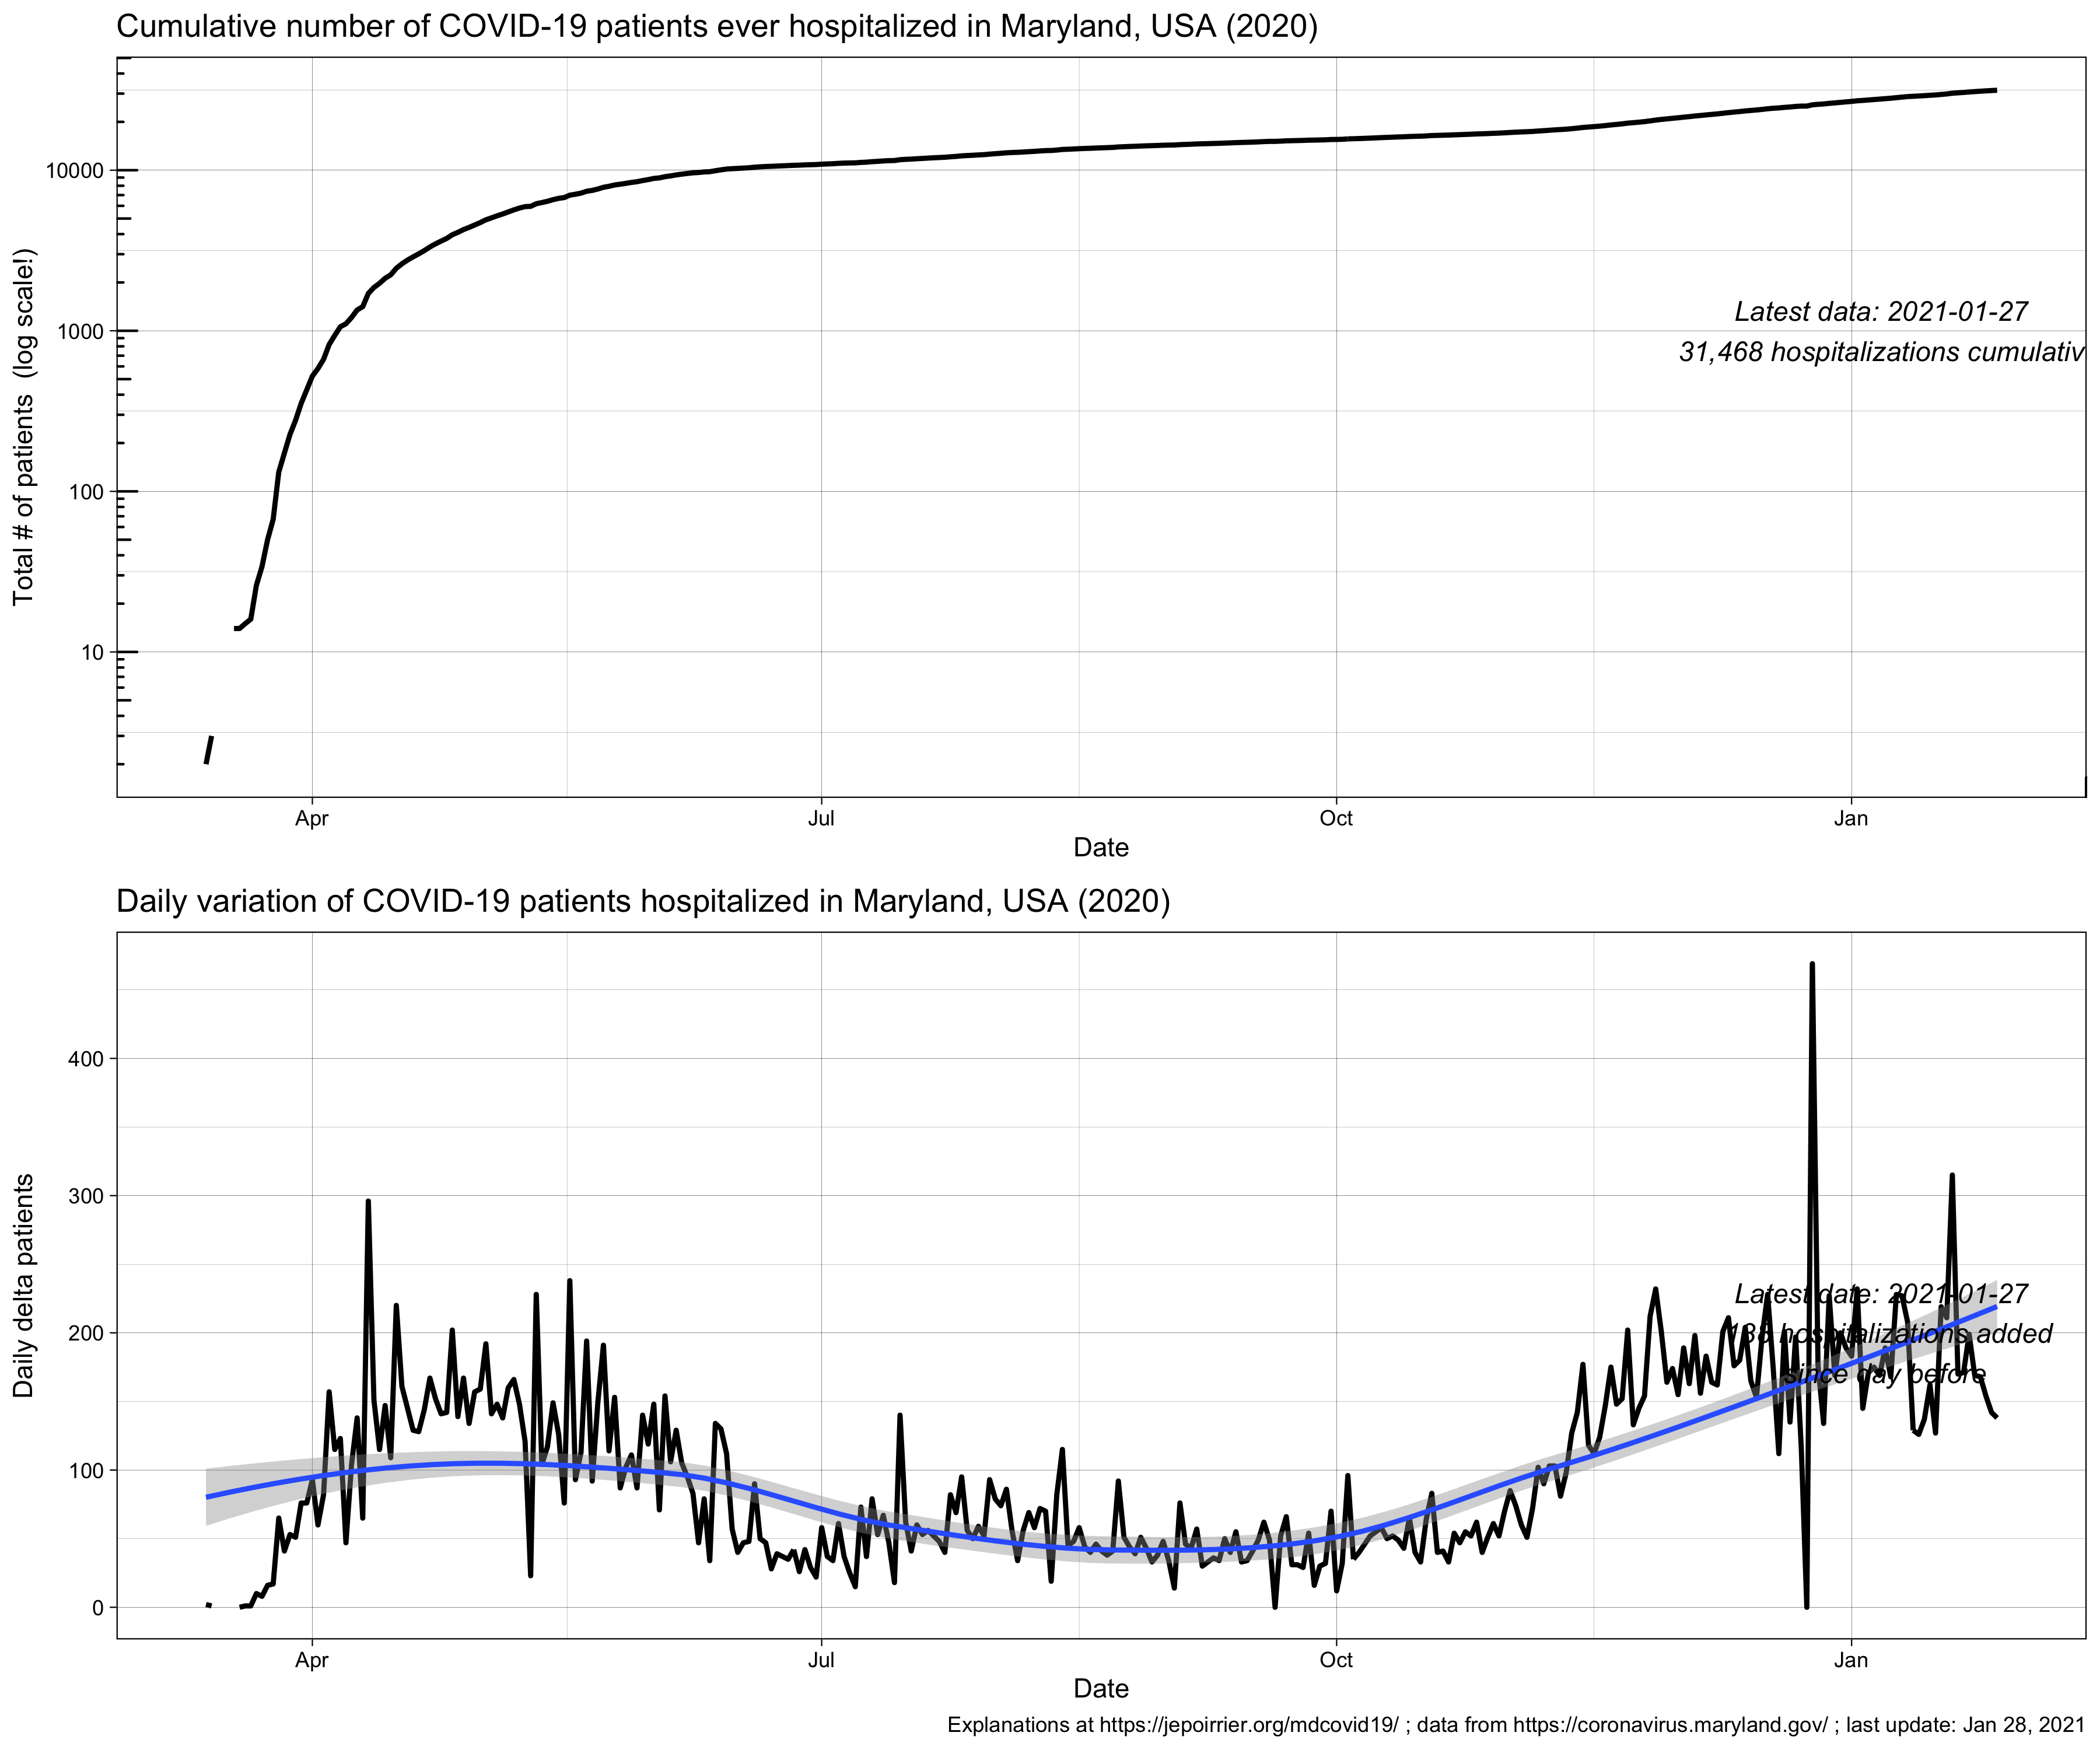
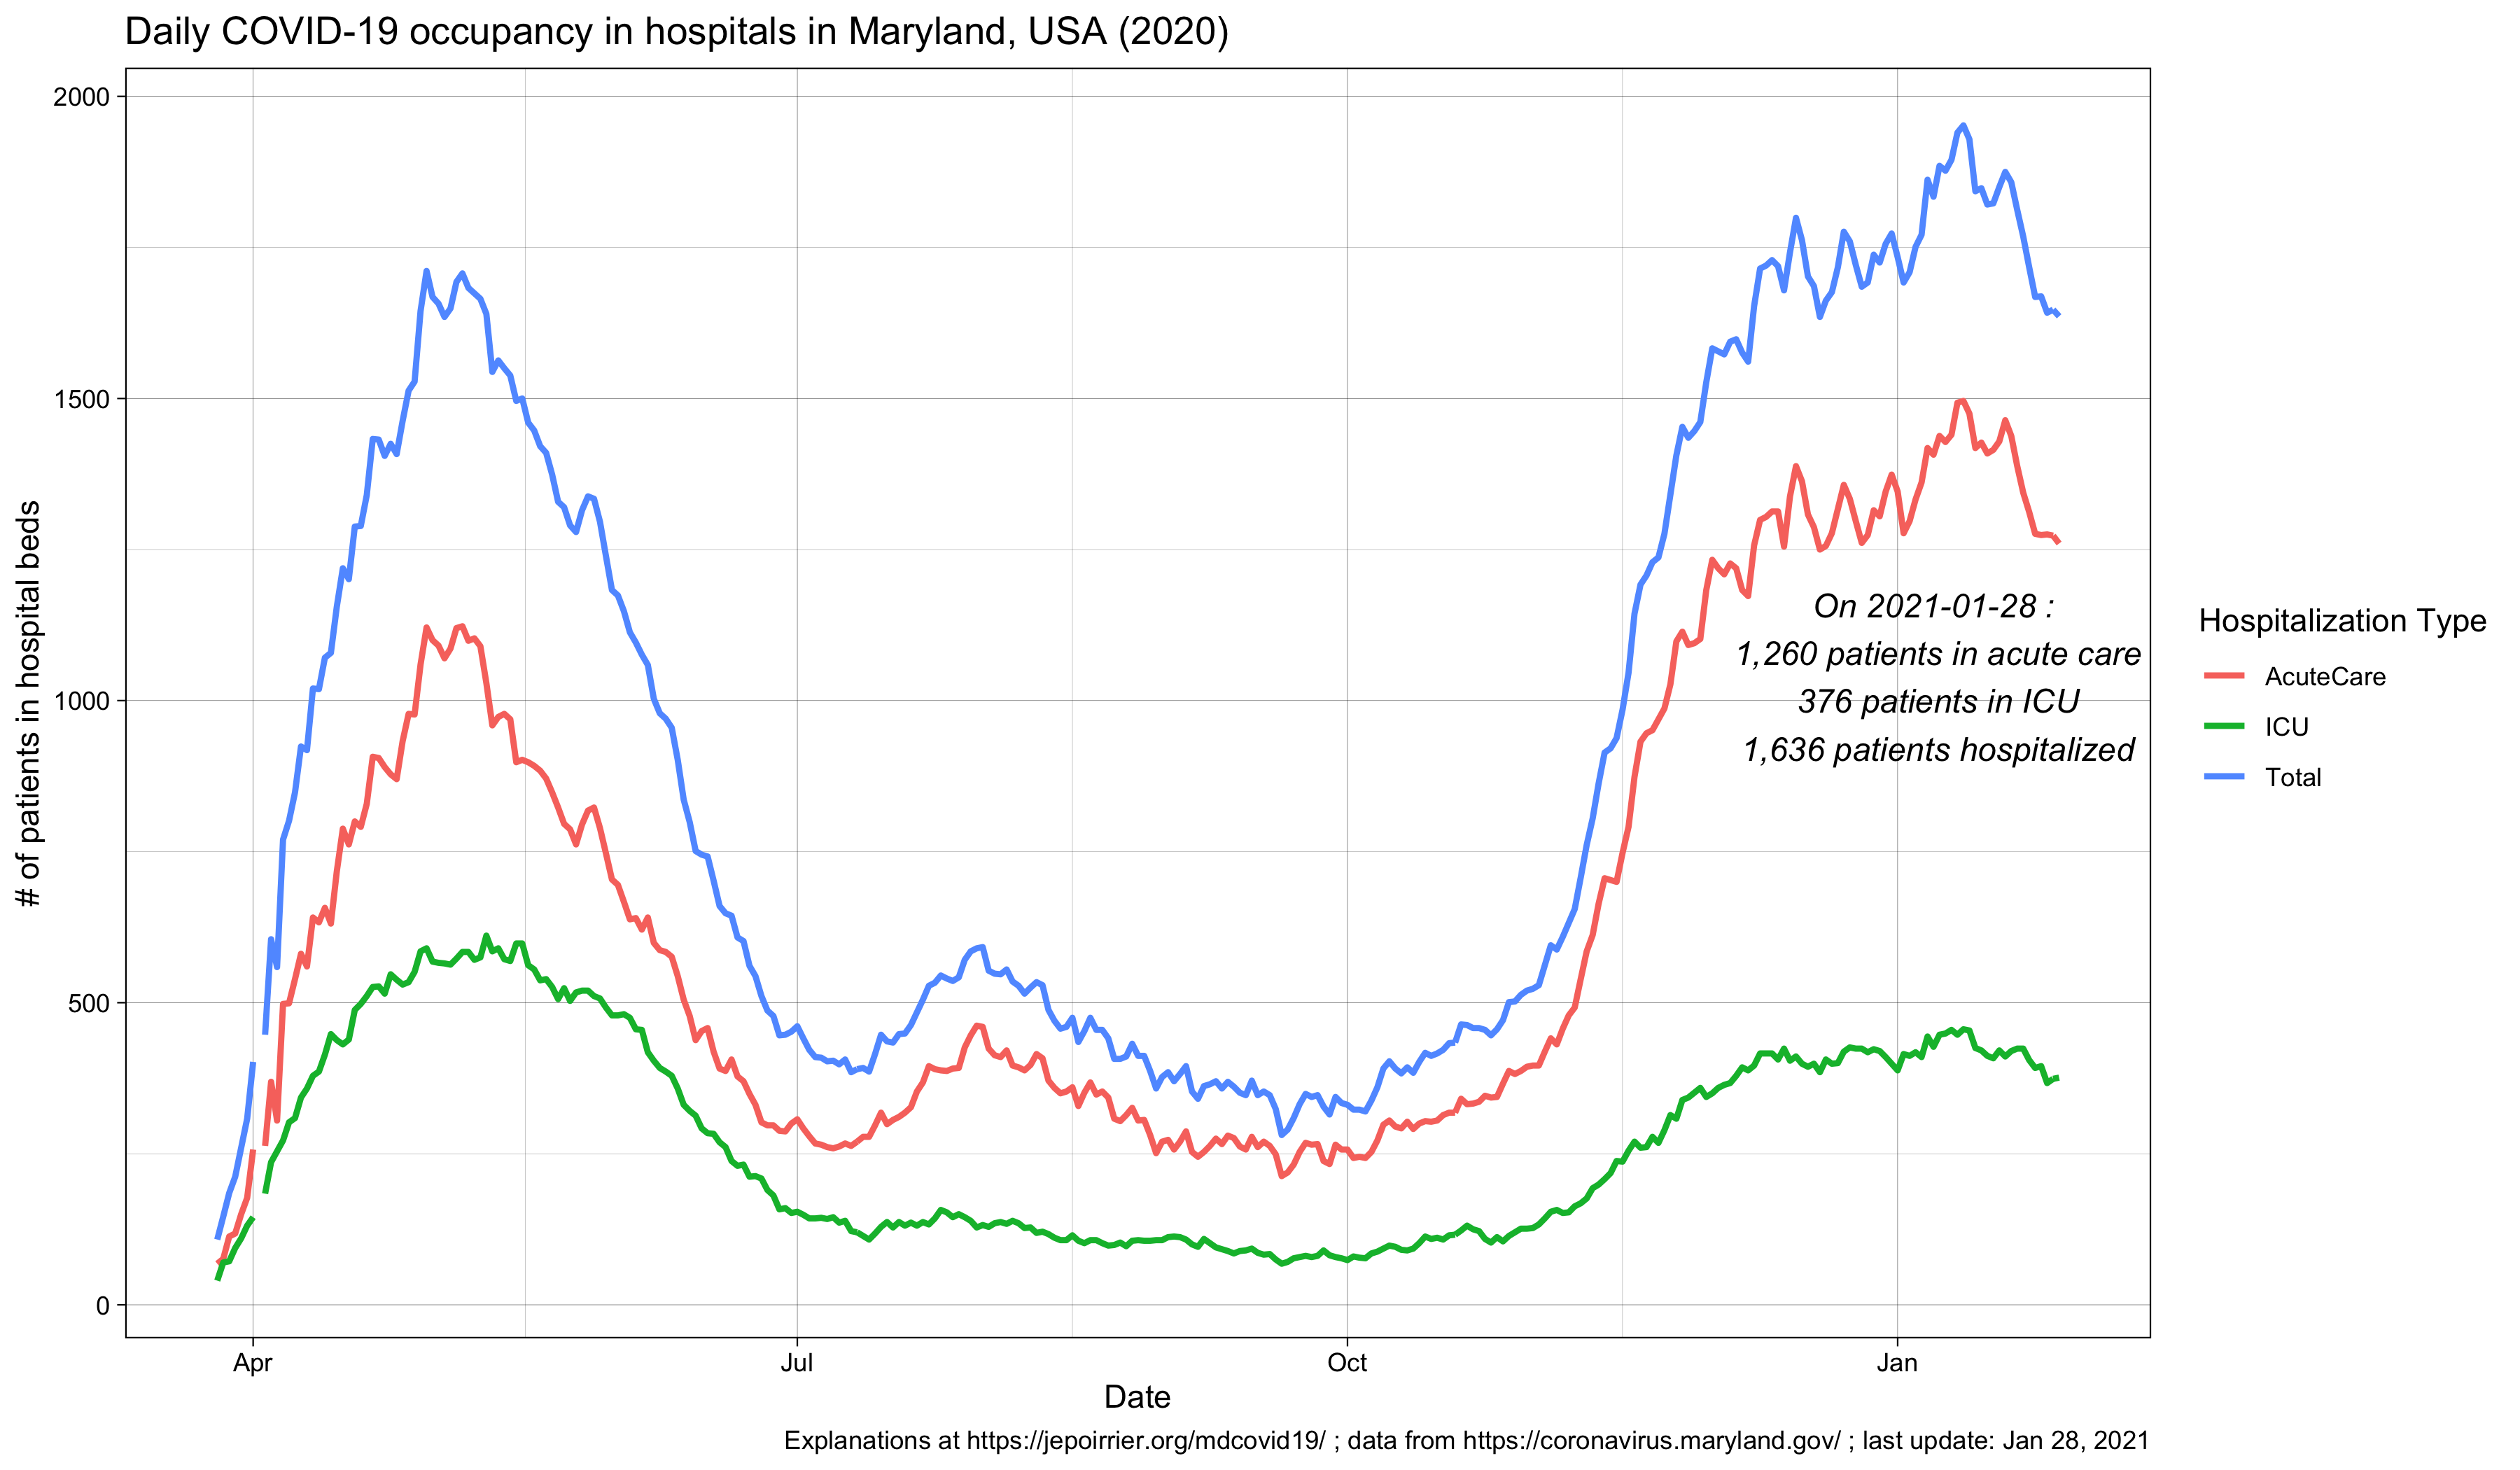
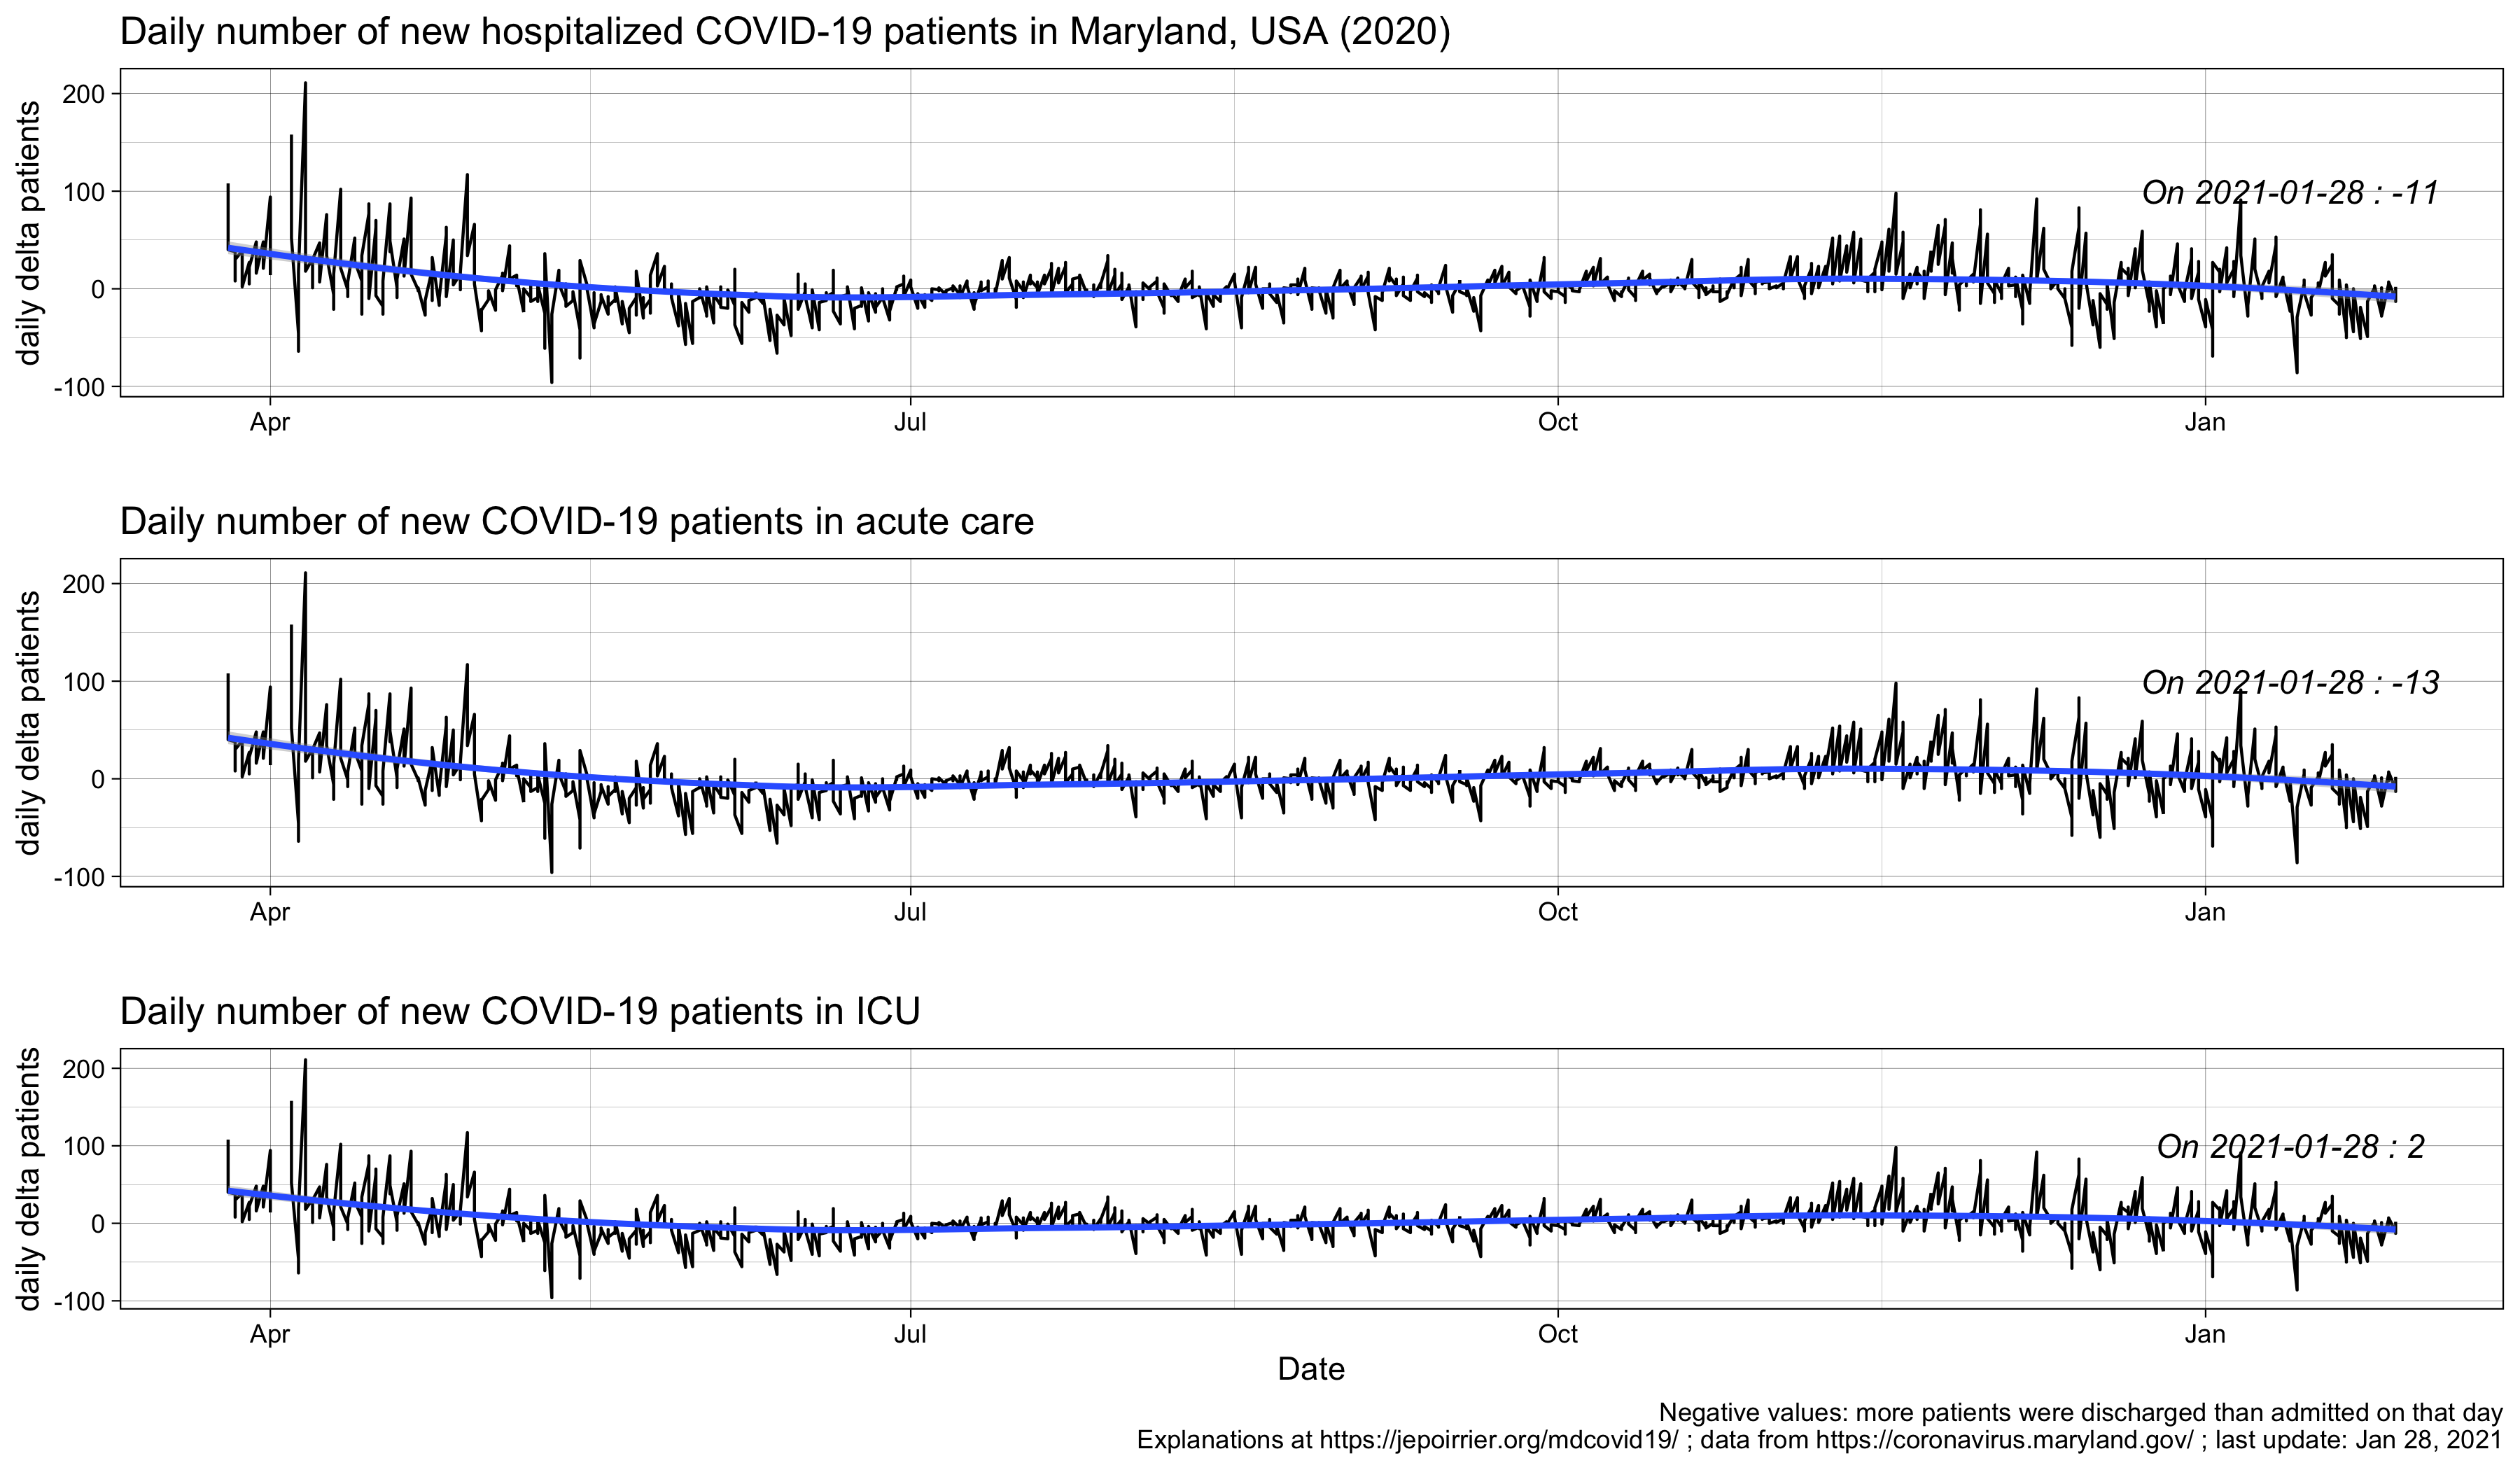
Hospitalizations
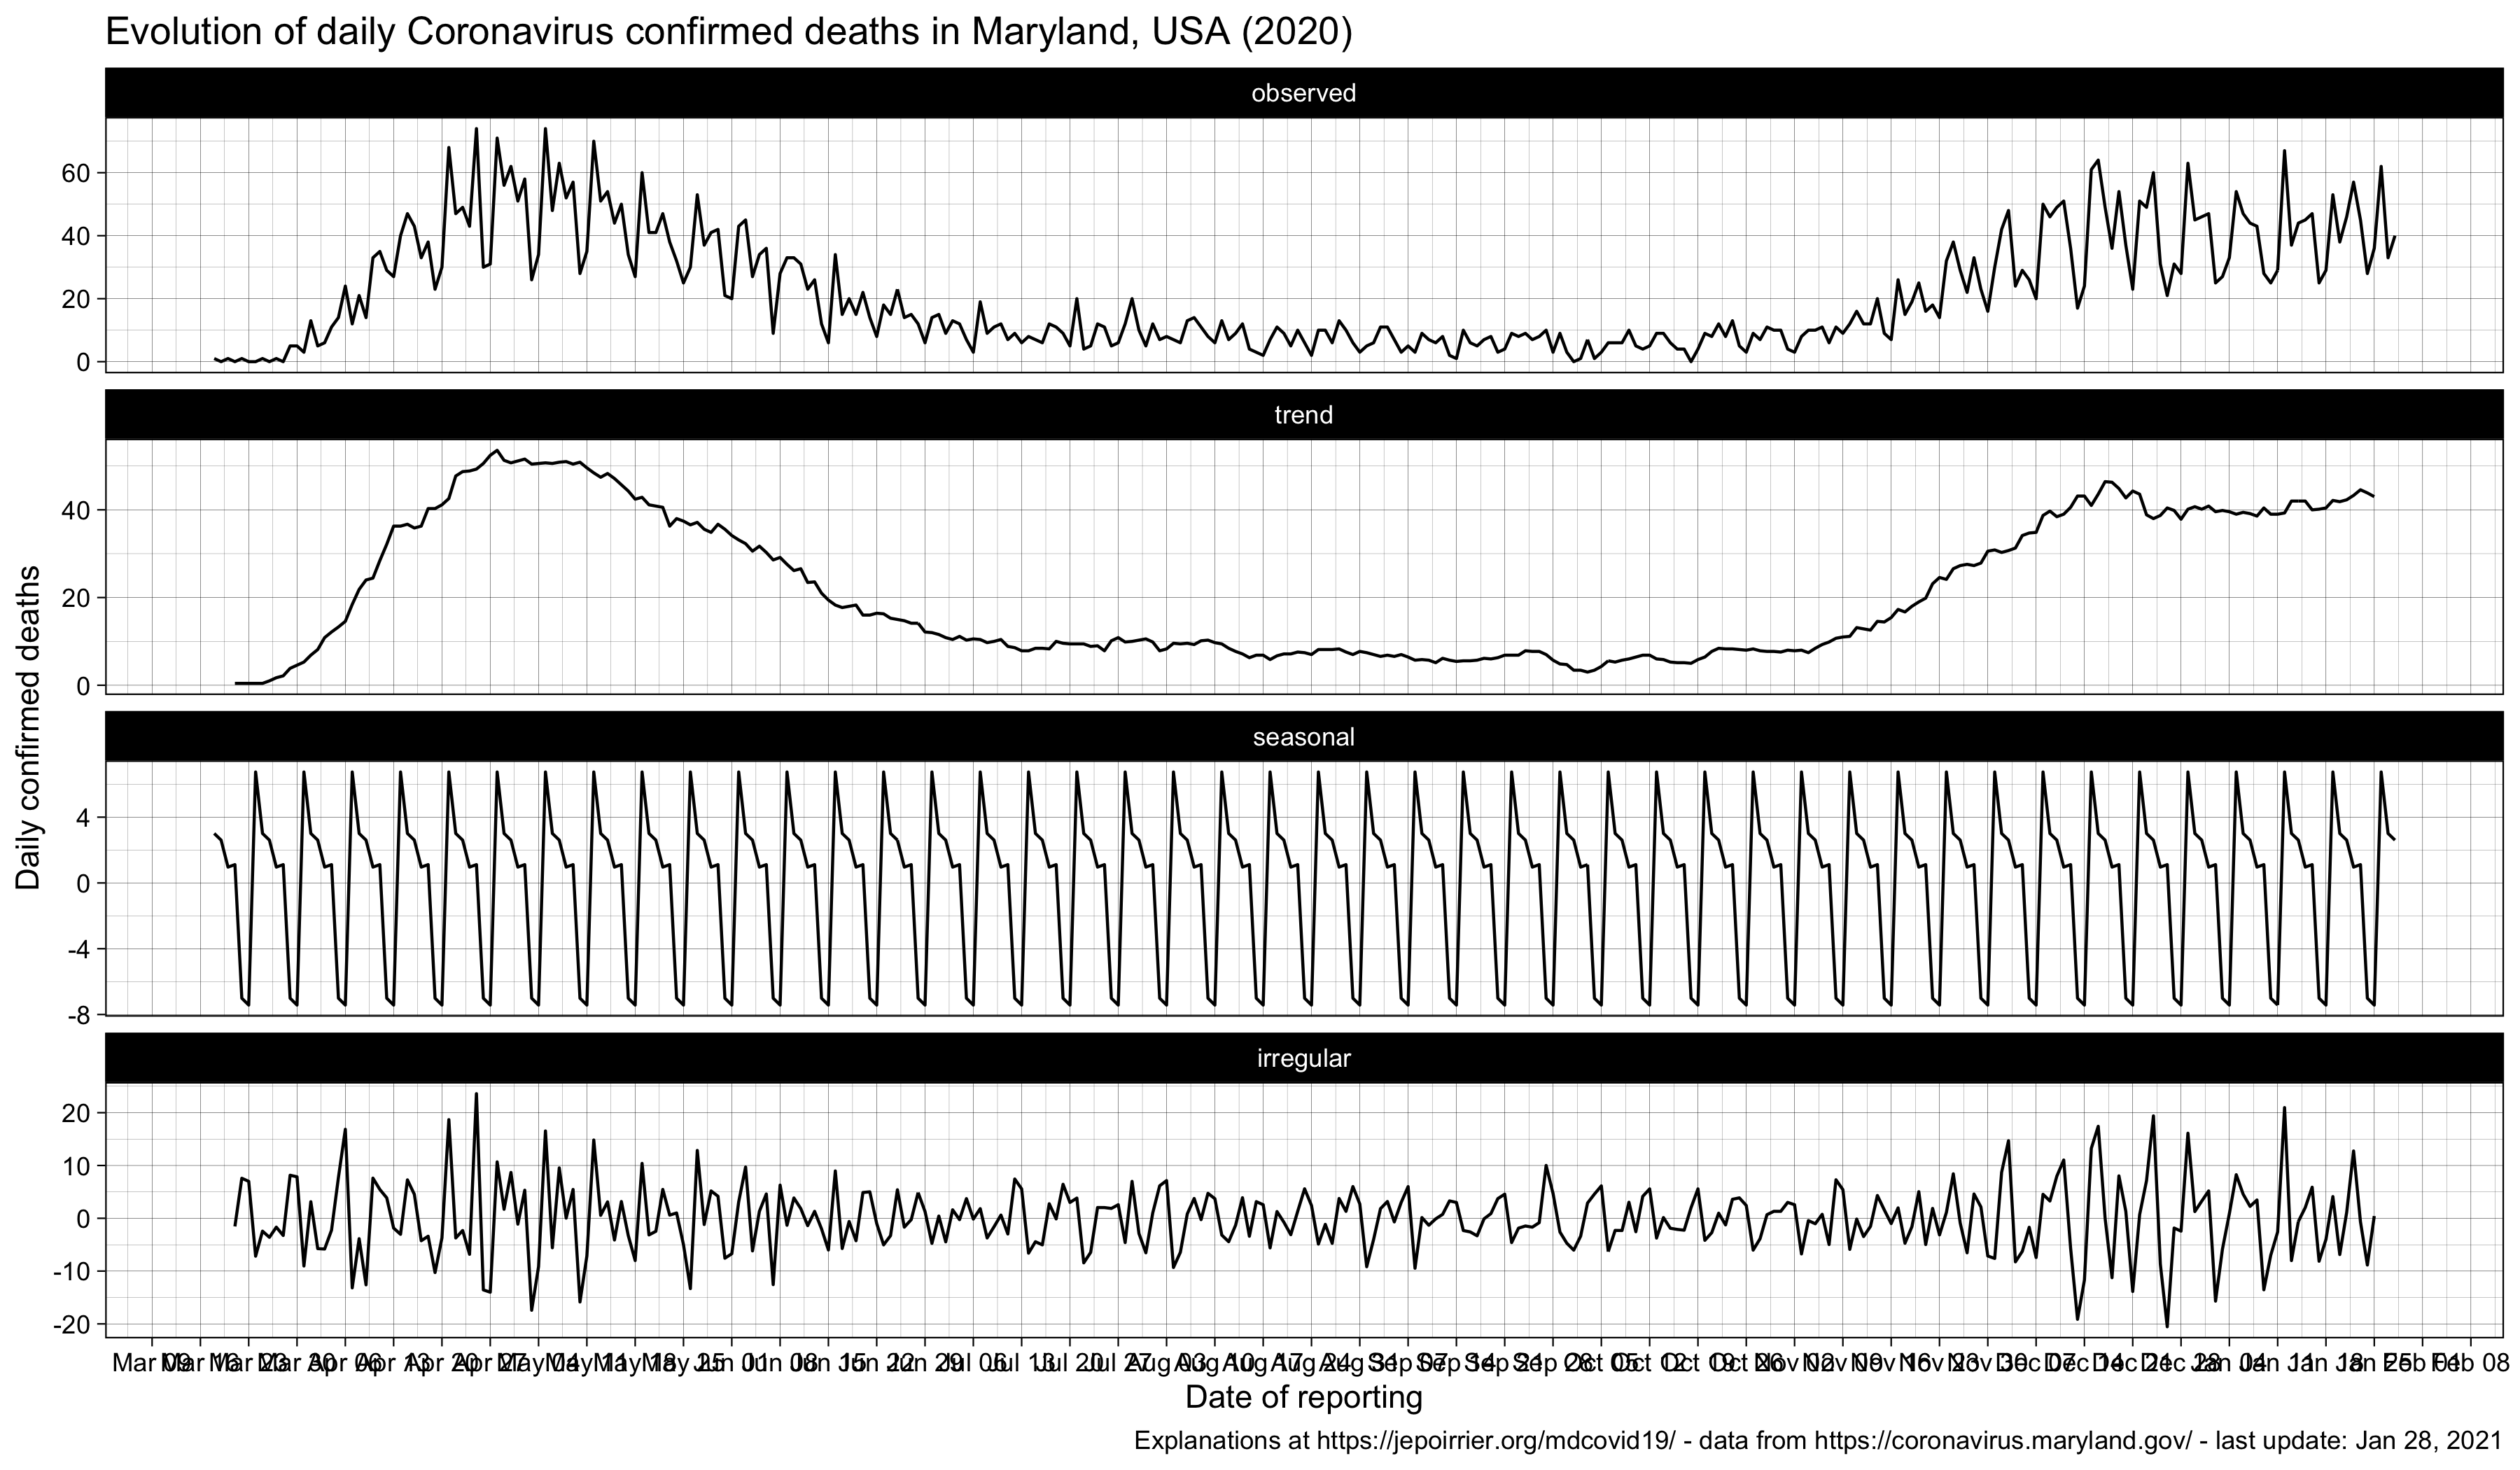
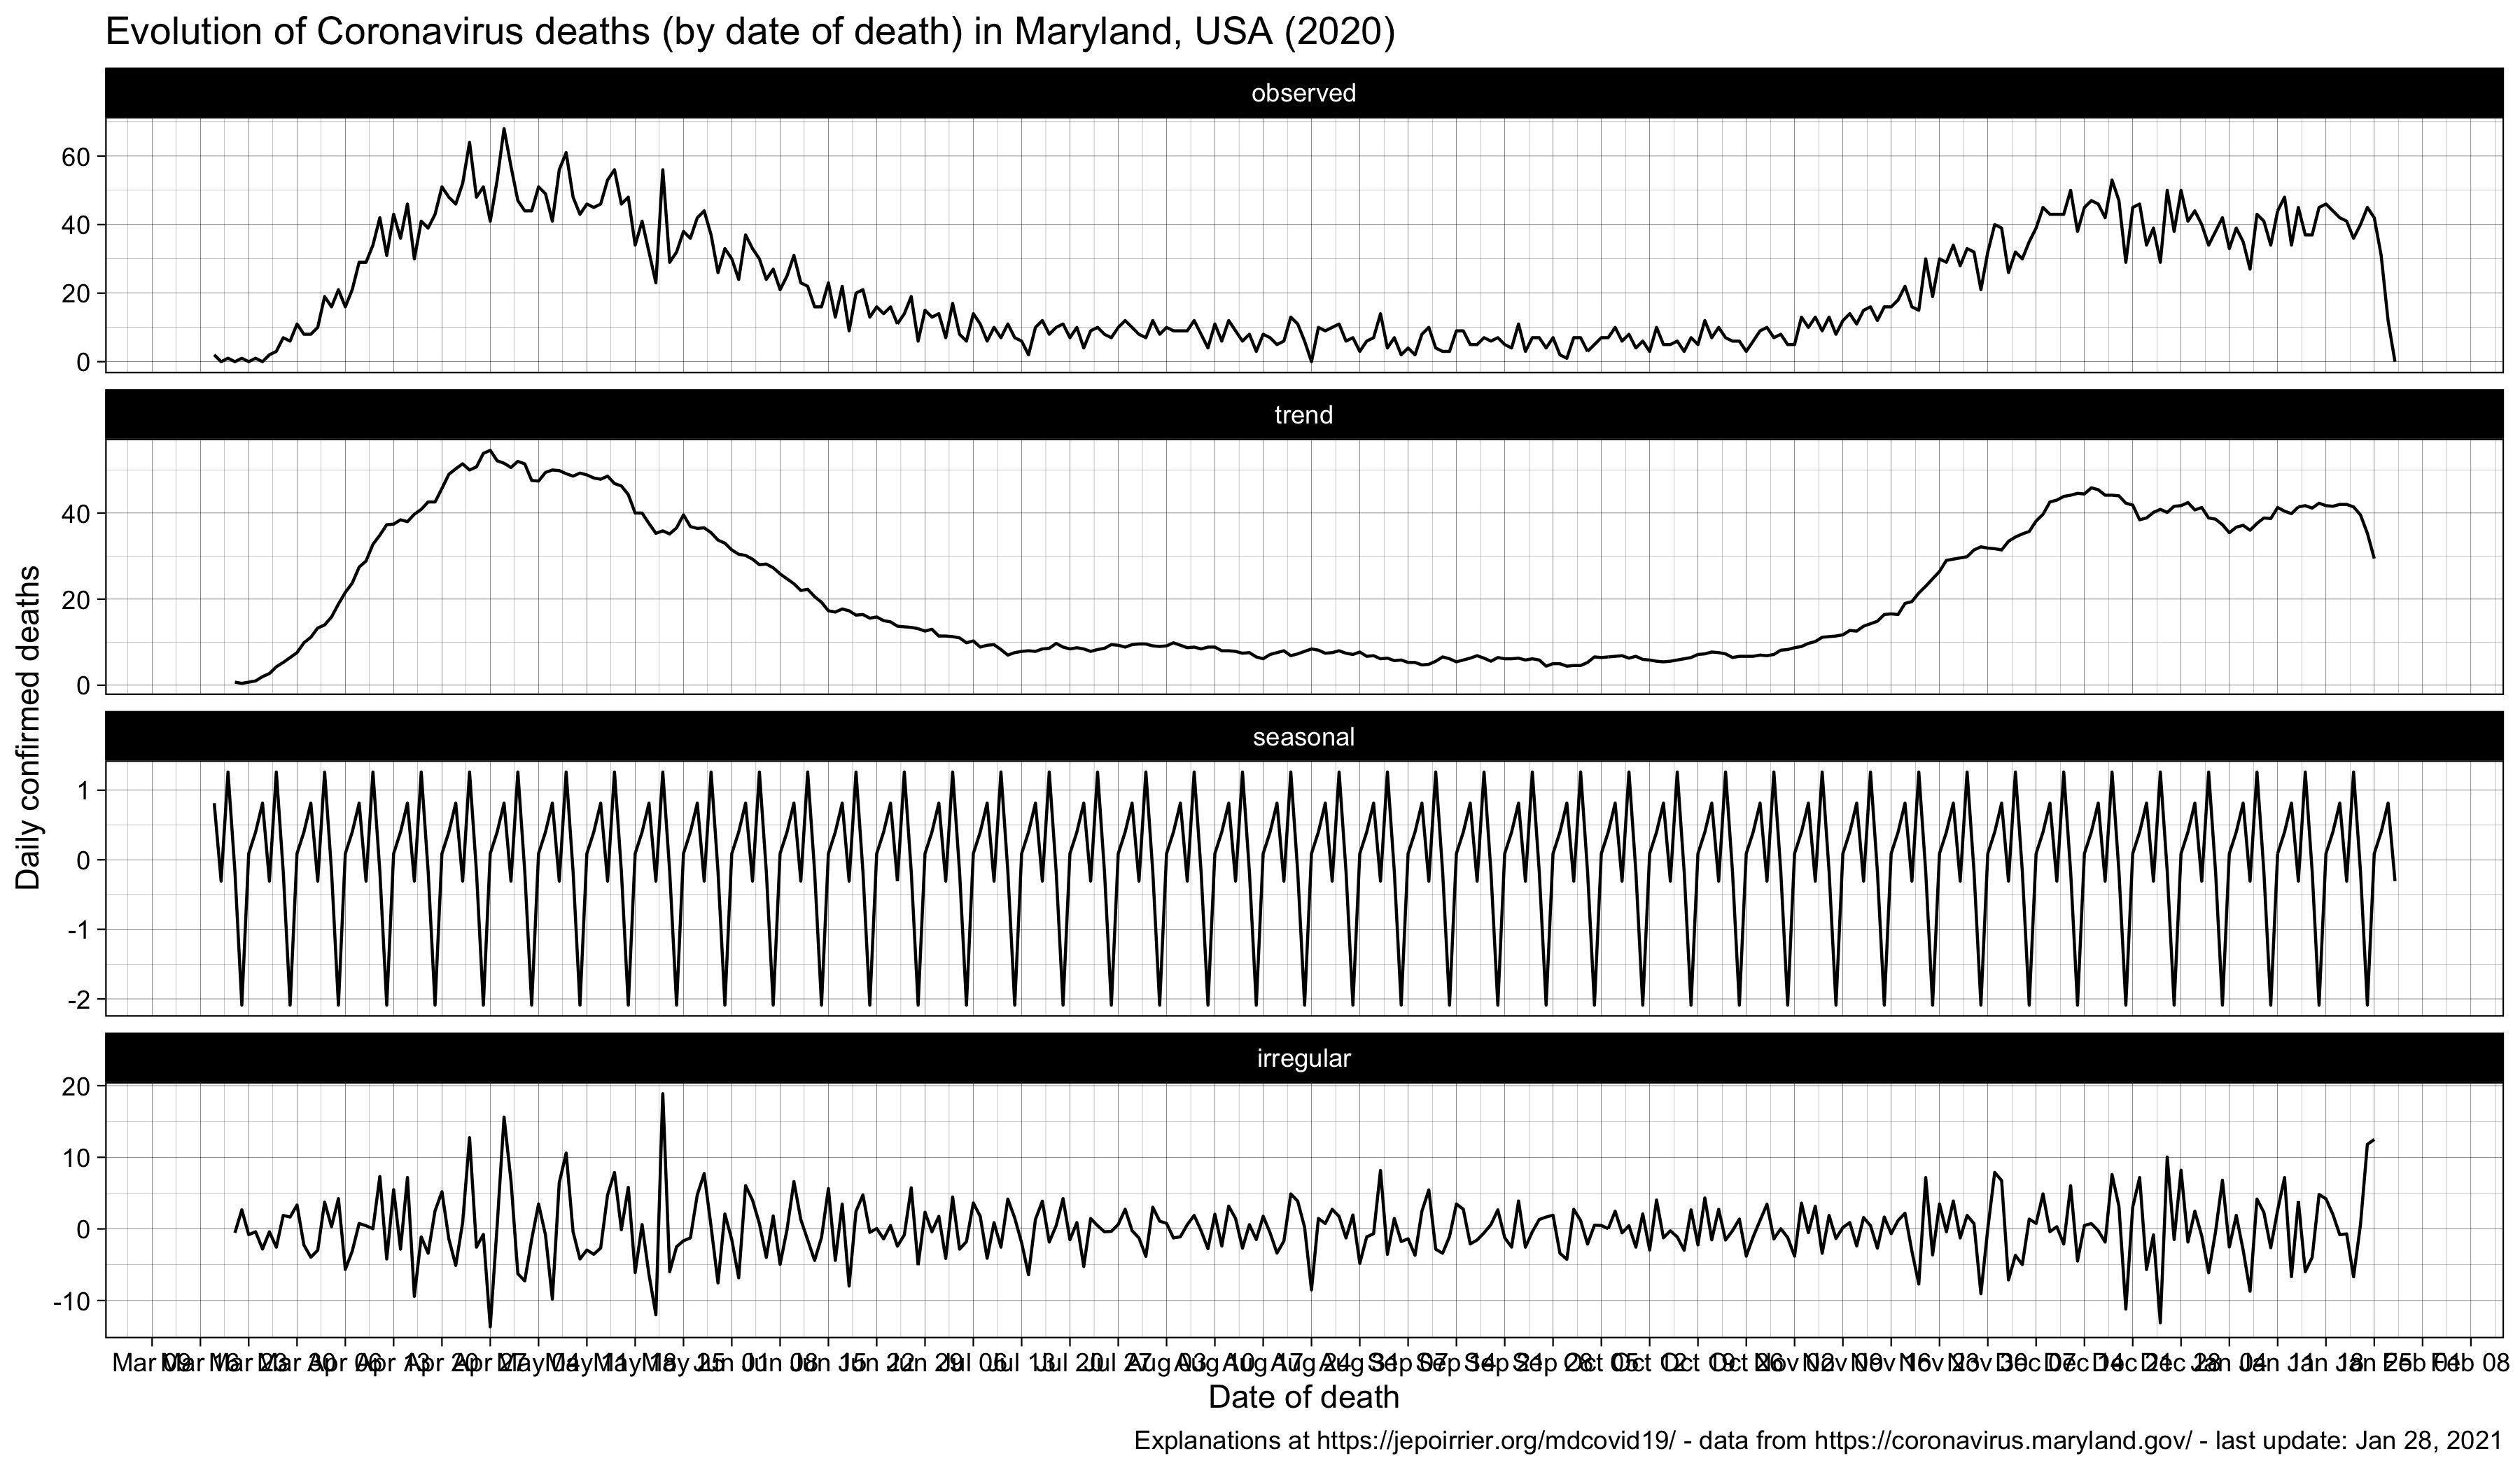
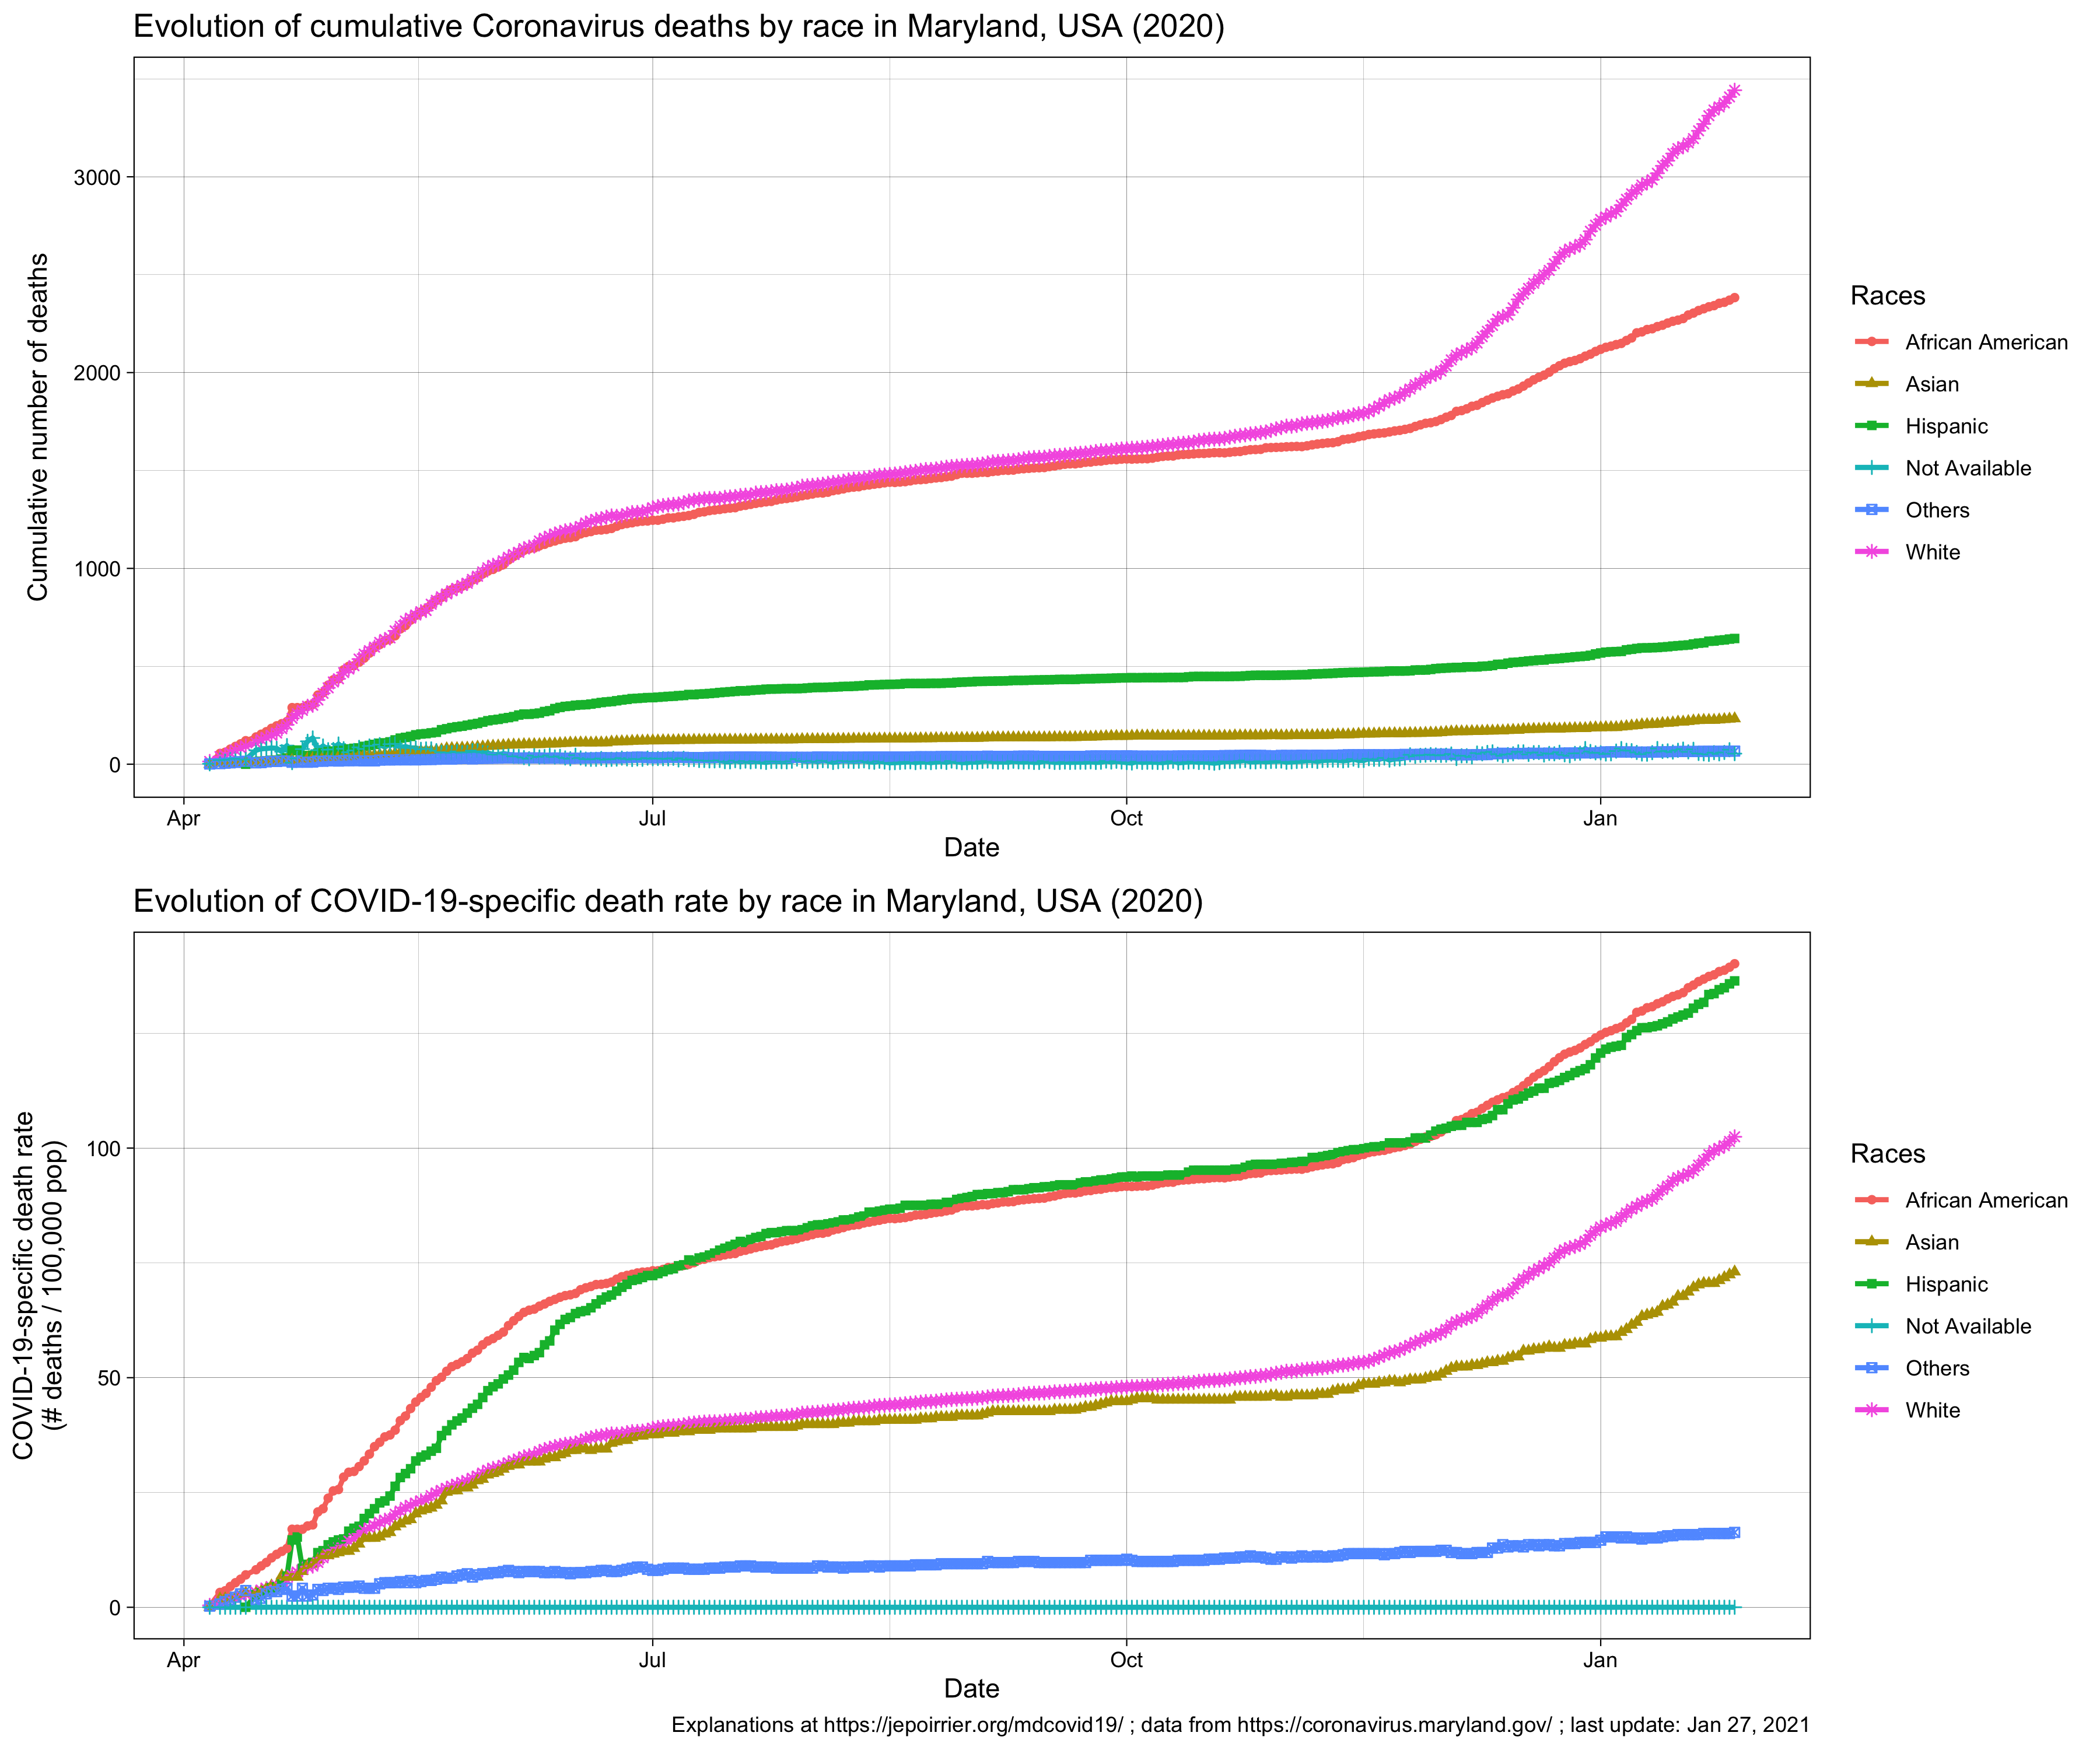
Deaths
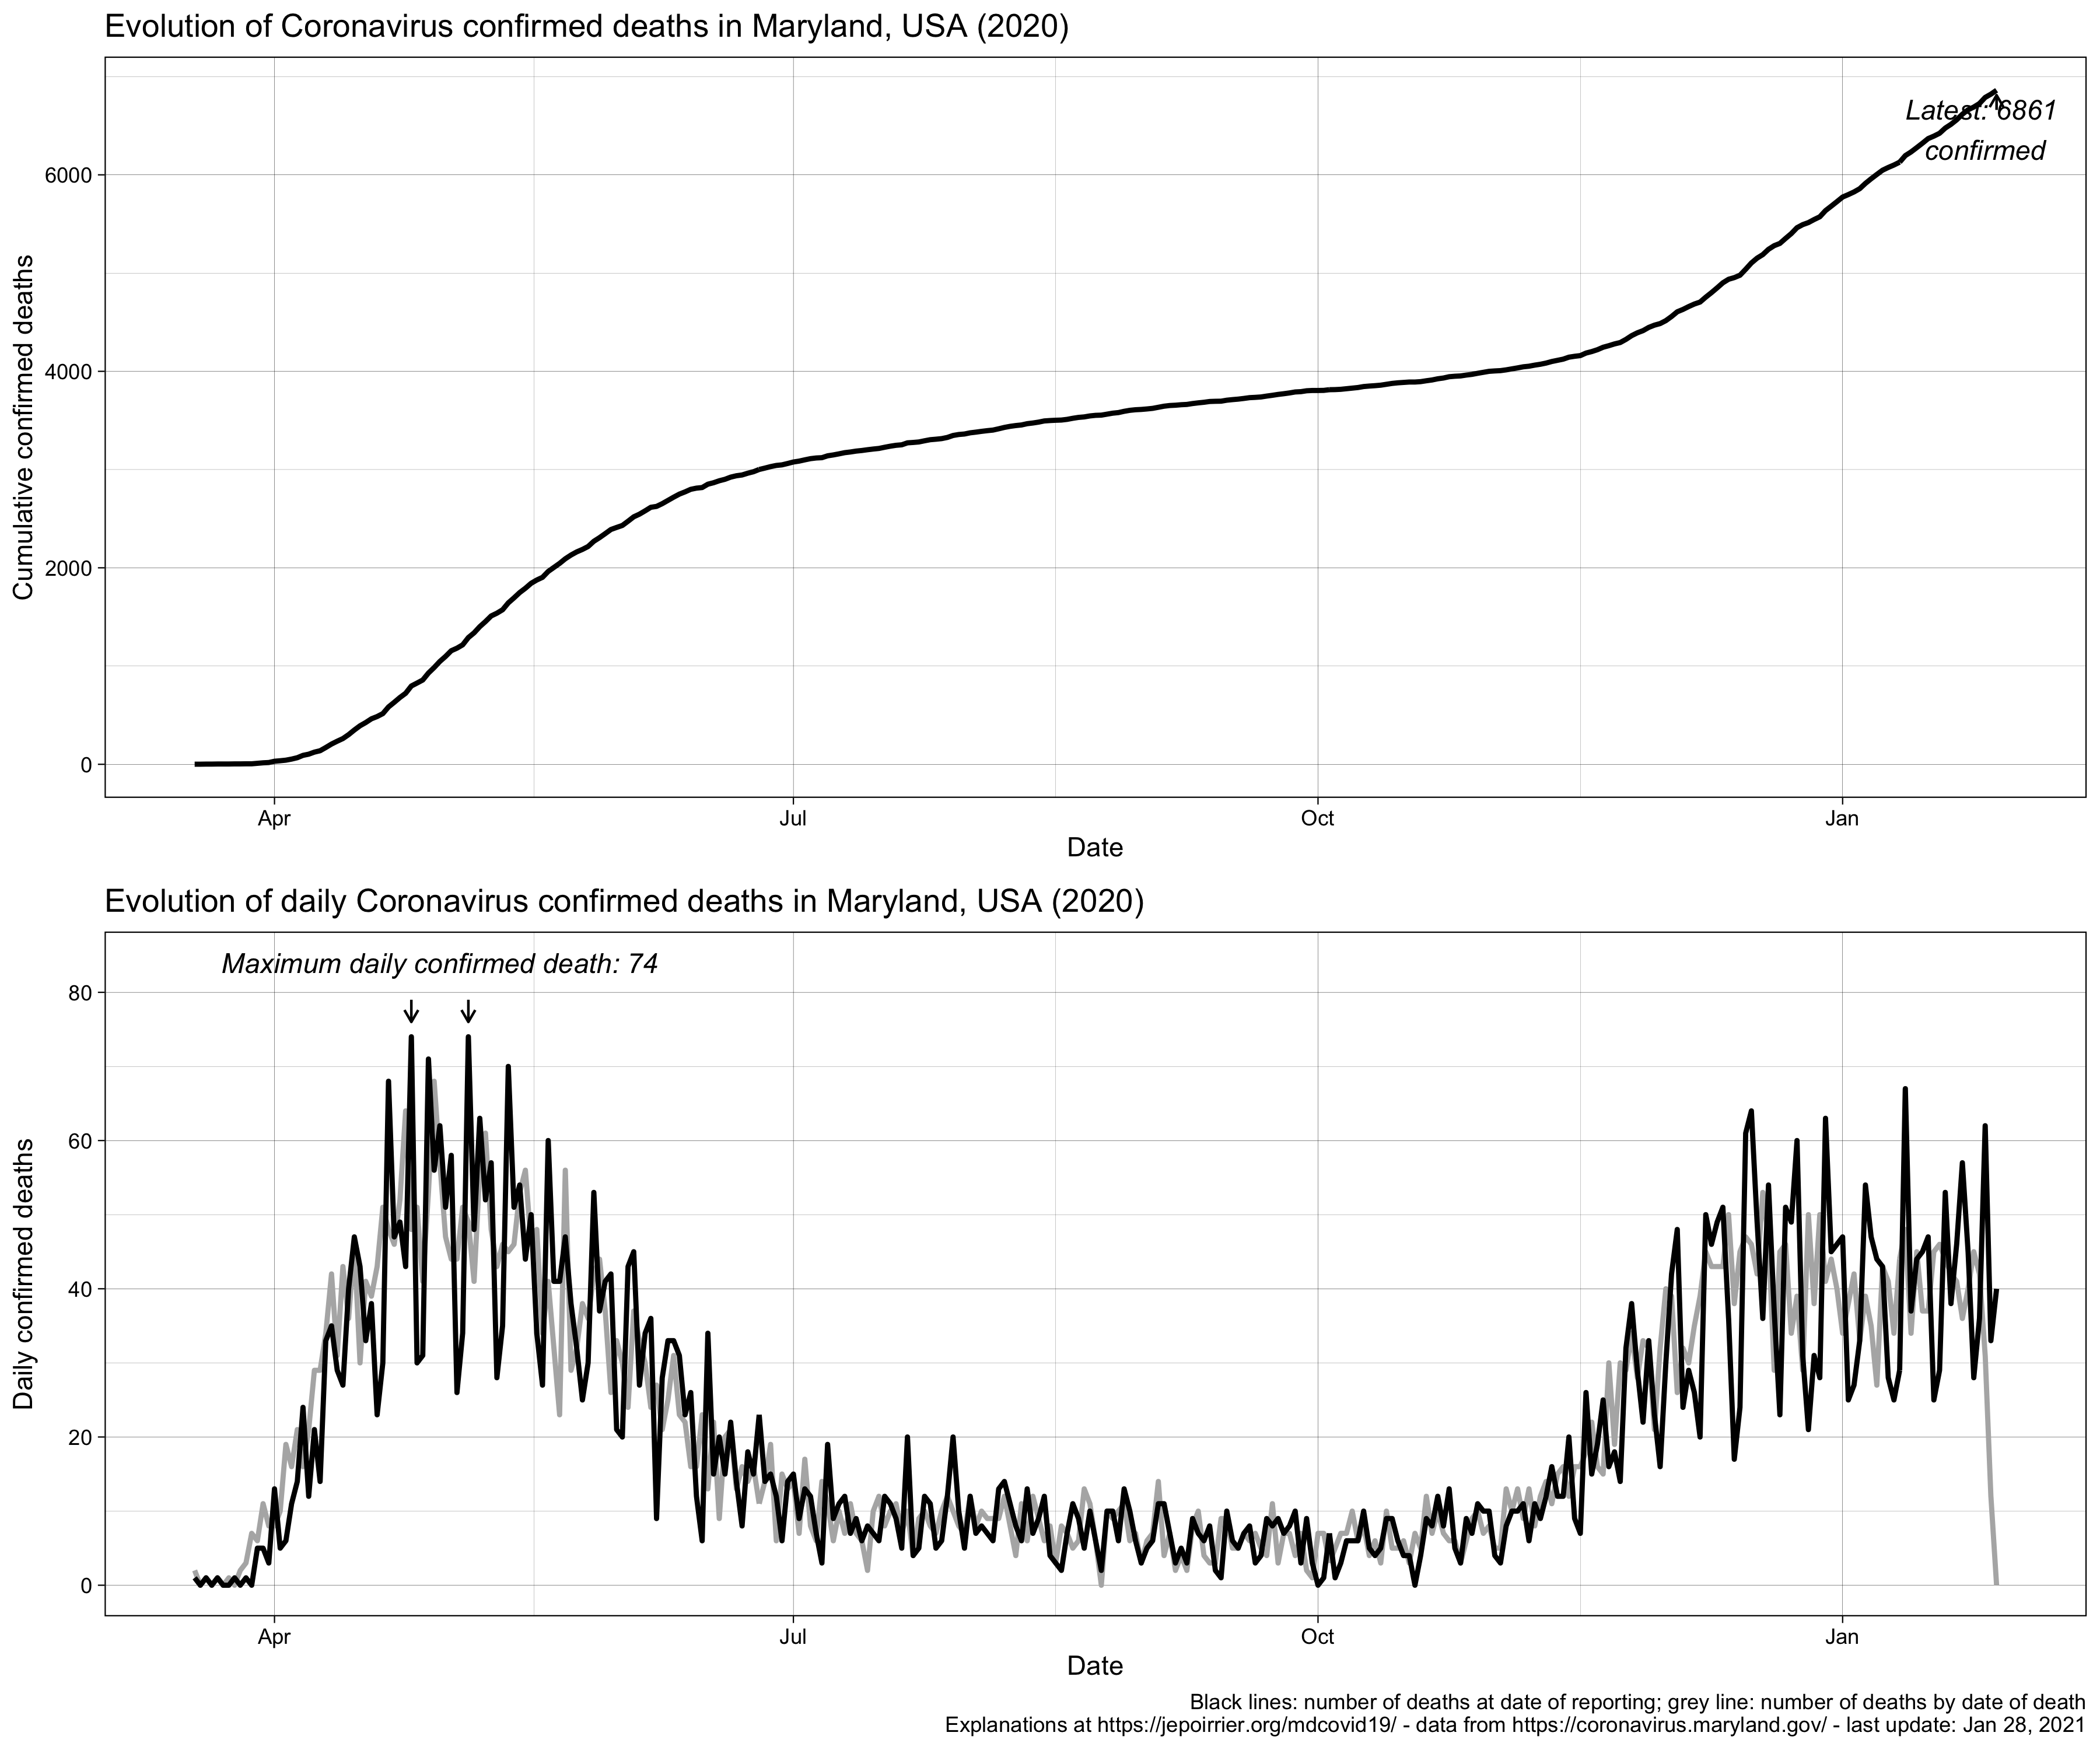
Cumulative and daily number of deaths due to COVID-19 in Maryland, US, 2020
Age

Gender
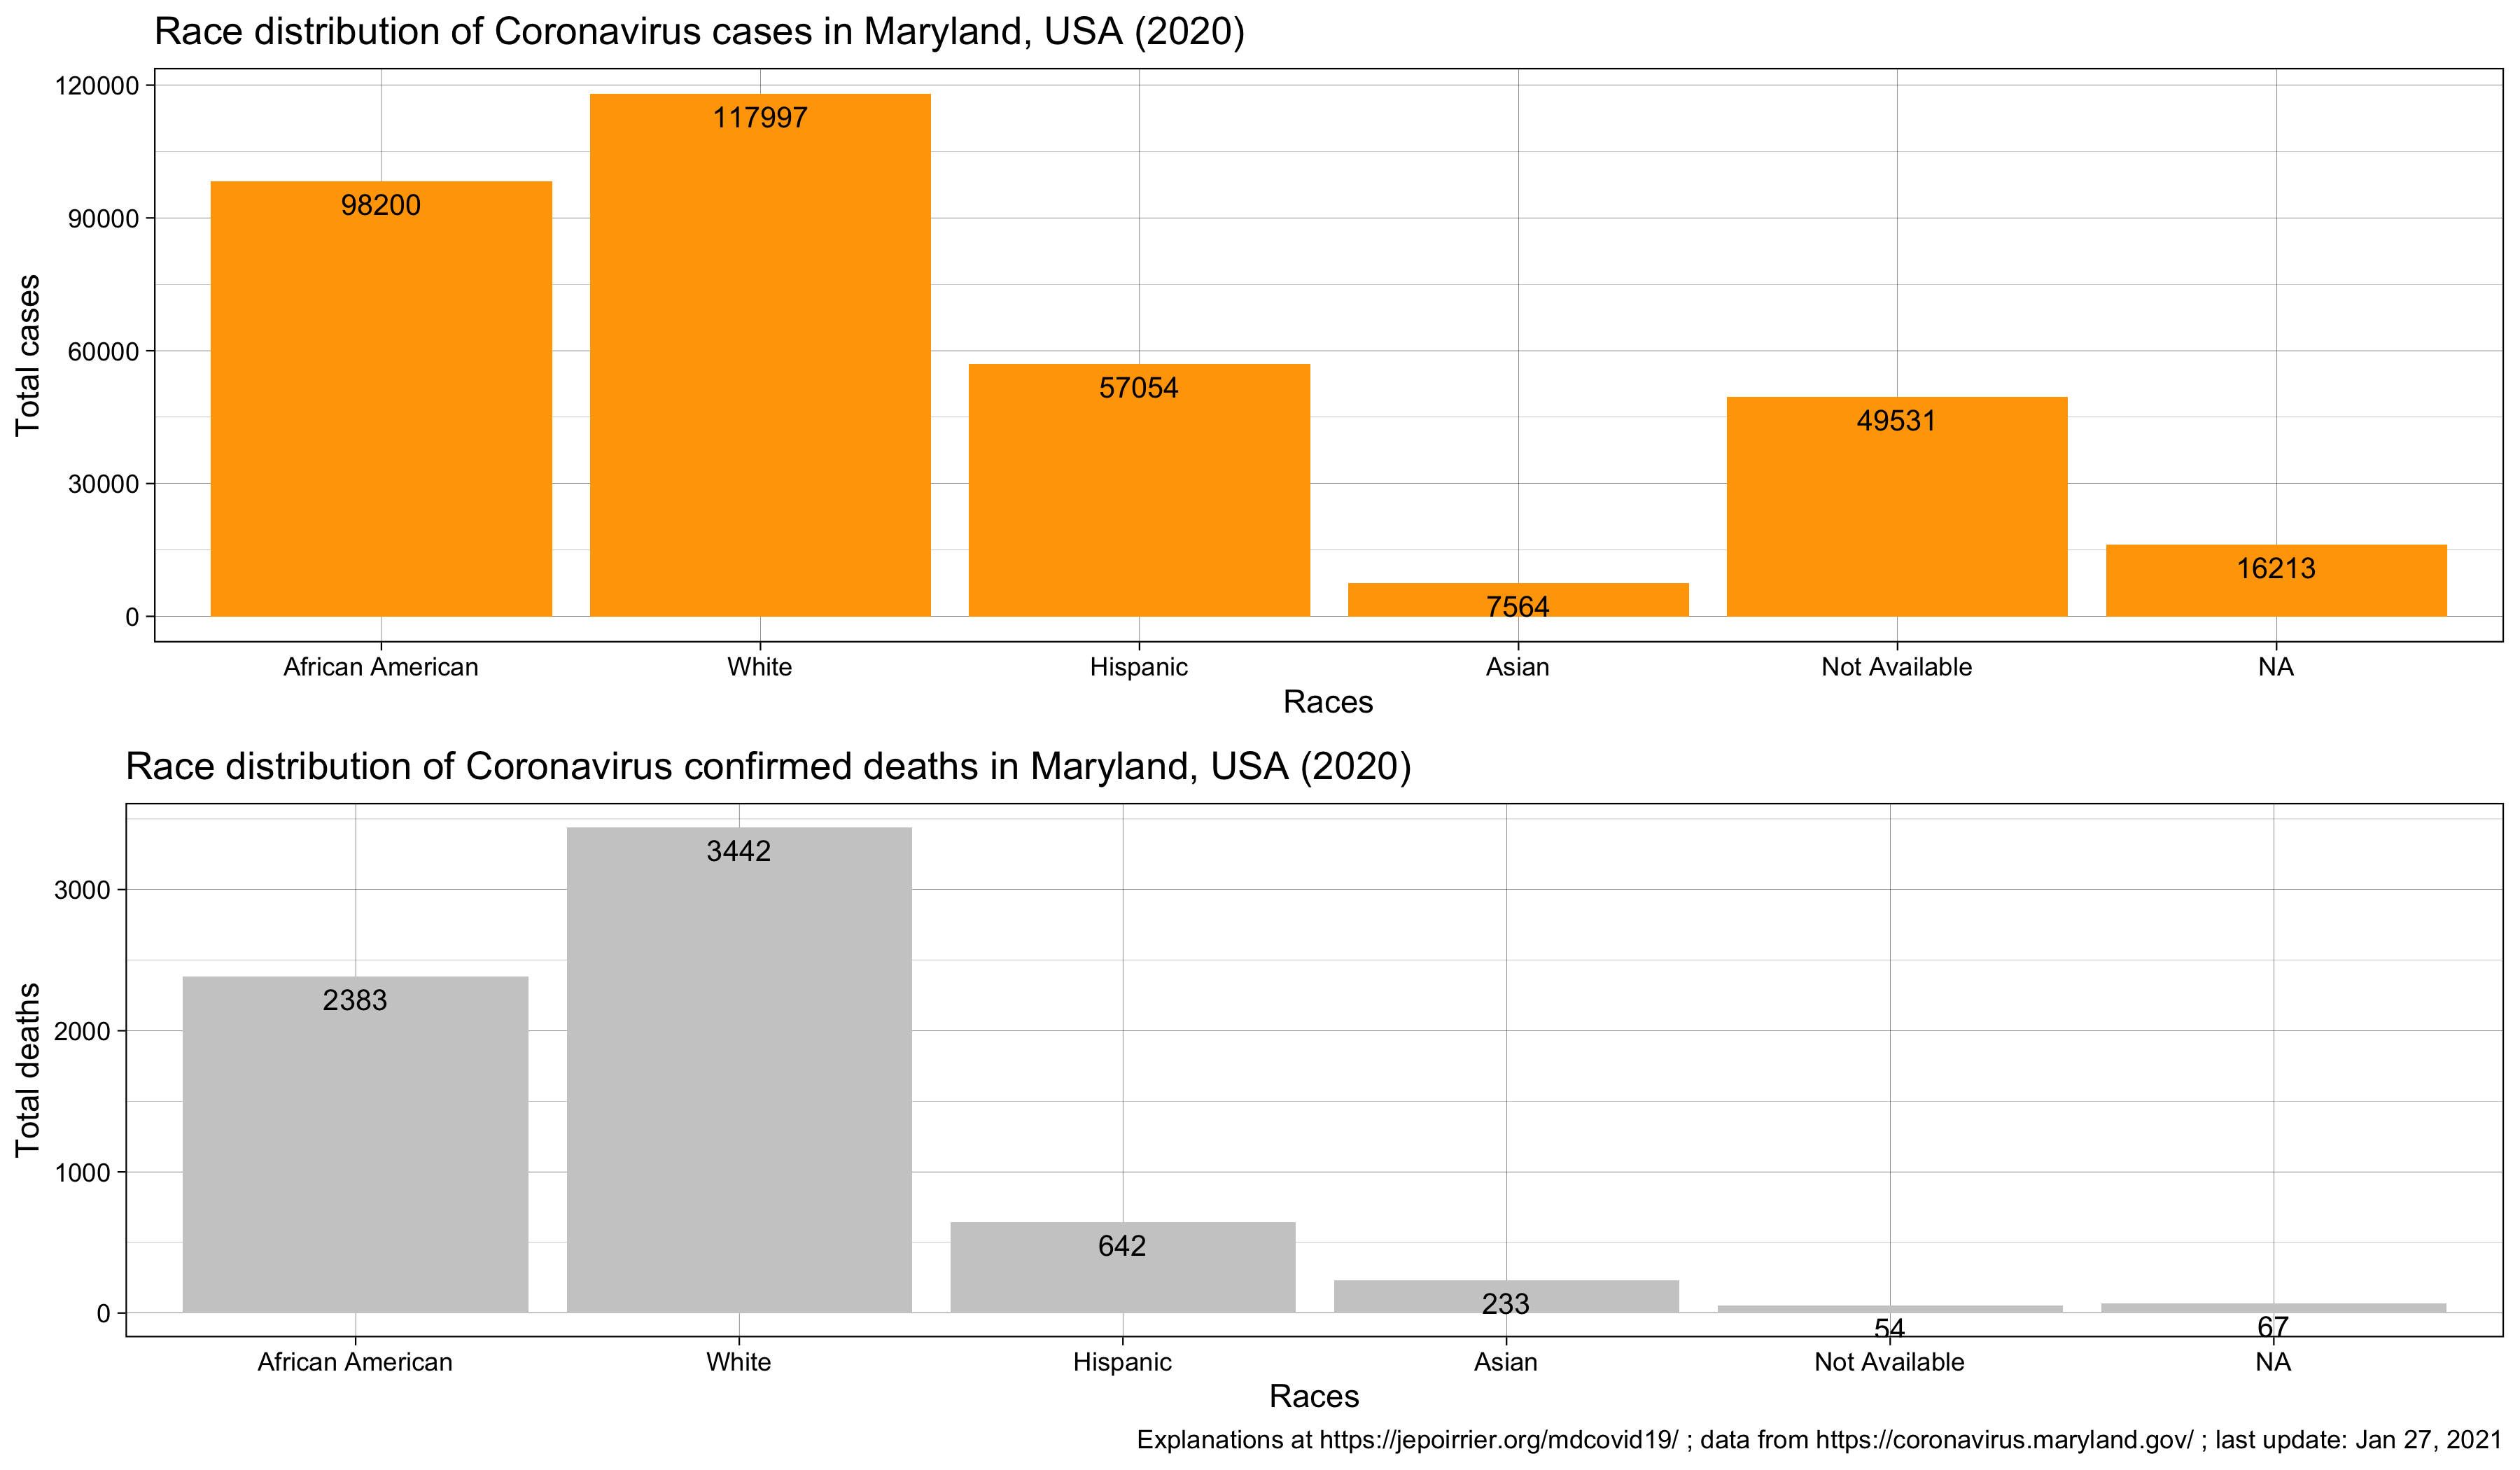
Race
Counties
I wrote about cases in MD counties in May 2020: MD counties COVID-19 cases adjusted for population and MD counties COVID-19-specific death rate,
Zip codes
Nursing homes
COVID-19 cases and deaths in Maryland caused issues because of the way they were reported. I wrote about it in June 2020: Why would Maryland remove COVID-19 cases from nursing homes? But then provided a solution in November 2020, see COVID-19 cases in Maryland congregate living facilities and below.
Contact Tracing